


Air Temperatures – The following maximum temperatures (F) were recorded across the state of Hawaii Monday…along with the low temperatures Monday:
82 – 73 Lihue, Kauai
87 – 75 Honolulu, Oahu
82 – 72 Molokai AP
85 – 67 Kahului AP, Maui
86 – 75 Kailua Kona
84 – 66 Hilo AP, Hawaii
Here are the latest 24-hour precipitation totals (inches) for each of the islands…as of Monday evening:
0.40 Mount Waialeale, Kauai
0.05 Mililani, Oahu
0.01 Puu Alii, Molokai
0.00 Lanai
0.00 Kahoolawe
0.50 West Wailuaiki, Maui
1.88 Puu Waawaa, Big Island
The following numbers represent the strongest wind gusts (mph)…as of Monday evening:
29 Port Allen, Kauai
35 Oahu Forest NWR, Oahu
22 Molokai
27 Lanai
32 Kahoolawe
31 Maalaea Bay, Maui
30 Kealakomo, Big Island
Hawaii’s Mountains – Here’s a link to the live web cam on the summit of near 13,800 foot Mauna Kea on the Big Island of Hawaii. This web cam is available during the daylight hours here in the islands…and when there’s a big moon shining down during the night at times. Plus, during the nights you will be able to see stars, and the sunrise and sunset too…depending upon weather conditions.
Aloha Paragraphs

There’s a low pressure system far north of the state…
with a trailing cold front to our northwest

Scattered low clouds in the area of the islands, with a
cold front well northwest…with lots high clouds south

Clear to partly cloudy…a few cloudy areas

Showers falling locally – Looping radar image
~~~ Hawaii Weather Narrative ~~~
Gusty trade winds remaining active…then easing up by mid-week. Here’s the latest weather map, showing moderately strong high pressure systems well to the north-northeast of Hawaii, and far northwest. At the same time, there’s a nearly stationary cold front/trough well to the northwest of Kauai. A trough of low pressure is expected to edge closer to our area by Wednesday, which will help to soften our trade wind flow for several days. The winds are expected to come in from the east-southeast Thursday into Friday. The models are now showing the winds coming all the way around to the southeast to south by the weekend into early next week, keeping rather hot and sultry conditions over the islands…along with carrying volcanic haze over the smaller islands. If these weather circumstances come to pass, it would be unusual for this time of year!
Here’s a wind profile…of the offshore waters around the islands – with a closer view
Here’s the Hawaiian Islands Sulfate Aerosol animated graphic – showing vog forecast
Showers will favor windward and mountain areas through Tuesday, then a convective weather pattern will develop…bringing afternoon showers and humid conditions for the second half of the week. Satellite imagery shows clear to partly cloudy skies in most places across the state on this first day of the work week, with cloudy areas along the windward sides…and around the mountains. The models continue to point out the chance of an increase in showers around the middle of the week, some of which may become locally heavy. As the winds become lighter during the second half of this week, we will see convective showers popping-up over the leeward slopes during the afternoon hours. If this trough of low pressure remains over the island chain during the weekend, into early next week, we would see more afternoon upcountry showers continuing.
Marine environment details: Trade winds will be gradually declining during the next couple of days. The Small Craft Advisory (SCA) for the typically windy waters around the Big Island and Maui has been cancelled, and there is high confidence that the SCA flag will remain down into early next week. In fact, we could see variable winds develop near the smaller islands during the holiday weekend.
Small surf will dominate on most shores this week. The one exception is a small to moderate southwest swell that will build on Thursday, peak on Friday…then decline during the weekend. This swell will originate from the Tasman Sea, and given the large amount of south Pacific island blocking on swells from this direction, surf locally tends to be inconsistent.
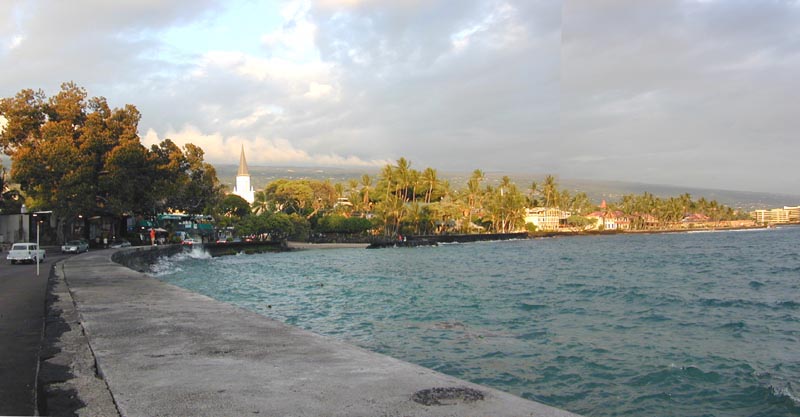
Kailua Kona…on the Big Island of Hawaii
Here on Maui – Monday morning is dawning clear to partly cloudy. Here at my place in upcountry Kula, it’s calm…with an air temperature of 47.6F degrees at 625am. Meanwhile, at about the same time, the Kahului AP was reporting clear skies, with an air temperature of 72 degrees…with a 70 degree reading out in Hana, and 73 at Maalaea Bay. The summit of the Haleakala Crater was 41 degrees.
– Monday afternoon, with generally clear to partly cloudy skies over the leeward beaches, partly to mostly cloudy skies over the windward coasts and slopes, and mostly cloudy over and around the mountains. Here in upcountry Kula, at 410pm, it’s just begun to lightly shower. The air temperature at my weather tower is showing 75.5 degrees, while at near the same time, down at the Kahului AP, it was a warmer 83 degrees…with 48 atop the Haleakala Crater.
– Early evening, partly cloudy conditions in general, with generally nice weather today…more of this expected Tuesday.
World-wide tropical cyclone activity:
>>> Atlantic Ocean: The last regularly scheduled Tropical Weather Outlook of the 2015 Atlantic hurricane season…has occurred. Routine issuance of the Tropical Weather Outlook will resume on June 1, 2016. During the off-season, Special Tropical Weather Outlooks will be issued if conditions warrant. Here’s the 2015 hurricane season summary
Here’s a satellite image of the Atlantic Ocean
>>> Caribbean Sea: The last regularly scheduled Tropical Weather Outlook of the 2015 Atlantic hurricane season…has occurred. Routine issuance of the Tropical Weather Outlook will resume on June 1, 2016. During the off-season, Special Tropical Weather Outlooks will be issued if conditions warrant.
>>> Gulf of Mexico: The last regularly scheduled Tropical Weather Outlook of the 2015 Atlantic hurricane season…has occurred. Routine issuance of the Tropical Weather Outlook will resume on June 1, 2016. During the off-season, Special Tropical Weather Outlooks will be issued if conditions warrant.
Here’s a satellite image of the Caribbean Sea…and the Gulf of Mexico
Here’s the link to the National Hurricane Center (NHC)
>>> Eastern Pacific: No active tropical cyclones
Tropical cyclone formation is not expected during the next 5 days.
Here’s a wide satellite image that covers the entire area between Mexico, out through the central Pacific…to the International Dateline.
Here’s the link to the National Hurricane Center (NHC)
>>> Central Pacific: The central north Pacific hurricane season has officially ended. Routine issuance of the tropical weather outlook will resume on June 1, 2016. During the off-season, special tropical weather outlooks will be issued if conditions warrant. Here’s the 2015 hurricane season summary
Here’s a link to the Central Pacific Hurricane Center (CPHC)
>>> South Pacific Ocean: No active tropical cyclones
>>> North and South Indian Oceans / Arabian Sea: No active tropical cyclones
Here’s a link to the Joint Typhoon Warning Center (JTWC)
Interesting: A Major Source of Air Pollution: Farms – A new study says that emissions from farms outweigh all other human sources of fine-particulate air pollution in much of the United States, Europe, Russia and China. The culprit: fumes from nitrogen-rich fertilizers and animal waste that combine in the air with industrial emissions to form solid particles—a huge source of disease and death. The good news: if industrial emissions decline in coming decades, as most projections say, fine-particle pollution will go down even if fertilizer use doubles as expected. The study appears this week in the journal Geophysical Research Letters.
Agricultural air pollution comes mainly in the form of ammonia, which enters the air as a gas from heavily fertilized fields and livestock waste. It then combines with pollutants from combustion—mainly nitrogen oxides and sulfates from vehicles, power plants and industrial processes—to create tiny solid particles, or aerosols, no more than 2.5 micrometers across, about 1/30 the width of a human hair. The particles can penetrate deep into lungs, causing heart or pulmonary disease; a 2015 study in the journal Nature estimates they cause at least 3.3 million deaths each year globally.
The new study is not the first to flag agricultural pollution; many regional studies, especially in the United States, have shown it as a prime source of fine-particulate precursors. However, the study is perhaps the first to look at the phenomenon worldwide, and to project future trends. It shows that more than half the aerosol ingredients in much of the eastern and central United States come from farming. In Europe and China, the effect is even stronger. The aerosols form mainly downwind of farming areas, in densely populated places where farm emissions combine through a series of chemical reactions with those of cars, trucks and other sources.
“This is not against fertilizer—there are many places, including Africa, that need more of it,” said lead author Susanne Bauer, an atmospheric scientist at Columbia University’s Center for Climate Systems Research and the NASA Goddard Institute for Space Studies. “We expect population to go up, and to produce more food, we will need more fertilizer.”
The fact that agricultural emissions must combine with other pollutants to make aerosols “is good news,” said Bauer. Most projections say that tighter regulation, cleaner sources of electricity and higher-mileage vehicles will cut industrial emissions enough by the end of this century that farm emissions will be starved of the other ingredients necessary to create aerosols. A study this January showed that global industrial nitrogen oxide emissions declined from 2005 to 2014, even as farm emissions boomed. (Fast-growing China and India are exceptions.)
Production of artificial fertilizers has skyrocketed from about 20 million tons in 1950 to nearly 190 million tons today–about a third of them nitrogen-based. Fertilizer production will almost certainly keep growing to keep pace with human population, but the amount of aerosols created as a result depends on many factors, including air temperature, precipitation, season, time of day, wind patterns and of course the other needed ingredients from industrial or natural sources. (In parts of Africa, Asia and the Middle East, aerosols or their precursors come mainly from desert dust, sea spray or wildfires.) The largest increases in farm emissions will probably be in Africa, while the slowest projected growth rates are in Europe, says the study.
Fabien Paulot, an atmospheric chemist with Princeton University and the National Oceanic and Atmospheric Administration who was not involved in the study, said, “You might expect air quality would decline if ammonia emissions go up, but this shows it won’t happen, provided the emissions from combustion go down.” That means that pollutants other than ammonia should probably be targeted for abatement, he said.
Johannes Lelieveld, lead author of the 2015 Nature study disagreed. “The article underscores that all source categories should be controlled,” he said. “One should be cautious about suggesting that food production could be increased” without increasing pollution, he said because that “critically depends” on the assumption that societies will successfully curb industrial emissions. Lelieveld cited the recent scandal over Volkswagen’s fraudulent auto-emissions controls, and pointed out that even with the recent reductions in industrial pollution, most nations including the United States still have large areas that exceed the World Meteorological Organization’s recommended maximum of 10 micrograms of fine particulates per cubic meter.
Bauer says that if future industrial emissions go down, much farm-produced ammonia will end up in earth’s troposphere, roughly 2 to 10 kilometers from the surface. There, lightning and other natural processes may also help create fine particulates—“but it will be so high up, it won’t be a problem for us,” she said. Most of these particles would be trapped by raindrops and removed harmlessly, she says.
All this said, agricultural pollution raises other concerns. Vast quantities of excess fertilizers wash off fields each year, polluting huge watersheds; as just one example, each summer an oxygenless “dead zone” spreads from the mouth of the Mississippi River, fueled by excess nitrogen from upstream. More careful fertilizer application would solve a lot of this, said Bauer. On the other hand, industrial sulfates have been credited with reflecting solar radiation and thus slightly mitigating ongoing global warming caused by other fossil-fuel emissions. “It’s all pollution, but in some sense, some of it is good,” said Bauer. “We have to decide: do we want a small cooling effect, or do we want clean air?”
Glenn Says:
Aloha Glenn
These sites may help John Henry Melancon.
http://waterdata.usgs.gov/hi/nwis/inventory/?site_no=204916156083701&agency_cd=USGS
http://webcache.googleusercontent.com/search?q=cache:XQFLP5MyrF4J:hi.water.usgs.gov/data/adrweb/2005/rain/+&cd=1&hl=en&ct=clnk&gl=us
Glenn in South Jersey
~~~ Hi Glenn, good to hear from you there in NJ. Thanks for the links, I hope they help John find what he’s looking for.
Aloha, Glenn
John Henry Melancon Says:
Aloha Glenn, I have noticed that the highest rainfall total for Maui is often measured at West Wailuaiki. I have searched the internet but a definitive location is difficult to pin down. It seems to be near Ke’anae, but I am curious about the exact location and elevation of the recording station. Thanks, JHM
~~~ Hi John, yes, this windward gauge is often the wettest on Maui, even more so than the Puu Kukui gauge atop the West Maui Mountains on occasion. This website is what I could find concerning the particulars…I hope it has what you are looking for:
http://waterdata.usgs.gov/usa/nwis/uv?16518000
Thanks for using my website John, I appreciate it!
Aloha, Glenn