


Air Temperatures – The following maximum temperatures (F) were recorded across the state of Hawaii Wednesday:
81 Lihue, Kauai
86 Honolulu, Oahu
82 Molokai
88 Kahului, Maui
83 Kailua Kona
81 Hilo, Hawaii
Air Temperatures ranged between these warmest and coolest spots near sea level – and on the highest mountain tops on Maui and the Big Island…as of 543pm Wednesday evening:
Honolulu, Oahu – 83
Hana airport, Maui – 77
Haleakala Summit – 43 (near 10,000 feet on Maui)
Mauna Kea Summit – 37 (13,000+ feet on the Big Island)
Hawaii’s Mountains – Here’s a link to the live web cam on the summit of near 13,800 foot Mauna Kea on the Big Island of Hawaii. This web cam is available during the daylight hours here in the islands…and when there’s a big moon shining down during the night at times. Plus, during the nights you will be able to see stars, and the sunrise and sunset too… depending upon weather conditions.
Aloha Paragraphs

Puu Kukui in the background with the Iao Needle up front…in the
West Maui Mountains
Active trade winds, continuing through the rest
of this week…into next week
The trade winds will bring off and on windward
showers…generally nice weather along our
leeward beaches
Small Craft Wind Advisory…over the windiest
coasts and channels around Maui County and
the Big Island
The following numbers represent the strongest wind gusts (mph), along with directions…as of Wednesday evening:
25 Port Allen, Kauai – NE
27 Oahu Forest NWR, Oahu – NNE
27 Molokai – E
32 Lanai – NE
31 Kahoolawe – NE
31 Kahului, Maui – NE
33 Pali 2, Big Island – NNE
Here are the latest 24-hour precipitation totals (inches) for each of the islands…as of Wednesday evening (545pm totals):
1.73 Kilohana, Kauai
0.65 Tunnel RG, Oahu
0.15 Molokai
0.00 Lanai
0.00 Kahoolawe
0.37 Puu Kukui, Maui
0.30 Saddle Quarry, Big Island
We can use the following links to see what’s going on in our area of the north central Pacific Ocean. Here’s the latest NOAA satellite picture – the latest looping satellite image… and finally the latest looping radar image for the Hawaiian Islands.
~~~ Hawaii Weather Narrative ~~~
Our trade winds are firmly established now…which will be moderately strong through this weekend. Here’s the latest weather map, showing the Hawaiian Islands, and the rest of the North Pacific Ocean, along with a real-time wind profile of the central Pacific…focused on the Hawaiian Islands. We have a strong, near 1038 millibar high pressure system far to our northeast…with well established ridges to the northwest and northeast. As a result of this stronger than normal high pressure cell, our local air flow will remain active, strongest during the days…lightest at night. This classic trade wind episode will continue through the remainder of this week.
Satellite imagery shows fairly minor cloud patches over and around the islands. Looking at this larger satellite image, we see clouds most focused over the ocean to our northeast, and over the waters southwest of the leeward sides of the islands too. Meanwhile, there are fairly minor areas of high clouds being moved around on the upper level winds, to our southeast, northeast, southwest, and far northwest…none of which will influence our weather for the time being. Here’s a looping radar image, showing generally light showers being carried along in our trade wind flow, impacting the windward sides locally. The leeward beaches will have the fewest clouds, which is often the case during such a trade wind weather pattern as we’re now involved with.
Trade winds, some windward showers, and more sunshine in general coming up. We’ll find moderately robust trade winds continuing, at least through the end of the week. This will bring showers to our windward sides in an off and on manner. The leeward sides should have pretty nice weather, with with just a few showers here and there, along with lots of warm sunshine beaming down in most areas. The Kona slopes may see some locally generous showers falling during the afternoons for a while longer…although the beaches in Kona proper should be in good shape. Otherwise, our weather will match climatology more closely now, with no major changes in view from this vantage point. I’ll be back again early Thursday morning with your next new weather narrative, I hope you have a great Wednesday night wherever you’re spending it! Aloha for now…Glenn.
Here on Maui, at the 3,100 foot elevation, at my upper Kula, Maui weather tower, the air temperature was 56.3 degrees at 550am on this Wednesday morning. Skies are mostly clear, although there were some patchy clouds over along the windward sides now, in addition to the normal capping clouds over the West Maui Mountains. It looks to me like we have another really nice day on our hands, with the trade winds being our dominant weather controller…as they should be this time of year. Update at 930am, clouding- up quickly, with showers over on the windward sides now.
We’re into the early afternoon now at 1255pm, under partly to mostly cloudy skies, light trade winds, and and air temperature of 77 degrees. As you may have noticed up above, we have a significant almost 1040 millibar high pressure cell sitting far to the northeast of us. It’s a huge old thing, occupying the area from the Gulf of Alaska, all the way down into the deep tropics (10 north latitude)…and across all of the eastern Pacific into a good part of the central Pacific. It would be hard to stop the trade wind flow now, it would probably take a tropical cyclone moving by to our north, which simply isn’t going to happen anytime soon. This of course has happened many times before…and will happen many times again, at least sometime in the unknown future.
It’s now 530pm on this early Wednesday evening, under partly cloudy skies, near calm winds, and an air temperature of 71.4 degrees. We recently had a very light shower, just enough to wet my weather deck, and my outdoor ping pong table on it. It wasn’t a big deal, and was actually the only moisture we had falling today. Looking over towards the windward sides I see what looks like light showers falling, although according to radar…it’s not very much at the time of this writing.
World-wide tropical cyclone activity:
Atlantic Ocean: The Atlantic hurricane season runs from June 1st through November 30th. Here’s the 2013 hurricane season summary
Here’s a satellite image of the Atlantic Ocean
Caribbean Sea:
Gulf of Mexico:
Here’s a satellite image of the Caribbean Sea…and the Gulf of Mexico.
Here’s the link to the National Hurricane Center (NHC)
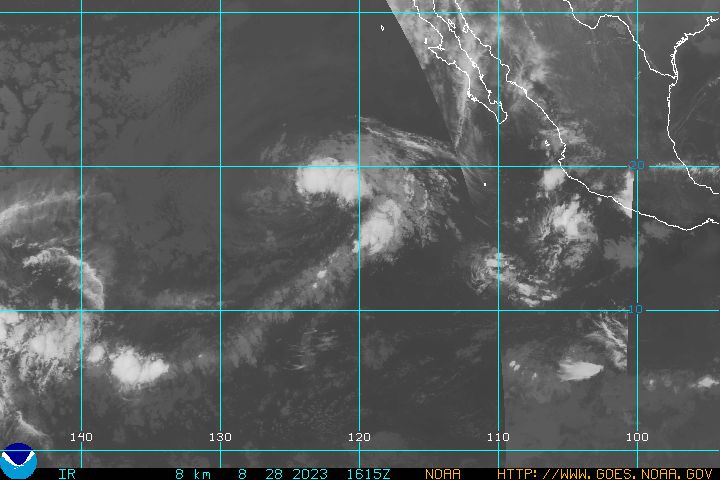
Eastern Pacific: Tropical depression Amanda remains active offshore west of the Mexican coast. Here’s the NHC graphical track map, with a broad satellite picture of the northeastern Pacific…along with a close-up satellite image of this system. Here’s what the computer models are showing for this still strengthening hurricane. Amanda is now the strongest May hurricane on record (category 4) in the eastern Pacific basin during the satellite era. If Amanda would have reached an intensity of 140 knots, it would have become the earliest category 5 hurricane on record, beating out Hurricane Ava of 1973. This tropical cyclone has now weakened back into a tropical depression at the time of this writing.
Here’s a wide satellite image that covers the entire area between Mexico, out through the central Pacific…to the International Dateline.
Central Pacific Ocean: The Central Pacific hurricane begins on June 1st…and runs through November 30th. Here’s the 2013 hurricane season summary / Information about the 2014 hurricane season in the central Pacific Ocean.
Here’s a link to the Central Pacific Hurricane Center (CPHC)
North Pacific Ocean: There are no active tropical cyclones
South Pacific Ocean: There are no active tropical cyclones
North and South Indian Oceans: There are no active tropical cyclones
Here’s a link to the Joint Typhoon Warning Center (JTWC)
Interesting: April Ties For Warmest On Record – Globally, this April was a scorcher, tying with 2010 for the warmest April on record, according to new data released by the National Oceanic and Atmospheric Administration (NOAA) last week. This makes 2014, to date, the sixth warmest year on record going back to 1880 when comparing the first four months. However, if an El Nino event strikes this summer or fall—as seems increasingly likely—global temperatures could rise even more.
April’s temperatures were 1.39 degrees Fahrenheit above the 20th Century average around the world. Europe, Australia, the Middle East, and northern Africa all experienced temperatures well-above average. But the hottest region proved to be Eastern Siberia, where temperatures hit more than 9 degrees Fahrenheit above the 20th Century average. Meanwhile, much of Canada, the U.S. Midwest, and portions of Central Asia were below average.
April 2014 is also a landmark for being the 350th month in a row where global temperatures have been above the 20th Century average: the last time the world had a below-average month was February 1985. Moreover the last time the world had a below average year was 1976. According to NOAA the warmest year on record was 2010.