May 2009
Monthly Archive
Posted by Glenn
1 Comment
May 11-12, 2009
Air Temperatures – The following maximum temperatures were recorded across the state of Hawaii Monday afternoon:
Lihue, Kauai – 80
Honolulu, Oahu – 87
Kaneohe, Oahu – 80
Kahului, Maui – 86
Hilo, Hawaii – 83
Kailua-kona – 84
Air Temperatures ranged between these warmest and coolest spots near sea level – and on the highest mountains…at 4 p.m. Monday afternoon:
Honolulu, Oahu – 85F
Kaneohe, Oahu – 77
Haleakala Crater – 54 (near 10,000 feet on Maui)
Mauna Kea summit – 45 (near 14,000 feet on the Big Island)
Precipitation Totals – The following numbers represent the largest precipitation totals (inches) during the last 24 hours on each of the major islands, as of Monday afternoon:
0.24 Mount Waialaele, Kauai
0.02 Waianae Valley, Oahu
0.00 Molokai
0.00 Lanai
0.00 Kahoolawe
0.03 Oheo Gulch, Maui
0.49 Kealakekua, Big Island
Weather Chart – Here’s the latest (automatically updated) weather map shows a 1026 millibar high pressure system located far NE of the islands. This high pressure cell has a ridge running southwest from its center, to a point northwest of Kauai. The placement of this ridge will provide gradually diminishing wind speeds…varying between east and southeast through Wednesday.
Satellite and Radar Images: To view the cloud conditions we have here in Hawaii, please use the following satellite links, starting off with the Infrared Satellite Image of the islands to see all the clouds around the state during the day and night. This next image is one that gives close images of the islands only during the daytime hours, and is referred to as a Close-up visible image. This next image shows a larger view of the Pacific…giving perspective to the wider ranging cloud patterns in the Pacific Ocean. Finally, here’s a looping IR satellite image, making viewable the clouds around the islands 24 hours a day. To help you keep track of where any showers may be around the islands, here’s the latest animated radar image.
Hawaii’s Mountains – Here’s a link to the live webcam on the summit of near 14,000 foot Mauna Kea on the Big Island of Hawaii. The tallest peak on the island of Maui is the Haleakala Crater, which is near 10,000 feet in elevation. These two webcams are available during the daylight hours here in the islands…and when there’s a big moon rising just after sunset for an hour or two! Plus, during the nights and early mornings you will be able to see stars, and the sunrise too…depending upon weather conditions.
Aloha Paragraphs

Hawaii’s Gold Dust Day Gecko…in Kona
The recent brisk trade wind flow have become lighter now…varying in direction between east and southeast. A high pressure ridge is located a couple of hundred miles northwest of Kauai Monday night. This weather map shows a 1027 millibar high pressure system far to northeast of our islands…with the ridge extending southwest. A cold front to our northwest will push the ridge even closer to the islands, with gradually lighter winds in the process. This week will have light winds in general, with an increasing amount of volcanic haze moving over the smaller islands perhaps later in the week.
We’ll find a few showers, although with the overlying atmosphere quite dry and stable…no heavy precipitation is expected. These few showers will occur on the north and east facing windward sides…and perhaps a few light ones in the upcountry areas during the afternoons too. A late season cold front will approach the islands by the weekend, and make it as far into the state as Kauai. The latest computer output suggests however, that our area will remain on the dry side even then, taking us into next week…which is pretty normal for this time of year.
As noted in the two paragraphs above, we’ll be dealing with lighter winds, and fairly dry conditions this week…along with some haze eventually too probably. Looking at this looping radar image, we see that there are a few showers around late in the day Monday, mostly over the ocean offshore from the island of Kauai. It appears that the showers are being carried along in the easterly trade winds around the Big Island…and south of there. The winds are already shifting towards the southeast over the ocean to the north of Oahu and Kauai.
It’s early Monday evening as I begin writing this last section of today’s weather narrative. Monday was a perfectly fine day here in the islands, with lots of sunshine, and warm to very warm air over our coastal sections. Kahului, Maui rose to 86F degrees during the afternoon…topping out at 87 at the Honolulu airport. The winds were lighter today, compared to the last several days, which gave a bit of a muggy feel to the atmosphere. Looking out the window here in Kihei, before taking the drive back upcountry to Kula, it’s mostly sunny! Checking out this satellite image, we see very few clouds around the islands, with a fairly substantial area of high cirrus clouds shooting by to the south of our islands. It wouldn’t take much of a shift northward, to put those sun dimming high clouds over us, we’ll have to keep an eye on them. ~~~ Ok, I’m about ready to jump in my car now, and really can’t wait to get home. I want to get out there and stretch my legs, take a few deep breaths outside of this air conditioned office. After that, it will be time to eat some of that red sauce pasta that I made last night…yum! I’ll be back here early Tuesday morning with your next new weather narrative. Actually, I’m back just before going to bed, and found during my evening walk that the volcanic haze was starting to thicken up, I’ll let you know what I find in the morning, in terms of this vog. I hope you have a great Monday until then! Aloha for now…Glenn.
Interesting: More children will end up hospitalized over the next decade because of respiratory problems as a result of projected climate change, according to a new study from Mount Sinai School of Medicine. The lead author of this research is Perry Elizabeth Sheffield, MD, Pediatric Environmental Health Fellow in the Department of Community and Preventive Medicine and the Department of Pediatrics at Mount Sinai School of Medicine.*
Mount Sinai worked with Natural Resources Defense Council and the Columbia University Mailman School of Public Health on this eye-opening research that finds a direct connection between air pollution and the health of children. Ozone has many known negative respiratory health effects to which children are particularly vulnerable.
An important projected consequence of climate change is the increase in ground-level ozone. Urban areas such as the New York City metropolitan area are at a higher risk of increasing temperature compared to rural areas. However, while more ozone is formed in higher temperatures, the downwind suburban areas are predicted in some of the models to experience higher ozone levels.
For this study, Dr. Sheffield and her colleagues created a model describing future projected rates of respiratory hospitalizations for children less than two years of age using baseline NYC metropolitan area hospitalization rates from publicly available corresponding state Department of Health databases.
These hospitalization rates were then compared to a previously developed dose-response relationship between ozone levels and pediatric respiratory hospitalizations, and the expected New York City eight-hour daily maximum ozone levels for the 2020s, as projected by a regional climate model created by the NY Climate and Health Project, supported by a grant from the US Environmental Protection Agency.
Two separate future scenarios were used. The two scenarios differed by the amount of projected ozone precursor emissions (chemicals that are converted to ozone by light and heat). In both scenarios, ozone levels rise by 2020. The study found that by 2020, respiratory hospitalizations are projected to rise between four and seven percent for children under two years old because of projected air pollution (ozone) increases.
The scenario with increased ozone precursors showed less of an overall increase in hospital admissions because of a paradoxical reduction in ozone due to the effects of air pollutant interactions, sometimes referred to as the scavenger molecule effect. These are likely conservative estimates because population was held constant, a single dose response function was used for the entire area, and most counties were not weighted by race and ethnicity.
Interesting2: Thousands of small electric scooters, bicycles and wheelchairs throughout Europe and Asia are powered by LifePO4 –- a material used in advanced lithium-ion batteries developed by Université de Montréal researchers. "It’s a revolutionary battery because it is made from non-toxic materials abundant in the Earth’s crust. Plus, it’s not expensive,’" says Michel Gauthier, an invited professor at the Université de Montréal Department of Chemistry and co-founder of Phostech Lithium, the company that makes the battery material.
"This battery could eventually make the electric car very profitable." The theory will soon be tested, since the 100 percent electric Microcar that’s set to debut in Europe this year will be and powered by the LifePO4 battery. Phostech Lithium’s production plant in St. Bruno, Quebec, produces the black LifePO4 powder, which is shipped across the world in tightly sealed barrels.
"The theoretical principle behind the battery was patented by a University of Texas professor in 1995. However, without the work of local chemists such as Nathalie Ravet, we couldn’t have developed it," says Phostech Lithium engineer Denis Geoffroy.
Süd-Chemie, a leading specialty chemistry company based in Germany, first invested in Phostech Lithium in 2005. Now, just four years later, Süd-Chemie’s total Canadian investments have reached $13 million and it stands as the 100% owner of Phostech Lithium. Phostech’s St. Bruno plant began to produce LiFePO4 in 2006 with 20 employees and a 400 metric-ton capacity.
Since then, Phostech has nearly doubled its staff. "It is a battery that is much more stable and much safer," says Dean MacNeil, a professor at the Université de Montréal’s Department of Chemistry and new NSERC-Phostech Lithium Industrial Research Chair in Energy Storage and Conversion. "In addition, it recharges much faster than previous batteries."
Interesting3: Meat eating quality and healthiness are closely related to the amount and type of fat. During the last decade there has been extensive selection towards leaner genotypes which has resulted in reduction of not only undesirable subcutaneous fat, but also in a dramatic decrease in desirable intramuscular fat (commonly known as “marbling” fat).
Intramuscular fat has the key input in meat tenderness and juiciness and a low level of intramuscular fat is associated with dry and unpalatable pork. The challenge which the pig producing industry is facing now is how to increase intramuscular fat without increasing subcutaneous fat?
A project which has recently started at the Institute of Biosensing Technology in collaboration with the Centre for Research in Biomedicine at the University of the West of England (UWE) aims to identify the genes controlling subcutaneous and intramuscular fat deposition.
The end-aim of this work is to provide data which could form a basis for developing a genetic test for intramuscular fat and which could assist pig breeders in genetic selection.
The project is entitled ‘Genetic control of fat partitioning in pigs’ and it is funded by the Genesis Faraday BBSRC Industrial CASE Studentship award. The Genesis Faraday Partnership supports industry-relevant research in the area of genetics and genomics of farm animals and this is the first Genesis Faraday BBSRC CASE Studentship awarded to UWE.
The project is undertaken by PhD student Duncan Marriott under supervision of Dr Olena Doran, Coordinator of Institute of Biosensing Technology. Duncan is a Biology graduate with an MSc in Meat Science and five years experience as a research technician at the University of Bristol’s School of Clinical Veterinary Science and he has an excellent combination of skills and experience to carry out the project.
Duncan Marriott explains, “Pigs need to be leaner to produce healthy meat but to carry sufficient intramuscular fat to maintain good eating quality. The project will be conducted on a number of commercial pig breeds, which differ in intramuscular fat content. My challenge is to identify the genes controlling both the intramuscular and subcutaneous fat content in different breeds.” Olena Doran adds,
“Pork is one of the most consumed meats in Europe and producers are keenly seeking to find ways of producing meat containing high levels of intramuscular fat. The fact that this work is supported by a Genesis Faraday BBSRC CASE Studentship award with a major animal health company as a partner will ensure that the results of this research will have a direct impact to the industry.
Interesting4: Gov. David A. Paterson last week signed an Executive Order to phase out New York State’s purchase and use of bottled water at state agency facilities. The action makes New York the second state in the country to eliminate the purchase and use of bottled water.
The Executive Order will phase out the expenditure of state funds for the purchase of single serve bottles and larger, cooler-sized bottles for water consumed at agency facilities.
The measure requires each executive agency to develop and implement a plan to phase out expenditures for bottled water and provide alternative water sources such as ordinary tap water fountains and dispensers.
"Taxpayers have spent billions of dollars to ensure that we have clean drinking water supplies," said Paterson. "If we are going to make such significant investments, we should reap the benefits and use that water. Our efforts will serve as an example for local governments, businesses, and residents to follow."
Interesting5: A massive iceberg with enough freshwater in it to fill Sydney Harbor 135 times over is about to break off the Mertz glacier in Antarctica. The iceberg will be 75 kilometers long and contains 750,000 giga-liters of ice. Scientists are not sure if it is a natural event or if global warming is to blame. But a joint Australian and French team hope to find out.
The Mertz Glacier is near Commonwealth Bay in East Antarctica. It flows into the southern ocean for 140 kilometers before it drops icebergs into the sea. A large crack has formed about half way along the Mertz Glacier, which means it is going to drop a very large iceberg. French glaciologist Benoit Legresy is measuring the break-up.
"Just at the moment, it’s undergoing a massive calving event which promises to release an iceberg which will be between 20 to 25 kilometers wide and 75 kilometers long by about 400 to 500 meters thick," he said. The iceberg contains enough fresh water to fill Sydney Harbor 135 times – that is 30 per cent of the world’s annual water consumption.
When it breaks off, the iceberg won’t melt straight away because it could take up to 30 years for the currents to move it to water that is warm enough to melt the ice. The scientists realized the large iceberg was forming when they looked at satellite pictures of the Mertz Glacier and saw two large cracks. When the cracks kept getting bigger Benoit Legresy decided to measure the break-up.
Interesting6: California is in its third year of drought, and many farmers in the state’s crop-rich Central Valley are looking at dusty fields, or worse, are cutting down their orchards before the trees die. Hardest hit is Westlands, the biggest irrigated region in the country, where much of the nation’s fruit, nuts and produce come from.
This year, farmers have been told they are getting only a small fraction of the water they need. Farmers throughout this region echo the sentiment that politics, not the drought, is the problem. Most of California gets its water from a huge estuary called the Delta, where two big rivers join in the center of the valley.
But so much water was being pumped out of the Delta that a tiny smelt there, an endangered species, is disappearing. So late last year, a federal judge ruled that the amount of water being delivered to the south had to be sharply cut back.
In April, in a sweltering tin shed in the middle of the Westland’s water district, about 200 farmers gathered to hear what Tom Birmingham had to say about the crisis. Birmingham is the executive director of the irrigation district. Yes, the drought is a problem, he says, but he believes the much bigger problem is that court ruling.
Posted by Glenn
No Comments
May 10-11, 2009
Air Temperatures – The following maximum temperatures were recorded across the state of Hawaii Sunday afternoon:
Lihue, Kauai – 80
Honolulu, Oahu – 85
Kaneohe, Oahu – 80
Kahului, Maui – 87
Hilo, Hawaii – 81
Kailua-kona – 83
Air Temperatures ranged between these warmest and coolest spots near sea level – and on the highest mountains…at 4 p.m. Sunday afternoon:
Honolulu, Oahu – 84F
Lihue, Kauai – 77
Haleakala Crater – 52 (near 10,000 feet on Maui)
Mauna Kea summit – 48 (near 14,000 feet on the Big Island)
Precipitation Totals – The following numbers represent the largest precipitation totals (inches) during the last 24 hours on each of the major islands, as of Sunday afteroon:
0.26 Wailua, Kauai
2.77 Poamoho 2, Oahu
0.01 Molokai
0.09 Lanai
0.00 Kahoolawe
1.08 Puu Kukui, Maui
0.68 Waikii, Big Island
Weather Chart – Here’s the latest (automatically updated) weather map shows a 1025 millibar high pressure system located far NE of the islands. This high pressure cell has a ridge running southwest from its center, to a point northwest of Kauai. The placement of this ridge will provide gradually diminishing wind speeds…varying between east and southeast through Tuesday.
Satellite and Radar Images: To view the cloud conditions we have here in Hawaii, please use the following satellite links, starting off with the Infrared Satellite Image of the islands to see all the clouds around the state during the day and night. This next image is one that gives close images of the islands only during the daytime hours, and is referred to as a Close-up visible image. This next image shows a larger view of the Pacific…giving perspective to the wider ranging cloud patterns in the Pacific Ocean. Finally, here’s a looping IR satellite image, making viewable the clouds around the islands 24 hours a day. To help you keep track of where any showers may be around the islands, here’s the latest animated radar image.
Hawaii’s Mountains – Here’s a link to the live webcam on the summit of near 14,000 foot Mauna Kea on the Big Island of Hawaii. The tallest peak on the island of Maui is the Haleakala Crater, which is near 10,000 feet in elevation. These two webcams are available during the daylight hours here in the islands…and when there’s a big moon rising just after sunset for an hour or two! Plus, during the nights and early mornings you will be able to see stars, and the sunrise too…depending upon weather conditions.
Aloha Paragraphs

Hana Bay…Maui
Our light to moderately strong trade winds will back off some Monday and Tuesday…and then further Thursday through the rest of the new week ahead. A high pressure ridge is located several hundred miles northwest of Kauai Sunday night. This trade wind producing ridge will keep our atmosphere clear of haze, and bring typical trade winds to our islands for the time being. The trade winds vary between east and ESE or even SE as we move through the upcoming week…becoming very light towards the end of the week. Haze may not be a problem for a while, but could push back in over us starting around Thursday or Friday.
The overlying atmosphere remains stable and quite stable, thus limiting our showers…although a few will likely fall here and there. These few showers will occur on the north and east facing windward sides…and perhaps a few light ones in the upcountry areas during the afternoons too. This coming week will find fairly normal precipitation characteristics, with a better chance of showers Friday into the weekend, when a weak cold approaches the state from the northwest directio
n.
The latest computer forecast model guidance now suggests that our trade winds will remain active through the first half of upcoming work week. A couple of cold fronts will get close enough to push our trade wind producing high pressure ridge down fairly close to us going forward. The first of these will occur Monday-Tuesday, and drop our trade wind speeds down a notch in the process. The second will approach around Thursday and Friday, and will take our trade winds down all the way. The best chance for volcanic haze, and more showers, will wait until later in the upcoming work week…into the weekend.
It’s early Sunday evening as I begin writing this last section of today’s weather narrative. I talked to my Mom several times today, letting her know that I was thinking of her on this Mother’s Day. This is a special day for all of our Mom’s, a day to honor and love them, for bringing us into this world. Here’s wishing all you Mom’s a wonderful day, a day full of having all of us kids in the world show our appreciation of you! ~~~ Sunday was a lovely day, and I see no reason to believe that the new week will start off nice. I hope you have a great Sunday night wherever you happen to be spending it! I’ll be back early Monday morning with your next new weather narrative.
Aloha for now…Glenn.
Interesting: Estimates of how much crude oil we have extracted from the planet vary wildly. Now, UK researchers have published a new estimate in the International Journal of Oil, Gas and Coal Technology that suggests we may have used more than we think. The idea that we are running out of oil is not a new one, but do we even know how much oil we have extracted from since the first commercial oil wells were sunk in the middle of the nineteenth century?
In 2008, chemists Istvan Lakatos and Julianna Lakatos-Szabo of the Hungarian Academy of Sciences theorized that less than 100 billion ton of crude oil has been produced since 1850 and that the average annual production rate is less than 700 million barrels per year.
They compared proven reserves and estimates of yet-to-find (YTF) resources and echoed the sentiment that we will soon face oil shortages even though a substantial part of those reserves remain in the ground untapped. Now, John Jones in the School of Engineering, at the University of Aberdeen, UK, suggests that the figures cited by Istvan Lakatos and Julianna Lakatos-Szabo for which they give no references grossly underestimates how much oil we have used already.
Jones says that we have used at least 135 billion barrels of oil since 1870, the period during which J.D. Rockefeller established The Standard Oil Company and began drilling in earnest. The oil industry now spans several generations, says Jones, and has historically been as uninterested in how much oil has been drawn as were economists, day-to-day and annual figures being of much greater concern.
However, in 2005, The Oil Depletion Analysis Centre (ODAC) in London provided a total figure of almost 1 trillion barrels of crude oil (944 billion barrels) since commercial drilling began. Even that figure does not add up, Jones explains. He has calculated a better estimate by using the volume of a barrel (42 US gallons, or 0.16 cubic meter) and a crude oil density of 0.9 tons per cubic meter. ODAC’s 944 billion barrels is thus the equivalent of 135 billion tons.
Interesting2: New research that uses an innovative approach to study, for the first time, the relative contributions of food and exercise habits to the development of the obesity epidemic has concluded that the rise in obesity in the United States since the 1970s was virtually all due to increased energy intake. How much of the obesity epidemic has been caused by excess calorie intake and how much by reductions in physical activity has been long debated and while experts agree that making it easier for people to eat less and exercise more are both important for combating it, they debate where the public health focus should be.
A study presented on Friday at the European Congress on Obesity is the first to examine the question of the proportional contributions to the obesity epidemic by combining metabolic relationships, the laws of thermodynamics, epidemiological data and agricultural data.
"There have been a lot of assumptions that both reduced physical activity and increased energy intake have been major drivers of the obesity epidemic. Until now, nobody has proposed how to quantify their relative contributions to the rise in obesity since the 1970s.
This study demonstrates that the weight gain in the American population seems to be virtually all explained by eating more calories. It appears that changes in physical activity played a minimal role," said the study’s leader, Professor Boyd Swinburn, chair of population health and director of the World Health Organization Collaborating Centre for Obesity Prevention at Deakin University in Australia.
The scientists started by testing 1,399 adults and 963 children to determine how many calories their bodies burn in total under free-living conditions. The test is the most accurate measure of total calorie burning in real-life situations. Once they had determined each person’s calorie burning rate, Swinburn and his colleagues were able to calculate how much adults needed to eat in order to maintain a stable weight and how much children needed to eat in order to maintain a normal growth curve.
They then worked out how much Americans were actually eating, using national food supply data (the amount of food produced and imported, minus the amount exported, thrown away and used for animals or other non-human uses) from the 1970s and the early 2000s.
The researchers used their findings to predict how much weight they would expect Americans to have gained over the 30-year period studied if food intake were the only influence. They used data from a nationally representative survey (NHANES) that recorded the weight of Americans in the 1970s and early 2000s to determine the actual weight gain over that period.
"If the actual weight increase was the same as what we predicted, that meant that food intake was virtually entirely responsible. If it wasn’t, that meant changes in physical activity also played a role," Swinburn said. "If the actual weight gain was higher than predicted, that would suggest that a decrease in physical activity played a role."
The researchers found that in children, the predicted and actual weight increase matched exactly, indicating that the increases in energy intake alone over the 30 years studied could explain the weight increase.
Interesting3: A decision involving the iconic polar bear could determine whether protecting endangered species might also help save the earth from global warming. The Obama administration is approaching a weekend deadline to decide whether it should allow government agencies to cite the federal Endangered Species Act, which protects the bear, for imposing limits on greenhouse gases from power plants, factories and automobiles even if the pollution occurs thousands of miles from where the polar bear lives.
The species law that affords protection for plants, animals and fish that face possible extinction became entangled with the need to reduce pollution linked to global warming more than a year ago. The Interior Department declared the polar bear a threatened species, citing the decline of Arctic sea ice due to global warming.
Posted by Glenn
No Comments
May 9-10, 2009
Air Temperatures – The following maximum temperatures were recorded across the state of Hawaii Saturday afternoon:
Lihue, Kauai – 80
Honolulu, Oahu – 88
Kaneohe, Oahu – 80
Kahului, Maui – 86
Hilo, Hawaii – 83
Kailua-kona – 84
Air Temperatures ranged between these warmest and coolest spots near sea level – and on the highest mountains…at 5 p.m. Saturday evening:
Honolulu, Oahu – 84F
Hilo, Hawaii – 76
Haleakala Crater – 52 (near 10,000 feet on Maui)
Mauna Kea summit – 37 (near 14,000 feet on the Big Island)
Precipitation Totals – The following numbers represent the largest precipitation totals (inches) during the last 24 hours on each of the major islands, as of Saturday afternoon:
0.23 Mount Waialaele, Kauai
0.39 Poamoho 2, Oahu
0.04 Molokai
0.00 Lanai
0.00 Kahoolawe
0.33 West Wailuaiki, Maui
0.32 Pahoa, Big Island
Weather Chart – Here’s the latest (automatically updated) weather map shows a 1027 millibar high pressure system located fa NE of the islands. This high pressure cell has a ridge running south and southwest of it, to a point north of Kauai. The placement of this ridge will provide light trade winds…although stronger and locally gusty in some places through Sunday. Winds becoming lighter Monday, varying between east and southeast.
Satellite and Radar Images: To view the cloud conditions we have here in Hawaii, please use the following satellite links, starting off with the Infrared Satellite Image of the islands to see all the clouds around the state during the day and night. This next image is one that gives close images of the islands only during the daytime hours, and is referred to as a Close-up visible image. This next image shows a larger view of the Pacific…giving perspective to the wider ranging cloud patterns in the Pacific Ocean. Finally, here’s a looping IR satellite image, making viewable the clouds around the islands 24 hours a day. To help you keep track of where any showers may be around the islands, here’s the latest animated radar image.
Hawaii’s Mountains – Here’s a link to the live webcam on the summit of near 14,000 foot Mauna Kea on the Big Island of Hawaii. The tallest peak on the island of Maui is the Haleakala Crater, which is near 10,000 feet in elevation. These two webcams are available during the daylight hours here in the islands…and when there’s a big moon rising just after sunset for an hour or two! Plus, during the nights and early mornings you will be able to see stars, and the sunrise too…depending upon weather conditions.
Aloha Paragraphs

A Hawaiian cat, great colors…named Kula
Light to moderately strong trade winds will blow through Sunday, then weaken again during the new work week…with returning volcanic haze. A high pressure ridge is located several hundred miles north of Kauai Saturday night. This trade wind producing ridge will keep our atmosphere clear of haze, and bring typical trade winds to our islands for the time being. The trade winds will falter again starting Monday, becoming light again through most of the new week ahead…with the good possibility of more haze returning to our island skies.
The overlying atmosphere remains stable, although with the trade winds blowing, we’ll see a few showers arriving along the windward sides…remaining dry along the leeward beaches. What showers that are able to fall, will take aim on the north and east facing windward sides…and perhaps a few light ones in the upcountry areas during the afternoons too. There isn’t very much chance for any heavy showers well into the future…not until a possible increase around the end of the new week ahead.
As noted in the paragraphs above, we have the trade winds back, which have cleared our skies of the volcanic haze. This is a very good thing, to finally see the color blue in the sky again. I suggest everyone gets out there this weekend to enjoy this trade wind flow. The reason I saw that, besides that its a weekend and all, is that the winds will be getting soft again right after the weekend. This in turn may turn our winds very light, and even to the southeast locally…with more voggy weather over us starting Monday.
I went to see another one of those action films I like so much…after work Friday everning. The film was called X-Men Origins: Wolverine (2009), starring Hugh Jackman and Liev Schreiber, among many others. "X-Men Origins: Wolverine" tells the story of Wolverine’s epically violent and romantic past, his complex relationship with Victor Creed, and the ominous Weapon X program. Along the way, Wolverine encounters many mutants, both familiar and new, including surprise appearances by several legends of the X-Men universe.
As is often the case, I was delighted with all the intense action that this film brought to life. I had heard reviews on both sides, some with thumbs up, and others down. I definitely came down on the side of double thumbs up! Just in case you might be slightly curious, here’s a trailer.
It’s early Saturday evening as I begin writing this last section of today’s weather narrative. It’s cloudy up here in Kula, Maui this evening, although I can see sunny weather continuing down near the beaches. Glancing at this looping satellite image, we can see that there’s quite a bit of high cirrus clouds that are streaming up over the islands, carried our way on the strong upper winds aloft. The bulk of these icy clouds are covering the Big Island and Maui at the time of this writing, but may extend up over the rest of the state with time. ~~~ I had a great day, although got skunked in my surfing trip over to Lahaina early this morning. The real fun began when I got to the Seabury Crafts Fair, where there was lots and lots of folks. I had lots of people coming up to me and letting me know that they missed my tv weather show, which I can certainly understand. I drove down to Paia for some food shopping afterwards, and yet another bunch of folks came up to me and told me that they missed the show as well. I totally understand, as there is a part of me that misses it too! ~~~ I’m hunkered in at home this evening, planning on sitting out on my weather deck to see if the high clouds light up an nice shade of orange at sunset. They could put on a fine show again Sunday morning, at which point I’ll be back with your next new weather narrative. I hope you have a great Saturday night until then! Aloha for now…Glenn.
Interesting: Estimates of how much crude oil we have extracted from the planet vary wildly. Now, UK researchers have published a new estimate in the International Journal of Oil, Gas and Coal Technology that suggests we may have used more than we think. The idea that we are running out of oil is not a new one, but do we even know how much oil we have extracted from since the first commercial oil wells were sunk in the middle of the nineteenth century?
In 2008, chemists Istvan Lakatos and Julianna Lakatos-Szabo of the Hungarian Academy of Sciences theorized that less than 100 billion ton of crude oil has been produced since 1850 and that the average annual production rate is less than 700 million barrels per year.
They compared proven reserves and estimates of yet-to-find (YTF) resources and echoed the sentiment that we will soon face oil shortages even though a substantial part of those reserves remain in the ground untapped. Now, John Jones in the School of Engineering, at the University of Aberdeen, UK, suggests that the figures cited by Istvan Lakatos and Julianna Lakatos-Szabo for which they give no references grossly underestimates how much oil we have used already.
Jones says that we have used at least 135 billion barrels of oil since 1870, the period during which J.D. Rockefeller established The Standard Oil Company and began drilling in earnest. The oil industry now spans several generations, says Jones, and has historically been as uninterested in how much oil has been drawn as were economists, day-to-day and annual figures being of much greater concern.
However, in 2005, The Oil Depletion Analysis Centre (ODAC) in London provided a total figure of almost 1 trillion barrels of crude oil (944 billion barrels) since commercial drilling began. Even that figure does not add up, Jones explains. He has calculated a better estimate by using the volume of a barrel (42 US gallons, or 0.16 cubic meter) and a crude oil density of 0.9 tons per cubic meter. ODAC’s 944 billion barrels is thus the equivalent of 135 billion tons.
Interesting2: New research that uses an innovative approach to study, for the first time, the relative contributions of food and exercise habits to the development of the obesity epidemic has concluded that the rise in obesity in the United States since the 1970s was virtually all due to increased energy intake. How much of the obesity epidemic has been caused by excess calorie intake and how much by reductions in physical activity has been long debated and while experts agree that making it easier for people to eat less and exercise more are both important for combating it, they debate where the public health focus should be.
A study presented on Friday at the European Congress on Obesity is the first to examine the question of the proportional contributions to the obesity epidemic by combining metabolic relationships, the laws of thermodynamics, epidemiological data and agricultural data.
"There have been a lot of assumptions that both reduced physical activity and increased energy intake have been major drivers of the obesity epidemic. Until now, nobody has proposed how to quantify their relative contributions to the rise in obesity since the 1970s.
This study demonstrates that the weight gain in the American population seems to be virtually all explained by eating more calories. It appears that changes in physical activity played a minimal role," said the study’s leader, Professor Boyd Swinburn, chair of population health and director of the World Health Organization Collaborating Centre for Obesity Prevention at Deakin University in Australia.
The scientists started by testing 1,399 adults and 963 children to determine how many calories their bodies burn in total under free-living conditions. The test is the most accurate measure of total calorie burning in real-life situations. Once they had determined each person’s calorie burning rate, Swinburn and his colleagues were able to calculate how much adults needed to eat in order to maintain a stable weight and how much children needed to eat in order to maintain a normal growth curve.
They then worked out how much Americans were actually eating, using national food supply data (the amount of food produced and imported, minus the amount exported, thrown away and used for animals or other non-human uses) from the 1970s and the early 2000s.
The researchers used their findings to predict how much weight they would expect Americans to have gained over the 30-year period studied if food intake were the only influence. They used data from a nationally representative survey (NHANES) that recorded the weight of Americans in the 1970s and early 2000s to determine the actual weight gain over that period.
"If the actual weight increase was the same as what we predicted, that meant that food intake was virtually entirely responsible. If it wasn’t, that meant changes in physical activity also played a role," Swinburn said. "If the actual weight gain was higher than predicted, that would suggest that a decrease in physical activity played a role."
The researchers found that in children, the predicted and actual weight increase matched exactly, indicating that the increases in energy intake alone over the 30 years studied could explain the weight increase.
Interesting3: A decision involving the iconic polar bear could determine whether protecting endangered species might also help save the earth from global warming. The Obama administration is approaching a weekend deadline to decide whether it should allow government agencies to cite the federal Endangered Species Act, which protects the bear, for imposing limits on greenhouse gases from power plants, factories and automobiles even if the pollution occurs thousands of miles from where the polar bear lives.
The species law that affords protection for plants, animals and fish that face possible extinction became entangled with the need to reduce pollution linked to global warming more than a year ago. The Interior Department declared the polar bear a threatened species, citing the decline of Arctic sea ice due to global warming.
Posted by Glenn
No Comments
May 8-9, 2009
Air Temperatures – The following maximum temperatures were recorded across the state of Hawaii Friday afternoon:
Lihue, Kauai – 81
Honolulu, Oahu – 86
Kaneohe, Oahu – 79
Kahului, Maui – 83
Hilo, Hawaii – 82
Kailua-kona – 86
Air Temperatures ranged between these warmest and coolest spots near sea level – and on the highest mountains…at 5 p.m. Friday afternoon:
Honolulu, Oahu – 82F
Hilo, Hawaii – 75
Haleakala Crater – 52 (near 10,000 feet on Maui)
Mauna Kea summit – 34 (near 14,000 feet on the Big Island)
Precipitation Totals – The following numbers represent the largest precipitation totals (inches) during the last 24 hours on each of the major islands, as of Friday afternoon:
0.02 Hanapepe, Kauai
0.08 Aloha Tower, Oahu
0.00 Molokai
0.00 Lanai
0.00 Kahoolawe
0.22 West Wailuaiki, Maui
0.16 Kamuela, Big Island
Weather Chart – Here’s the latest (automatically updated) weather map shows a high pressure system located far to the NE of the islands. This high pressure cell has a ridge running south of it, to a point north of Kauai. The placement of this ridge will provide light trade winds…although stronger and locally gusty in some places through Saturday.
Satellite and Radar Images: To view the cloud conditions we have here in Hawaii, please use the following satellite links, starting off with the Infrared Satellite Image of the islands to see all the clouds around the state during the day and night. This next image is one that gives close images of the islands only during the daytime hours, and is referred to as a Close-up visible image. This next image shows a larger view of the Pacific…giving perspective to the wider ranging cloud patterns in the Pacific Ocean. Finally, here’s a looping IR satellite image, making viewable the clouds around the islands 24 hours a day. To help you keep track of where any showers may be around the islands, here’s the latest animated radar image.
Hawaii’s Mountains – Here’s a link to the live webcam on the summit of near 14,000 foot Mauna Kea on the Big Island of Hawaii. The tallest peak on the island of Maui is the Haleakala Crater, which is near 10,000 feet in elevation. These two webcams are available during the daylight hours here in the islands…and when there’s a big moon rising just after sunset for an hour or two! Plus, during the nights and early mornings you will be able to see stars, and the sunrise too…depending upon weather conditions.
Aloha Paragraphs

The Koolau Mountains…windward Oahu
Artist Credit: Gary Reed
The trade winds returned Friday, blowing in the light to moderately strong range generally…whisking all the volcanic haze downwind. These trade wind breezes were very welcome, as they had been on vacation for many days recently. They were replaced by light southeast breezes, which helped to bring volcanic haze over the entire state earlier this week. The way it looks now, the trade winds may falter again by Sunday or Monday…with the possibility of more haze returning then.
These trade winds, as usual, will carry a few windward biased showers our way…although they shouldn’t amount to much in most areas. What few showers that are able to fall, will take aim on the north and east facing windward sides…and perhaps a few in the upcountry areas during the afternoons too. There really isn’t much hope of more widespread well into the future. Perhaps the next chance for an increase in showers would be towards the end of next week.
Since it’s Friday evening, and we’re pushing into a weekend, I’ll go see a new film after work. The film I’ll go watch is another action packed adventure, called X-Men Origins: Wolverine (2009), starring Hugh Jackman and Liev Schreiber, among others. "X-Men Origins: Wolverine" tells the story of Wolverine’s epically violent and romantic past, his complex relationship with Victor Creed, and the ominous Weapon X program. Along the way, Wolverine encounters many mutants, both familiar and new, including surprise appearances by several legends of the X-Men universe.
I know, I know, yet another science fiction fantasy, what can I do, I enjoy this stuff. I’ll be sure to let you know what I thought Saturday morning, that is if anyone’s even interested – smile. Just in case you might be slightly curious, here’s a trailer.
It’s early Friday evening as I begin writing this last section of today’s weather narrative. As noted above, the trade winds came back today, which did a near perfect job of ventilating the volcanic haze downwind, out over the ocean. The sky became blue again Friday, with lots of sunshine beaming down, not at all muted, as it has been most of this week. This will make way for a vivid view of the May full moon tonight! I’ll likely take the drive over to the Lahaina side Saturday morning, as I’d like to go surfing. It’s been a while since I’ve ridden any waves, and look forward to catching some soon. Later in the day Saturday, I’ll probably go to the big crafts fair in upcountry Makawao. Right now though, I’m driving over to Kahului for the new film described in the paragraph above. I’ll be back early Saturday morning with your next new weather narrative, and yes, it is paradise again! I hope you have a great Friday night, I’ll catch up with you again soon, be well until then. Aloha for now…Glenn.
Interesting: Estimates of how much crude oil we have extracted from the planet vary wildly. Now, UK researchers have published a new estimate in the International Journal of Oil, Gas and Coal Technology that suggests we may have used more than we think. The idea that we are running out of oil is not a new one, but do we even know how much oil we have extracted from since the first commercial oil wells were sunk in the middle of the nineteenth century?
In 2008, chemists Istvan Lakatos and Julianna Lakatos-Szabo of the Hungarian Academy of Sciences theorized that less than 100 billion ton of crude oil has been produced since 1850 and that the average annual production rate is less than 700 million barrels per year.
They compared proven reserves and estimates of yet-to-find (YTF) resources and echoed the sentiment that we will soon face oil shortages even though a substantial part of those reserves remain in the ground untapped. Now, John Jones in the School of Engineering, at the University of Aberdeen, UK, suggests that the figures cited by Istvan Lakatos and Julianna Lakatos-Szabo for which they give no references grossly underestimates how much oil we have used already.
Jones says that we have used at least 135 billion barrels of oil since 1870, the period during which J.D. Rockefeller established The Standard Oil Company and began drilling in earnest. The oil industry now spans several generations, says Jones, and has historically been as uninterested in how much oil has been drawn as were economists, day-to-day and annual figures being of much greater concern.
However, in 2005, The Oil Depletion Analysis Centre (ODAC) in London provided a total figure of almost 1 trillion barrels of crude oil (944 billion barrels) since commercial drilling began. Even that figure does not add up, Jones explains. He has calculated a better estimate by using the volume of a barrel (42 US gallons, or 0.16 cubic meter) and a crude oil density of 0.9 tons per cubic meter. ODAC’s 944 billion barrels is thus the equivalent of 135 billion tons.
Interesting2: New research that uses an innovative approach to study, for the first time, the relative contributions of food and exercise habits to the development of the obesity epidemic has concluded that the rise in obesity in the United States since the 1970s was virtually all due to increased energy intake. How much of the obesity epidemic has been caused by excess calorie intake and how much by reductions in physical activity has been long debated and while experts agree that making it easier for people to eat less and exercise more are both important for combating it, they debate where the public health focus should be.
A study presented on Friday at the European Congress on Obesity is the first to examine the question of the proportional contributions to the obesity epidemic by combining metabolic relationships, the laws of thermodynamics, epidemiological data and agricultural data.
"There have been a lot of assumptions that both reduced physical activity and increased energy intake have been major drivers of the obesity epidemic. Until now, nobody has proposed how to quantify their relative contributions to the rise in obesity since the 1970s.
This study demonstrates that the weight gain in the American population seems to be virtually all explained by eating more calories. It appears that changes in physical activity played a minimal role," said the study’s leader, Professor Boyd Swinburn, chair of population health and director of the World Health Organization Collaborating Centre for Obesity Prevention at Deakin University in Australia.
The scientists started by testing 1,399 adults and 963 children to determine how many calories their bodies burn in total under free-living conditions. The test is the most accurate measure of total calorie burning in real-life situations. Once they had determined each person’s calorie burning rate, Swinburn and his colleagues were able to calculate how much adults needed to eat in order to maintain a stable weight and how much children needed to eat in order to maintain a normal growth curve.
They then worked out how much Americans were actually eating, using national food supply data (the amount of food produced and imported, minus the amount exported, thrown away and used for animals or other non-human uses) from the 1970s and the early 2000s.
The researchers used their findings to predict how much weight they would expect Americans to have gained over the 30-year period studied if food intake were the only influence. They used data from a nationally representative survey (NHANES) that recorded the weight of Americans in the 1970s and early 2000s to determine the actual weight gain over that period.
"If the actual weight increase was the same as what we predicted, that meant that food intake was virtually entirely responsible. If it wasn’t, that meant changes in physical activity also played a role," Swinburn said. "If the actual weight gain was higher than predicted, that would suggest that a decrease in physical activity played a role."
The researchers found that in children, the predicted and actual weight increase matched exactly, indicating that the increases in energy intake alone over the 30 years studied could explain the weight increase.
Interesting3: A decision involving the iconic polar bear could determine whether protecting endangered species might also help save the earth from global warming. The Obama administration is approaching a weekend deadline to decide whether it should allow government agencies to cite the federal Endangered Species Act, which protects the bear, for imposing limits on greenhouse gases from power plants, factories and automobiles even if the pollution occurs thousands of miles from where the polar bear lives.
The species law that affords protection for plants, animals and fish that face possible extinction became entangled with the need to reduce pollution linked to global warming more than a year ago. The Interior Department declared the polar bear a threatened species, citing the decline of Arctic sea ice due to global warming.
Posted by Glenn
No Comments
May 7-8, 2009
Air Temperatures – The following maximum temperatures were recorded across the state of Hawaii Thursday afternoon:
Lihue, Kauai – 80
Honolulu, Oahu – 83
Kaneohe, Oahu – 81
Kahului, Maui – 88
Hilo, Hawaii – 84
Kailua-kona – 84
Air Temperatures ranged between these warmest and coolest spots near sea level – and on the highest mountains…at 4 p.m. Thursday afternoon:
Kapalua, Maui – 88F
Kaneohe, Oahu – 79
Haleakala Crater – 54 (near 10,000 feet on Maui)
Mauna Kea summit – 36 (near 14,000 feet on the Big Island)
Precipitation Totals – The following numbers represent the largest precipitation totals (inches) during the last 24 hours on each of the major islands, as of Thursday afternoon:
1.83 Kapahi, Kauai
0.05 Oahu Forest NWR, Oahu
0.00 Molokai
0.00 Lanai
0.00 Kahoolawe
0.40 West Wailuaiki, Maui
0.25 Kahua Ranch, Big Island
Weather Chart – Here’s the latest (automatically updated) weather map shows high pressure systems located far to the NE and NNW of the islands now. A stalled and dissipating frontal boundary will be lifting out soon. We will see light trade winds locally, stronger at times around Maui and the Big Island.
Satellite and Radar Images: To view the cloud conditions we have here in Hawaii, please use the following satellite links, starting off with the Infrared Satellite Image of the islands to see all the clouds around the state during the day and night. This next image is one that gives close images of the islands only during the daytime hours, and is referred to as a Close-up visible image. This next image shows a larger view of the Pacific…giving perspective to the wider ranging cloud patterns in the Pacific Ocean. Finally, here’s a looping IR satellite image, making viewable the clouds around the islands 24 hours a day. To help you keep track of where any showers may be around the islands, here’s the latest animated radar image.
Hawaii’s Mountains – Here’s a link to the live webcam on the summit of near 14,000 foot Mauna Kea on the Big Island of Hawaii. The tallest peak on the island of Maui is the Haleakala Crater, which is near 10,000 feet in elevation. These two webcams are available during the daylight hours here in the islands…and when there’s a big moon rising just after sunset for an hour or two! Plus, during the nights and early mornings you will be able to see stars, and the sunrise too…depending upon weather conditions.
Aloha Paragraphs
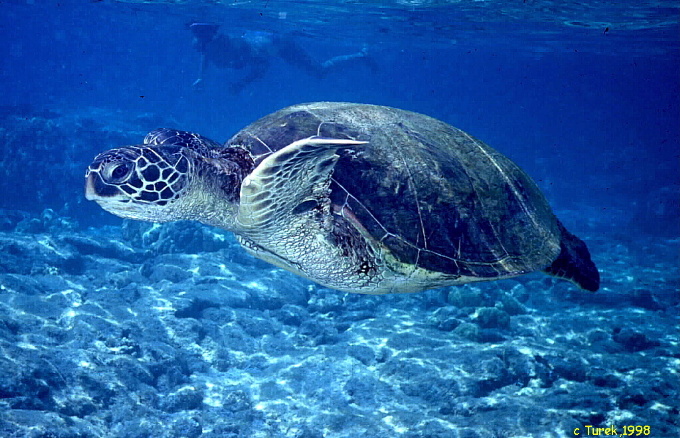
Hawaiian Green Sea Turtle…in clear blue water
We’ll finally begin to see the return of the trade winds, they won’t be very strong, although they may attain moderate strength over the Big Island, and perhaps Maui County…over the next couple of days. The best chance of this happening will be now through the first half of the upcoming weekend. These easterly breezes may not be quite strong enough to ventilate our atmosphere of the hazy conditions completely, but should help some. The computer models suggest that our winds may back down again starting Sunday, allowing the return of light southeast winds…and perhaps another round of more haze then.
As the trade winds will be back around locally, we may see some slight increase in windward biased showers, and a few locally during the afternoons…over the interior sections. The chance of showers may increase modestly, but the intensities will remain generally on the light side, with many areas remaining completely dry. There really isn’t any expectation of more widespread, or heavy rains well into the future. We are definitely getting into our dry late spring season, which of course leads into typically dry summer months.
It’s early Thursday evening as I begin writing this last section of today’s weather narrative. Looking out the window here in Kihei, Maui before I take off for the drive back upcountry, I see partly cloudy conditions. The sky actually is showing a little blue color for a change though, thanks to the light trade winds which are blowing now. This is finally allowing some slight clearing of the vocanic haze, although there is still too much of it around. Speaking of the trade winds, the Kahului airport at around 5pm, was showing light, near 15 mph trades blowing. Speaking of that airport, the high temperature there today was a pretty remarkable 88F degrees!
The record high temperature for today, which occurred back in 2003, was a hot 90 degrees, so we came fairly close to breaking it at least. The Kapalua area, on the upper west side of Maui, hit 88 degrees at 4pm Thursday afternoon, as well. ~~~ One more thing, and I’m home in Kula now, I wanted to let you know that it’s still very voggy here on Maui. Also, I wanted to tell you that South Point down on the Big Island, was having trade wind gusts to 35 mph this afternoon. I just looked at the wind speeds around the Big Island at around 7pm, and another place there, this time a location called Upolu Point, was experiencing 45 mph trade wind gusts! This is really good news as far as having the trade winds hopefully soon blow this haze away! Kden, or ok then for you folks who live outside of the islands, I’m just about out of here. I’ll be back early Friday morning with your next new weather narrative. I hope you have a great Thursday night wherever you happen to be spending it! Aloha for now…Glenn.
Interesting: A new study from Northwestern University shows what many mothers already know: their babies are a lot smarter than others may realize. Though only five months old, the study’s cuties indicated through their curious stares that they could differentiate water in a glass from solid blue material that looked very much like water in a similar glass.
The finding that infants can distinguish between solids and liquids at such an early age builds upon a growing body of research that strongly suggests that babies are not blank slates who primarily depend on others for acquiring knowledge.
That’s a common assumption of researchers in the not too distant past. "Rather, our research shows that babies are amazing little experimenters with innate knowledge," Susan Hespos said. "They’re collecting data all the time." Hespos, an assistant professor of psychology at Northwestern, is lead author of the study, which will appear in the May 2009 issue of Psychological Science.
In a test with one group of infants in the study, a researcher tilted a glass filled with blue water back and forth to emphasize the physical characteristics of the substance inside. Another group of babies looked at a glass filled with a blue solid resembling water, which also was moved back and forth to demonstrate its physical properties.
Next all the infants were presented with test trials that alternated between the liquid or solid being transferred between two glasses. According to the well-established looking-time test, babies, like adults, look significantly longer at something that is new, unexpected or unpredictable.
Interesting2: Cod bycatch was at least 70 per cent higher than target levels on the southern Grand Banks near Canada, holding back recovery of one of the world’s best known fisheries following its spectacular collapse and closure in the early 1990s. Information provided to WWF-Canada also said that European Union boats were responsible for the largest proportion of the overrun in bycatch.
Excessive bycatch of cod has undermined a moratorium imposed in 1994, peaking in 2003, when bycatch amounts were estimated to be over 80 per cent of the remaining cod stock. WWF pushed for a 2008 cod recovery strategy that included setting a bycatch reduction target of 40 per cent for southern Grand Banks cod at the September 2007 annual meeting of the Northwest Atlantic Fisheries Organization (NAFO).
The 40 per cent target was equivalent to a fishing mortality of 420 tons, estimated to be the maximum the population could withstand to still have some chance of recovery. Unofficial 2008 fishing year statistics however show a total of 713 tons of bycatch, with EU boats taking 444 tons – with these figures taking no account of what is believed to be considerable amounts of misreporting and illegal fishing.
Before the results of the 2008 fishing year became available, NAFO stated in a press release that they had “adopted a resolution to implement its commitment to an ecosystem-based fisheries management approach”, an approach contradicted by NAFO increasing the total allowable catches (TACs) for fisheries with high levels of cod bycatch.
Evidence of an increase in young cod in the population was also ignored. “Cod and other fish stocks can never recover as long as NAFO refuses to see the urgency of the bycatch problem and acknowledge that voluntary measures are not working,” said Dr. Robert Rangeley, Vice President Atlantic, WWF-Canada.
“If NAFO’s Scientific Council starts working on solutions at their June meeting then it will be the responsibility of the Fisheries Commission, in September, to impose strict management measures that will give cod recovery a chance.” WWF is now calling on NAFO to take steps that will benefit the ecosystem health and the fisheries of the Grand Banks.
This is entirely consistent with the Ecosystem management approach adopted in the newly revised NAFO Convention. Measures should include the adoption of an effective recovery plan for southern Grand Banks cod that sets long-term recovery goals, immediate bycatch reduction targets, gear-based solutions and closures to protect spawning and nursery areas. The adopted measures will need to be backed by monitoring and enforcement, to be effective.
Interesting3: The U.S. Fish and Wildlife Service today announced that it is launching a full status review to determine whether the American pika, a small, alpine-dwelling relative of the rabbit that is imperiled by global warming, warrants the protections of the Endangered Species Act. The decision comes in response to a scientific petition submitted by the Center for Biological Diversity in October 2007 seeking protection for the species, followed by an August 2008 lawsuit against the Service for failing to respond to the petition.
As a result of today’s decision, the pika will become the first mammal considered for protection under the Act due to global warming in the continental United States outside of Alaska. The Service’s decision comes under court order 16 months after the legal deadline. The Service is now required to decide whether the pika will be designated as an endangered species by February 1, 2010.
"We are pleased that the Fish and Wildlife Service has decided to take the pika’s plight seriously," said Greg Loarie, an attorney with Earthjustice, which is representing the Center in the case. "The pika’ shrinking habitat is a harbinger of what may happen to many species if we don’t address global warming now."
Interesting4: The Galapagos Islands rank right up there with the Amazon and the Serengeti as one of the richest and best known, yet fragile and threatened, ecosystems in the world. Now, the Ecuadoran government is looking to a range of alternative energy resources to make sure it stays that way.
Recognized by the UN as a World Heritage Site for its rare and unique marine and terrestrial fauna and flora, booming eco-tourism in the Galapagos, ironically, has added to the challenges and problems faced by those looking to restore and protect the island’s native species and ecological balance.
The Ecuadoran government has turned to wind and solar power as a means of realizing its goals. Along with a range of international aid organizations and private sector businesses, it’s working to eliminate the use of fossil fuels on the Galapagos Islands by 2015 The Ecuadoran government’s projects in the Galapagos clearly demonstrate the significant long- and short-term advantages and benefits renewable energy resources and technology can provide.
As project participants expect to demonstrate, a diversified base of clean, renewable energy systems can reliably and economically supply electrical power needs with a much smaller physical footprint, and with little or no environmental risk and damage as compared to their fossil fuel counterparts.
Interesting5: U.S. sales of organic products, both food and non-food, reached $24.6 billion by the end of 2008, growing an impressive 17.1 percent over 2007 sales despite tough economic times, according to the Organic Trade Association (OTA), which today made available final results from its 2009 Organic Industry Survey. While the overall economy has been losing ground, sales of organic products reflect very strong growth during 2008. "Organic products represent value to consumers, who have shown continued resilience in seeking out these products," said Christine Bushway, OTA’s Executive Director.
The survey, conducted by Lieberman Research Group on behalf of OTA, measured the growth of U.S. sales of organic foods and beverages as well as non-food categories such as organic fibers, personal care products and pet foods during 2008. Results show organic food sales grew in 2008 by 15.8 percent to reach $22.9 billion, while organic non-food sales grew by an astounding 39.4 percent to reach $1.648 billion. As a result, organic food sales now account for approximately 3.5 percent of all food product sales in the United States.
Interesting6: New research coming out of the United Kingdom (U.K.) suggests that the amount of salt in seawater is varying in direct response to man-made climate change. Working with colleagues to sift through data collected over the past 50 years, Peter Stott, head of climate monitoring and attribution at the Met Office in Exeter, England, studied whether or not human-induced climate change could be responsible for rises in salinity that have been recorded in the subtropical regions of the Atlantic Ocean, areas at latitudes immediately north and south of Earth’s tropics.
By comparing the data to climate models that correct for naturally occurring salinity variations in the ocean, Stott has found that man-made global warming — over and above any possible natural sources of global warming, such as carbon dioxide given off by volcanoes or increases in the heat output of the sun — may be responsible for making parts of the North Atlantic Ocean more salty.
Salinity levels are important for two reasons. First, along with temperature, they directly affect seawater density (salty water is denser than freshwater) and therefore the circulation of ocean currents from the tropics to the poles.
These currents control how heat is carried within the oceans and ultimately regulate the world’s climate. Second, sea surface salinity is intimately linked to Earth’s overall water cycle and to how much freshwater leaves and enters the oceans through evaporation and precipitation. Measuring salinity is one way to probe the water cycle in greater detail.
Interesting7: The sun kicked up a whopping storm Tuesday and more yesterday, as seen by the orbiting STEREO-B spacecraft. The activity is hidden from our terrestrial view, so scientists are eager for a better look. They think two sunspot regions are involved. Today astronomers are waiting to see if a sunspot rotates into view, as expected.
Sunspots are dark regions where strong magnetic activity puts a lid on the release of energy below. When it blows, it’s like the cork popping off a champagne bottle, and a solar flare and space storm of charged particles is produced.
Scientists are presently wondering if the recent quietude, which has lasted longer than normal in a natural 11-year cycle of high and low activity, means much. One worry — not much of a worry, the experts say — is the potential for a Little Ice Age.
More likely, astronomers figure, the cycle will return to a high point with a vengeance in 2012, potentially kicking up storms that could bring modern technology to its knees.
Posted by Glenn
No Comments
May 6-7, 2009
Air Temperatures – The following maximum temperatures were recorded across the state of Hawaii Wednesday afternoon:
Lihue, Kauai – 80
Honolulu, Oahu – 83
Kaneohe, Oahu – 81
Kahului, Maui – 87
Hilo, Hawaii – 83
Kailua-kona – 83
Air Temperatures ranged between these warmest and coolest spots near sea level – and on the highest mountains…at 4 p.m. Wednesday afternoon:
Poipu, Kauai – 84F
Hilo, Hawaii – 77
Haleakala Crater – 54 (near 10,000 feet on Maui)
Mauna Kea summit – 41 (near 14,000 feet on the Big Island)
Precipitation Totals – The following numbers represent the largest precipitation totals (inches) during the last 24 hours on each of the major islands, as of Wednesday afternoon:
0.03 Hanapepe, Kauai
0.08 Poamoho 2, Oahu
0.01 Molokai
0.00 Lanai
0.00 Kahoolawe
0.01 Puu Kukui, Maui
0.06 Kamuela Upper, Big Island
Weather Chart – Here’s the latest (automatically updated) weather map shows a 1028 millibar high pressure system located far to the NE of the islands now. This high’s associated ridge extends SW to just north and northeast of Kauai. Our winds will remain generally light southeasterlies through Friday…with daytime onshore sea breezes.
Satellite and Radar Images: To view the cloud conditions we have here in Hawaii, please use the following satellite links, starting off with the Infrared Satellite Image of the islands to see all the clouds around the state during the day and night. This next image is one that gives close images of the islands only during the daytime hours, and is referred to as a Close-up visible image. This next image shows a larger view of the Pacific…giving perspective to the wider ranging cloud patterns in the Pacific Ocean. Finally, here’s a looping IR satellite image, making viewable the clouds around the islands 24 hours a day. To help you keep track of where any showers may be around the islands, here’s the latest animated radar image.
Hawaii’s Mountains – Here’s a link to the live webcam on the summit of near 14,000 foot Mauna Kea on the Big Island of Hawaii. The tallest peak on the island of Maui is the Haleakala Crater, which is near 10,000 feet in elevation. These two webcams are available during the daylight hours here in the islands…and when there’s a big moon rising just after sunset for an hour or two! Plus, during the nights and early mornings you will be able to see stars, and the sunrise too…depending upon weather conditions.
Aloha Paragraphs

A beautiful walk along the shore!
Light trade winds, or light southeast breezes, both overpowered by onshore sea breezes during the days…and offshore flowing land breezes at night. The latest forecast keeps the return of a more pronounced trade wind flow, until sometime early next week. If this turns out to be true, our light winds, dry weather, and hazy conditions will persist for many more days. Our high pressure ridge, as of early Wednesday evening, is located not far north of Kauai…as shown on this weather map.
The close proximity of the high pressure ridge will not only keep our winds light, but our overlying atmosphere rather dry. We will find clear to partly cloudy mornings, which will give way to cloudy afternoons locally. The air mass over our islands is dry and stable, which will continue to greatly limit any showers from falling. Whatever few showers that do manage to drop, will end up over and around the mountains…during the afternoon hours. Don’t look for any increase in showers until at least early next week, maybe.
The winds have shifted just enough now, that at least some of the volcanic haze has been pushed just to the south of the islands. This will keep our atmosphere at least a little hazy however, through much of the rest of this week. It will take the returning trade winds to ventilate this haze away. The daytime heating, coupled with the light winds, will generate lots of afternoon clouds…and a generally more sultry reality than we’re used to seeing during the spring month of May.
It’s early Wednesday morning as I begin writing this last section of today’s weather narrative. I’m about ready to take the drive back home to Kula. Here in Kihei before I leave, I can see that it’s at least partly cloudy out there. The haze situation has improved a little, although it is far from perfect in terms of air quality. We could see the return of most of this haze, which has shifted to our south, but at least for the moment, there are slightly better visibilities for the moment. I’ll be back early Thursday morning with your next new weather narrative, I hope you have a great Wednesday night until then! Aloha for now…Glenn.
Interesting: A Hyena’s giggle is not actually laughter, but a sound of frustration. New research found a way to distinguish individual hyenas based on the peculiarities of their, well, let’s call them fighting words. Until now these squeaky cackles have not been well understood by scientists. Researchers recorded the sounds and did the first ever acoustic analysis of them to understand how the calls vary between individuals, and when they are used.
The scientists found that hyenas usually made these noises when they were fighting for food, or in some kind of social conflict. "When a group of hyenas is feeding upon the prey you hear a lot of these giggles, especially during conflict between two individuals," said biologist Nicolas Mathevon of the Jean Monnet University in France, who is a visiting professor at the University of California, Berkeley.
Mathevon and colleagues monitored 17 captive hyenas at Berkeley, and measured the length, frequency (pitch) and the amplitude (volume) of each of their giggles. They found that the pitch of the sound depended on the hyena’s social status: Subordinate individuals made noises that were more varied and higher in pitch.
Interesting2: A new study out of the University of Pittsburgh suggests that a moderate dose of alcohol increases a person’s mind wandering, while at the same time reducing the likelihood of noticing that one’s mind has wandered. The study provides the first evidence that alcohol disrupts an individual’s ability to realize his or her mind has wandered, suggesting impairment of a psychological state called meta-consciousness.
These findings suggest that distinct processes are responsible for causing a thought to occur, as opposed to allowing its presence to be noticed. Led by University of Pittsburgh professor of psychology Michael Sayette, researchers Erik Reichle, associate professor and chair of Pitt’s cognitive program in psychology, and Jonathan Schooler, professor of psychology at University of California, Santa Barbara, studied a group of men-half of whom had consumed alcohol and half of whom had been given a placebo.
After 30 minutes, the participants began reading a portion of Tolstoy’s “War and Peace” from a computer screen. If they caught themselves zoning out-having no idea what they had just read or thinking about something other than the text-they pressed a key on the keyboard. They also were prompted at intervals, to see if they could be “caught” mind-wandering before they realized it themselves.
The results revealed that while they were reading the text those who had consumed alcohol were mind-wandering without realizing it about 25 percent of the time-more than double that of those who had not consumed alcohol. But as far as “catching themselves” zoning out, those who had been drinking were no more likely to do so than the other group.
Participants in the alcohol group would have had many more opportunities to catch themselves because they zoned out more often-but they did not. They were impaired in their ability to notice their own mind-wandering episodes. “Researchers have known for a while that alcohol consumption can interfere with our limited-capacity powers of concentration,” said Sayette.
“But this “double-whammy,” (i.e., more zone outs that take longer to recognize) may explain why alcohol often disrupts efforts to exercise self-control-a process requiring the ability to become aware of one’s current state in order to regulate it.”
Interesting3: When pandemics occur, correctional facilities are not immune. With more than 9 million people incarcerated across the globe 2.25 million in U.S. jails and prisons alone it is vital that correctional officials and health professionals be prepared for a worst-case scenario that involves pandemic influenza reaching inmates and staff.
With collaborative planning and training, prison and public health officials can help control influenza outbreaks behind bars, according to an article in the April issue of the Journal of Correctional Health Care. A two-day conference on prison pandemic preparedness held in Georgia in 2007 could serve as a model for such training.
Administrators, medical doctors, registered nurses, physician assistants, and pharmacists were among the participants, as well as state and local public health officials. The objectives were to educate participants about pandemic flu issues in prison settings, provide impetus for initial planning in Georgia’s prisons, and elicit ideas about how the prisons could best prepare for and respond to pandemic flu. Topics included nonpharmaceutical interventions, health care surge capacity, and prison-community interfaces.
Effective training about pandemic influenza requires more than just classroom lectures or checklists, the authors write. The conference employed interactive methods and educational games that recent studies have found effective in training ”adult learners.”
Experiential learning closely resembles the way adults learn on the job and offers a more hands-on approach compared to traditional didactic, classroom-based learning. The training techniques appeared to be very effective. Scores on a test after the training were an average of 69% correct compared to a pretest, which had an average score of 42% correct. As important, the conference served to forge new partnerships among correctional health and public health officials responsible for pandemic planning.
Interesting4: Sharks, barracuda and other large predatory fishes disappear on Caribbean coral reefs as human populations rise, endangering the region’s marine food web and ultimately its reefs and fisheries, according to a sweeping study by researcher Chris Stallings of The Florida State University Coastal and Marine Laboratory. While other scientists working in the Caribbean have observed the declines of large predators for decades, the comprehensive work by Stallings documents the ominous patterns in far more detail at a much greater geographic scale than any other research to date.
His article on the study, "Fishery-Independent Data Reveal Negative Effect of Human Population Density on Caribbean Predatory Fish Communities," is published in the May 6, 2009 issue of the journal PLoS One. "Seeing evidence of this ecological and economic travesty played out across the entire Caribbean is truly sobering," said Associate Professor John Bruno of the University of North Carolina at Chapel Hill, who served as the PLoS One academic editor for Stallings’ paper.
"I examined 20 species of predators, including sharks, groupers, snappers, jacks, trumpetfish and barracuda, from 22 Caribbean nations," said Stallings, a postdoctoral associate at the FSU Coastal and Marine Laboratory. "I found that nations with more people have reefs with far fewer large fish because as the number of people increases, so does demand for seafood.
Fishermen typically go after the biggest fish first, but shift to smaller species once the bigger ones become depleted. In some areas with large human populations, my study revealed that only a few small predatory fish remain."
Interesting5: Powered by solar energy generated on its roof, Taipei 101, the world’s tallest completed building, is not only a leader for its breathtaking height but also for its eco-friendly features. Finished in 2004, the skyscraper is a rare example of green design in Asia, a region with the world’s busiest construction sector yet one of the poorest records for eco-friendly building.
China alone is said to be building half of the world’s new floor space, but the vast majority of these new projects will be energy guzzlers. Environmentalists worry that these buildings will produce high carbon emissions for decades to come. "Energy efficiency is fast becoming one of the defining issues of our times, and buildings are that issue’s ‘elephant in the room’," Bjorn Stigson, president of the World Business Council for Sustainable Development, said in a statement.
Posted by Glenn
No Comments
May 5-6, 2009
Air Temperatures – The following maximum temperatures were recorded across the state of Hawaii Tuesday afternoon:
Lihue, Kauai – 80
Honolulu, Oahu – 86
Kaneohe, Oahu – 80
Kahului, Maui – 86
Hilo, Hawaii – 83
Kailua-kona – 85
Air Temperatures ranged between these warmest and coolest spots near sea level – and on the highest mountains…at 4 p.m. Tuesday afternoon:
Honolulu, Oahu – 83F
Kapalua, Maui – 79
Haleakala Crater – 55 (near 10,000 feet on Maui)
Mauna Kea summit – 45 (near 14,000 feet on the Big Island)
Precipitation Totals – The following numbers represent the largest precipitation totals (inches) during the last 24 hours on each of the major islands, as of Tuesday afternoon:
0.03 Moloaa Dairy, Kauai
0.03 Waimanalo, Oahu
0.00 Molokai
0.00 Lanai
0.00 Kahoolawe
0.01 Ulupalakua, Maui
0.01 Kamuela Upper, Big Island
Weather Chart – Here’s the latest (automatically updated) weather map shows a 1026 millibar high pressure system located far to the ENE of the islands now. This high will remain weak, and with its associated ridge extending WSW, positioned between Kauai and Oahu, it will keep our winds generally light southeasterlies through Thursday…with daytime onshore sea breezes.
Satellite and Radar Images: To view the cloud conditions we have here in Hawaii, please use the following satellite links, starting off with the Infrared Satellite Image of the islands to see all the clouds around the state during the day and night. This next image is one that gives close images of the islands only during the daytime hours, and is referred to as a Close-up visible image. This next image shows a larger view of the Pacific…giving perspective to the wider ranging cloud patterns in the Pacific Ocean. Finally, here’s a looping IR satellite image, making viewable the clouds around the islands 24 hours a day. To help you keep track of where any showers may be around the islands, here’s the latest animated radar image.
Hawaii’s Mountains – Here’s a link to the live webcam on the summit of near 14,000 foot Mauna Kea on the Big Island of Hawaii. The tallest peak on the island of Maui is the Haleakala Crater, which is near 10,000 feet in elevation. These two webcams are available during the daylight hours here in the islands…and when there’s a big moon rising just after sunset for an hour or two! Plus, during the nights and early mornings you will be able to see stars, and the sunrise too…depending upon weather conditions.
Aloha Paragraphs
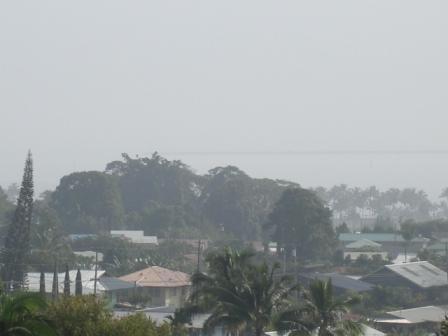
When volcanic haze gets into Hilo…on the Big Island
Light southeast breezes over the ocean, with daytime sea breezes, and offshore land breezes at night…through most of the rest of this week. The latest forecasts show the return of trade winds not until early next week. If this turns out to be true, our light winds, dry weather, and hazy conditions will persist through the rest of this week. Our high pressure ridge is just to the north of Kauai, as shown on this weather map. If it moves just a little further northward, we would see light trade winds picking up on the Big island and Maui.
The close proximity of the high pressure ridge will not only keep our winds light, but our overlying atmosphere rather dry. We will find clear to partly cloudy mornings, which will give way to cloudy afternoons locally. The air mass over our islands is dry and stable, which will continue to greatly limit any showers from falling. Whatever few showers that do manage to fall, will end up over and around the mountains…during the afternoon hours generally. This looping radar image demonstrates just how few showers are falling here in the central north Pacific.
The orientation of our local winds, at least over the offshore waters, is from the southeast, which carries volcanic haze from the Big Island…to the other islands. The source of this vog is the volcanic vents on the Big Island. This will keep our atmosphere hazy through much of the rest of this week. It will take the returning trade winds to ventilate this haze away. The daytime heating, coupled with the light winds, will generate lots of afternoon clouds…and a generally more sultry reality than we’re used to seeing during the spring month of Maui.
It’s early Tuesday evening as I begin writing this last section of today’s weather narrative. Looking out the window here in Kihei, Maui, before I take the drive upcountry to Kula, it looks about the same as it did Monday evening at the same time. The sea breeze is blowing, which looks similar to when the trade winds are active…except it’s hazy out there. ~~~ Actually, as it turned out, I found during my drive home, it was less hazy than I thought it was. It appears that the high pressure ridge may have gotten just far enougn north, that we are finding light trade winds blowing locally. These light trade winds seem to be clearing the air quite a bit now…the question becomes, will they continue? ~~~ Ok, that’s about it for this Maui weatherman, nothing more to say today, but I’ll be back with you again early Wednesday morning. I’ll be up early preparing the next new weather narrative, hope to meet you here then! Aloha for now…Glenn.
Interesting: The grey wolf was Monday taken off the U.S. list of endangered species, making a comeback 35 years after it virtually disappeared and can now be hunted in most states, officials said. "We have recovered a wolf population," said Ed Bangs, wolf recovery coordinator for the U.S. Fish and Wildlife service, based in Montana. "The populations are viable, they are in great shape, they have extreme genetic diversity and so the endangered species act did its job to bring wolves back."
The grey wolf was placed on the endangered list in 1974 after the animals were almost eliminated in many U.S. states. But thanks to conservation efforts its numbers now reach some 4,000 in the Great Lakes region, which includes Michigan, Minnesota and Wisconsin, and there are more than 1,300 in the Rocky Mountain states of Idaho and Montana. There are also between 8,000 and 11,000 grey wolves in Alaska.
Interesting2: Scientists who have just returned from an expedition to an erupting undersea volcano near the Island of Guam report that the volcano appears to be continuously active, has grown considerably in size during the past three years, and its activity supports a unique biological community thriving despite the eruptions. An international science team on the expedition captured dramatic new information about the eruptive activity of NW Rota-1. "This research allows us, for the first time, to study undersea volcanoes in detail and close up," said Barbara Ransom, program director in NSF’s Division of Ocean Sciences, which funded the research.
"NW Rota-1 remains the only place on Earth where a deep submarine volcano has ever been directly observed while erupting." Scientists first observed eruptions at NW Rota-1 in 2004 and again in 2006, said Bill Chadwick, an Oregon State University (OSU) volcanologist and chief investigator on the expedition. This time, however, they discovered that the volcano had built a new cone 40 meters high and 300 meters wide.
"That’s as tall as a 12-story building and as wide as a full city block," Chadwick said. "As the cone has grown, we’ve seen a significant increase in the population of animals that lives atop the volcano. We’re trying to determine if there is a direct connection between the increase in the volcanic activity and that population increase."
Animals in this unusual ecosystem include shrimp, crab, limpets and barnacles, some of which are new species. "They’re specially adapted to their environment," said Chadwick, "and are thriving in harsh chemical conditions that would be toxic to normal marine life.
Interesting3: California will pay more and companies pay less to clean up a polluted San Joaquin Valley site under a closely watched Supreme Court decision Monday. Capping an excruciatingly long legal battle, the court by an 8-1 margin limited the liability of two major railroads for chemical spills in the Kern County town of Arvin.
The court also absolved Shell of liability for the Arvin site, in a ruling could help restrict corporate liability in other future pollution cases as well. "It’s a hugely significant case," said Baker & Botts’ attorney Daniel Steinway, who wrote a legal brief on behalf of the National Association of Manufacturers and other business groups. "It will have enormous financial consequences for industry."
Interesting4: The EPA next week will convene an Agricultural Air Quality Task Force this week in the town that, according to a new study by the American Lung Association, is among the 10 most-polluted cities in the nation. The Task Force will look into ways that farm operations can minimize air pollution and toxic emissions — including how to use funding from a $10.9 million assistance package to help achieve those goals.
"This is a pivotal time for agriculture and air quality," says Ed Burton, State Conservationist of the USDA’s Natural Resources Conservation Service in California. "The focus on energy and climate is creating more challenges — and more opportunities — for agriculture than ever before. At this meeting we will address technical issues associated with agriculture and forestry."
Interesting5: Motorway-sized troughs and channels carved into Antarctica’s continental shelves by glaciers thousands of years ago could help scientists to predict future sea-level rise according to a report in the journal Geology this month (May). Using sonar technology from onboard ships, scientists from British Antarctic Survey (BAS) and the German Alfred Wegener Institute (AWI) captured the most extensive, continuous set of images of the seafloor around the Amundsen Sea embayment ever taken.
This region is a major drain point of the West Antarctic Ice Sheet (WAIS) and considered by some scientists to be the most likely site for the initiation of major ice sheet collapse. The sonar images reveal an ‘imprint’ of the Antarctic ice sheet as it was at the end of the last ice age around 10 thousand years ago. The extent of ice covering the continent was much larger than it is today.
The seabed troughs and channels that are now exposed provide new clues about the speed and flow of the ice sheet. They indicate that the controlling mechanisms that move ice towards the coast and into the sea are more complex than previously thought.
Interesting6: The European Parliament voted to ban European Union imports of seal products on Tuesday, a step Canada and Norway have said they will challenge in the world’s top trade court. "This is what the citizens of Europe want," Arlene McCarthy, the British socialist who chairs parliament’s internal market committee, told reporters.
The 15 seal species now hunted are not endangered but European politicians demanded action after finding what they said was evidence that many are skinned while still conscious. EU lawmakers dismissed a possible challenge as "blustering and threats" and said the ban could withstand any challenge at the World Trade Organization.
Interesting7: If the overall water resources in river basins were acknowledged and managed better, future food crises could be significantly reduced, say researchers from Stockholm Resilience Centre at Stockholm University, Stockholm Environment Institute and Potsdam Institute for Climate Impact Research. The challenge of meeting future water needs under the impacts of climate change and rapidly growing human demands for water may be less bleak than widely portrayed.
An analysis by a team of Swedish and German scientists quantifies for the first time the opportunities of effectively using both “green” and “blue” water to adapt to climate change and to feed the future world population. The study was recently published in the journal Water Resources Research. The current approach to water management considers only blue water that is river discharge and groundwater.
According to the researchers, this limits the options to deal with increasing water scarcity and water risks induced by climate change. Under those conditions, over three billion of the current world populations are estimated to suffer from severe water scarcity. The new analysis which additionally accounts for green water, that is water in the soil that stems directly from rainfall, suggests that the actual number is under one billion.
It also shows that wise water management can lift billions out of water poverty. “This opens a new area of investments for climate adaptation and a window to achieve a much needed new green revolution in poor countries in the world.
Our analysis shows that many water-short countries are able to produce enough food for their populations if green water is considered and managed well,” the researchers report. Their article, entitled “Future water availability for global food production: The potential of green water for increasing resilience to global change”, changes fundamentally the conventional bleak estimations for future water scarcity in the world.
Posted by Glenn
No Comments
May 4-5, 2009
Air Temperatures – The following maximum temperatures were recorded across the state of Hawaii Monday afternoon:
Lihue, Kauai – 79
Honolulu, Oahu – 84
Kaneohe, Oahu – 80
Kahului, Maui – 84
Hilo, Hawaii – 82
Kailua-kona – 84
Air Temperatures ranged between these warmest and coolest spots near sea level – and on the highest mountains…at 4 p.m. Monday afternoon:
Kapalua, Maui – 86F
Kaneohe, Oahu – 78
Haleakala Crater – 57 (near 10,000 feet on Maui)
Mauna Kea summit – 45 (near 14,000 feet on the Big Island)
Precipitation Totals – The following numbers represent the largest precipitation totals (inches) during the last 24 hours on each of the major islands, as of Monday afternoon:
0.03 Hanapepe, Kauai
0.03 Maunawili, Oahu
0.00 Molokai
0.00 Lanai
0.00 Kahoolawe
0.02 Oheo Gulch, Maui
0.22 Pahoa, Big Island
Weather Chart – Here’s the latest (automatically updated) weather map shows a 1022 millibar high pressure system located far to the ENE of the islands now. This high will remain weak, and with its associated ridge extending WSW over Kauai, it will keep our winds generally light southeasterlies through Wednesday…with daytime onshore blowing sea breezes.
Satellite and Radar Images: To view the cloud conditions we have here in Hawaii, please use the following satellite links, starting off with the Infrared Satellite Image of the islands to see all the clouds around the state during the day and night. This next image is one that gives close images of the islands only during the daytime hours, and is referred to as a Close-up visible image. This next image shows a larger view of the Pacific…giving perspective to the wider ranging cloud patterns in the Pacific Ocean. Finally, here’s a looping IR satellite image, making viewable the clouds around the islands 24 hours a day. To help you keep track of where any showers may be around the islands, here’s the latest animated radar image.
Hawaii’s Mountains – Here’s a link to the live webcam on the summit of near 14,000 foot Mauna Kea on the Big Island of Hawaii. The tallest peak on the island of Maui is the Haleakala Crater, which is near 10,000 feet in elevation. These two webcams are available during the daylight hours here in the islands…and when there’s a big moon rising just after sunset for an hour or two! Plus, during the nights and early mornings you will be able to see stars, and the sunrise too…depending upon weather conditions.
Aloha Paragraphs
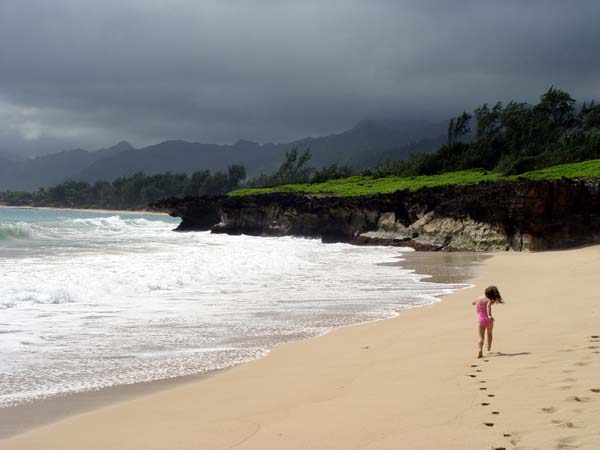
Totally having fun on the beach!
Light winds will continue, with daytime onshore sea breezes, and offshore land breezes at night, through Tuesday…followed by light trade winds Wednesday. The winds further offshore are light from the southeast direction, which is bringing hazy weather (volcanic in origin) to our islands, which will continue Tuesday. Light trade winds will begin again Wednesday and Thursday, lasting through the rest of the week…blowing the haze away then.
Clear mornings will give way to localized afternoon clouds, but they will generally be dry ones…other than a few very light showers over the mountains. We should begin to see a modest increase in showers starting around the middle of this week, especially along the windward sides during the night and early morning hours…as the trade winds return. There should be lots of sunshine along the beaches, especially during the morning hours.
As noted above, the light southeast breezes are carrying volcanic haze up over the smaller islands. The source of this vog is the volcanic vents on the Big Island. This will keep our atmosphere hazy through the next couple of days. It will take the returning trade winds around Wednesday, to ventilate this bad air quality away. The daytime heating, coupled with the light winds, will generate lots of afternoon clouds…mostly around the mountains.
It’s early Monday evening as I begin writing this last section of today’s weather narrative. The main headline weather news today, as it will continue to be on Tuesday…will be the hazy atmospherics here in the islands. Looking out the window here in Kihei, before I take the drive back home to Kula, I see extensive volcanic haze. The sea breezes are blowing, which is carrying moisture upcountry, where it looks mostly cloudy over the mountains. It may be hazy right into Wednesday, when the trade winds are scheduled to begin blowing again. These trade winds aren’t going to be very strong however, so it might be until Thursday before we’re back into our usual good visibilities. ~~~ I’ll be back again early Tuesday morning with your next new weather narrative from paradise, yes it is still paradise, even with our temporary hazy weather conditions! I hope you have a good Monday night wherever you happen to be spending it. Aloha for now…Glenn.
Interesting: A new explanation for the cause of changes in the chemical makeup of the oceans through recent Earth history is put forward in a paper published in Nature. Scientists from the Universities of Southampton and Bristol suggest that adjustments in ocean chemistry through recent geological time are driven by variations in the intensity of chemical breakdown of continental rocks by rain and ground water.
These changes are, in turn, controlled by the profound changes in the Earth’s climate, and in particular the Ice Ages, that have occurred over the past 2-3 million years. The elements that give seawater its distinctive saltiness are mostly supplied in dissolved form by rivers.
Rivers, in turn, receive these elements from runoff that has reacted with and partially dissolved rocks, a process known as chemical weathering. Another major source of dissolved material to seawater is submarine “black smoker” hydrothermal systems.
Movement of seawater through young, hot rocks at the mid-ocean ridges causes leaching of some elements from sea-floor basalts, as well as the precipitation out of solution of some constituents of seawater. Thus, these hydrothermal systems are both a source of dissolved material to the oceans and also a means by which some others are lost.
The other major output of dissolved material from the oceans is to marine sediments, which are principally made up of the shells of dead marine organisms. Imbalances in these inputs and outputs cause changes in the chemical make-up of the oceans through time.
Dr Vance explains, “Chemical weathering rates have been periodically perturbed in recent Earth history because the ice-sheets and glaciers produced during the great ice ages have physically ground rock up to smaller and smaller grain sizes. In the succeeding hotter and wetter ‘interglacial’ periods, this ground up rock is very susceptible to chemical weathering.”
All chemical reactions occur faster if the substrate is finer grained because there is more surface area for reaction to take place – this is why school chemical experiments use iron filings instead of a block of steel!
Interesting2: Fried, raw, baked or even distilled into beer or wine, bananas are a staple in the East African country of Rwanda, where approximately two million tons of the fruit are grown annually. Though much of the fruit is used, the majority of the skins leaves and stems are left behind as waste. Scientists at the University of Nottingham are developing ways to use the banana waste to produce fuel.
Using minimal tools and technology, PhD student Joel Chaney has developed a method of producing simple banana briquettes that can be burnt as fuel. "A big problem in the developing world is firewood," Chaney tells Science Daily. "Huge areas of land are deforested every year, which leads to the land being eroded. People need fuel to cook and stay warm but they can’t afford the more expensive types, like gas."
In additional to the resource depletion and erosion, collecting firewood can be a long process, with villagers spending hours traveling to and collecting forest wood for fuel. To turn the banana waste into burnable briquettes, the banana skins and leaves are first mashed to a pulp and then mixed with sawdust or sun dried banana stems to create a moldable material.
The pulp is compressed into a brick shape and baked in an oven, or sun dried for a few days if an oven is not available. Once dried, the bricks form an ideal fuel for cooking. Similar to biochar, the technology of using waste to create a fuel source is a growing trend that could represent a solution to environmental challenges worldwide.
Interesting3: Women may be more vulnerable than men to the cancer-causing effects of smoking tobacco, according to new results reported this week at the European Multidisciplinary Conference in Thoracic Oncology (EMCTO), Lugano, Switzerland. Swiss researchers studied 683 lung cancer patients who were referred to a cancer centre in St Gallen between 2000 and 2005 and found women tended to be younger when they developed the cancer, despite having smoked on average significantly less than men.
"Our findings suggest that women may have an increased susceptibility to tobacco carcinogens," report Dr Martin Frueh and colleagues. Dr Enriqueta Felip from Val d’Hebron University Hospital in Barcelona, Spain, conference co-chair, notes that the results support a growing awareness that smoking presents greater risks to women than men.
"In the early 1900s lung cancer was reported to be rare in women, but since the 1960s it has progressively reached epidemic proportions, becoming the leading cause of cancer deaths among women in the United States," Dr Felip said.
"Lung cancer is not only a man’s disease, but women tend to be much more aware of other cancers, such as breast cancer," she said. "Several case-control studies seem to suggest that women are more vulnerable to tobacco carcinogens than men."
Interesting4: When British consumers are compelled to buy energy-efficient light bulbs from 2012, they will save up to 5m tons of carbon dioxide a year from being pumped into the atmosphere. In China, however, a heavy environmental price is being paid for the production of “green” light bulbs in cost-cutting factories.
Large numbers of Chinese workers have been poisoned by mercury, which forms part of the compact fluorescent light bulbs. A surge in foreign demand, set off by a European Union directive making these bulbs compulsory within three years, has also led to the reopening of mercury mines that have ruined the environment.
Doctors, regulators, lawyers and courts in China – which supplies two thirds of the compact fluorescent bulbs sold in Britain – are increasingly alert to the potential impacts on public health of an industry that promotes itself as a friend of the earth but depends on highly toxic mercury.
Interesting5: As part of his environmental agenda, President Barack Obama announced in March he would order a review of a regulation approved late last year by the Bush administration that severely weakened the Endangered Species Act. The prior administration turned its back on animals and plants in December by giving federal agencies permission to ignore input from the U.S. Fish and wildlife Service and National Marine Fisheries Service when constructing dams, highways, parking lots and other projects.
The reasoning was that many federal agencies have their own scientists, but those individuals don’t necessarily specialize in wildlife and habitat issues. Thankfully, that wrong-headed regulation has now been reversed.
As announced last week by Interior Secretary Ken Salazar and Commerce Secretary Gary Locke, federal agencies will again have to adhere to the protection of endangered species the way they did before the Bush administration. That means consulting with federal fish and wildlife experts before shovels go into the ground.
Interesting6: The Southern Hemisphere has been mostly spared in the swine flu epidemic. That could change when winter starts in coming weeks with no vaccine in place, leaving half the planet out in the cold. So far, the most affected nations have been in North America and Europe, which are heading into summer. But flu is spread more easily in the winter, and it’s already fall down south.
Experts fear public health systems could be overwhelmed — especially if swine flu and regular flu collide in major urban populations. "You have this risk of an additional virus that could essentially cause two outbreaks at once," Dr. Jon Andrus said at the Pan American Health Organization’s headquarters in Washington. There’s also a chance that the two flus could collide and mutate into a new strain that is more contagious and dangerous.
"We have a concern there might be some sort of re-assortment and that’s something we’ll be paying special attention to," World Health Organization spokesman Dick Thompson said. Flu spreads more readily during the winter because people congregate indoors as the weather gets colder, increasing the opportunity for the virus to hop from person to person, said Raina MacIntyre, public health director at the University of New South Wales in Australia.
Colder temperatures also may make it easier for the virus to infect people. "The highest peaks of influenza activity occur in winter," MacIntyre said. "For us in the Southern Hemisphere, it’s particularly concerning." And while New Zealand is the only southern nation with confirmed swine flu cases, "it’s almost inevitable that it will come to Australia," she said.
Health officials in Brazil also say it’s a near-certainty swine flu will hit Latin America’s largest nation, where there are 25 suspected cases but none confirmed so far. Humans have only limited natural immunity to this new blend of bird, pig and human viruses, but the strain has killed relatively few people in its current form compared to traditional flu, which kills about 36,000 people each year in the U.S. and more than 250,000 worldwide.
Posted by Glenn
No Comments
May 3-4, 2009
Air Temperatures – The following maximum temperatures were recorded across the state of Hawaii Sunday afternoon:
Lihue, Kauai – 81
Honolulu, Oahu – 82
Kaneohe, Oahu – 81
Kahului, Maui – 86
Hilo, Hawaii – 82
Kailua-kona – 83
Air Temperatures ranged between these warmest and coolest spots near sea level – and on the highest mountains…at 5 p.m. Sunday evening:
Kahului, Maui – 82F
Lihue, Kauai – 75
Haleakala Crater – 55 (near 10,000 feet on Maui)
Mauna Kea summit – 46 (near 14,000 feet on the Big Island)
Precipitation Totals – The following numbers represent the largest precipitation totals (inches) during the last 24 hours on each of the major islands, as of Sunday afternoon:
0.02 Hanapepe, Kauai
0.04 Maunawili, Oahu
0.00 Molokai
0.00 Lanai
0.00 Kahoolawe
0.06 West Wailuaiki, Maui
0.09 Pahoa, Big Island
Weather Chart – Here’s the latest (automatically updated) weather map shows a 1024 millibar high pressure system located a good distance to the ENE of the islands now. This high will remain weak and far enough away from us, so that our winds will be generally light southeasterlies through Tuesday.
Satellite and Radar Images: To view the cloud conditions we have here in Hawaii, please use the following satellite links, starting off with the Infrared Satellite Image of the islands to see all the clouds around the state during the day and night. This next image is one that gives close images of the islands only during the daytime hours, and is referred to as a Close-up visible image. This next image shows a larger view of the Pacific…giving perspective to the wider ranging cloud patterns in the Pacific Ocean. Finally, here’s a looping IR satellite image, making viewable the clouds around the islands 24 hours a day. To help you keep track of where any showers may be around the islands, here’s the latest animated radar image.
Hawaii’s Mountains – Here’s a link to the live webcam on the summit of near 14,000 foot Mauna Kea on the Big Island of Hawaii. The tallest peak on the island of Maui is the Haleakala Crater, which is near 10,000 feet in elevation. These two webcams are available during the daylight hours here in the islands…and when there’s a big moon rising just after sunset for an hour or two! Plus, during the nights and early mornings you will be able to see stars, and the sunrise too…depending upon weather conditions.
Aloha Paragraphs

Voggy sunset Sunday…lots of haze
The light southeast breeze have enveloped all the islands now, with onshore sea breezes during the day…and offshore flowing land breezes at night. These southeast breezes are bringing hazy weather (volcanic in origin) to our islands, which will continue Monday and Tuesday. Light trade winds will begin again Wednesday and Thursday, lasting through the rest of the week…blowing the haze away slowly.
The atmosphere remains dry and stable, which will continue limiting showers greatly. There will be a few showers falling locally, most generously over the interior sections during the afternoon hours. We may begin to see a modest increase in showers around the middle of the new week, especially along the windward sides during the night and early morning hours…as the trade winds return then.
It’s Sunday evening as I begin writing this last section of today’s weather narrative. The main feature in our Hawaiian Island weather story is now the rather thick volcanic haze, along with light winds. The air mass remains quite dry too, so that we’re mostly dry as well. This reality will continue through the middle of the week, at which point light trade winds will return. It may take a day or even two before we see good clearing of our atmosphere.
~~~ I went over to Haiku, on the windward side early this morning, and bought some beautiful orchids. I then drove down to Baldwin Beach, and had a great walk on that long sandy shore, dipping into the ocean for a swim at the end. I then went into Paia for a few things, before getting back upcountry to Kula…where I spent the rest of the day.
~~~
I have done lots of domestic chores, which was quite a chore, but feels good to have done it now at the end of the day. It’s hazy and cloudy up here, and I see that a few light drops have fallen out of the sky, but hardly anything compared to the last several afternoons.
~~~
I’m sitting here sipping on a Mirror Pond Pale Ale as I type out these last words. I’m just about ready to head down the stairs, from this weather tower, for an early dinner. I hope you have a great Sunday night, and might return on Monday for the next new weather narrative. Aloha for now…Glenn.
Interesting: Invasive species are putting major strains on our environment, our pocketbooks and our health, new studies suggest, and our nation’s demand for exotic pets may be to blame. The wild animal trade may even be upping our risk for diseases like the current outbreak of swine flu.
Between 2000 and 2006, the United States imported nearly 1.5 billion live animals from 190 countries, mostly for sale as pets, according to a paper published today in the journal Science. Eighty percent of those animals came from wild populations.
Nearly 70 percent of them came from Southeast Asia, a known hotspot for emerging diseases that, like the swine flu, can jump from animals to people. Once invasive species have escaped into the environment, they can cause a cascade of problems that are expensive to fix.
In another paper, published last week in Frontiers in Ecology and the Environment, European researchers found that controlling an invasive species, can cost $10 million or more. "That’s what hits home," said Katherine Smith, a conservation biologist at Brown University in Providence, Rhode Island – "money and disease."
Interesting2: The American Lung Association’s State of the Air 2009 report acknowledges substantial progress against air pollution in many areas of the country, but finds nearly every major city still with some problem pollutants. Sixteen cities making this year’s 25 most ozone-polluted list experienced worsened ozone (smog) problems than last year’s report found.
Fifty-eight percent of people in the United States live in counties with recorded unhealthy levels of ozone air pollution, measured against the tighter standard in effect since March 2008. This year, 12 more California counties received failing grades than last year, reflecting the tighter national ozone standard implemented in 2008.
The Los Angeles-Long Beach-Riverside metro area demonstrates a continued and notable improvement trend for annual particle pollution levels (dropping to number three on that most-polluted list nationwide), based on State of the Air report grades during the past decade, although particle pollution levels remain unhealthy.
Ozone is the most widespread form of air pollution. Ozone is a powerful gas formed most often when sunlight reacts with vapors when vehicles, factories, power plants and other sources burn fuel. Ozone pollution immediately irritates the lungs when inhaled, resulting in something like a bad sunburn.
The American Lung Association’s State of the Air 2009 report finds that 6 out of 10 Americans –186.1 million people — live in areas where air pollution levels endanger lives.
State of the Air 2009 acknowledges substantial progress against air pollution in many areas of the country, but finds nearly every major city still burdened by air pollution. Despite America’s growing “green” movement, the air in many cities became dirtier since the last report.
Interesting3: A French study of the 1918-1919 influenza pandemic, which analyzed mortality rates in approximately three-quarters of the European population, has concluded that it is unlikely that the virus, often described as Spanish Flu, originated in Europe. Published in the May issue of Influenza and Other Respiratory Viruses, the research shows a high degree of synchronicity in the 14 countries studied, including Spain, with the flu peaking in October to November 1918.
The study, carried out by a team from INSERM, the French National Institute for Health and Medical Research, provides invaluable background briefing for clinicians and media during the current pandemic alert.
Key facts
• Overall deaths increased by 86 per cent in the 14 European countries studied during the 1918-1919 pandemic, with 1.98 million excess deaths recorded. When these figures were extrapolated to cover the 25 per cent of Europe not covered by the study, the figure reached 2.64 million.
• Excess mortality rates for the individual countries covered by the INSERM analysis were: Bulgaria (102%), England and Wales (55%), Finland (33%), Sweden (74%), France (66%), Germany (73%), Italy (172%), Norway (65%), Denmark (58%), Portugal (102%), Scotland (57%), Spain (87%), Switzerland (69%) and The Netherlands (84%).
• Figures for the worldwide death toll remain very imprecise. A first American report in 1927 suggested that the main 1918-1919 wave was responsible for 21 million deaths worldwide. A revised estimate in 1991 put the figure between 24.7 and 39.3 million and another in 2002 set the death toll at up to 100 million to take into account the lack of data in a large part of the world.
• The authors point out that the source of the 1918 pandemic remains unclear. A recent analysis of the 1918 H1N1 genome failed to single out a particular location. Theories put forward by various researchers include Asia, a British army post in France in 1916, the USA and Spain.
• The first reported pandemic was in 412 BC and the first attributed to influenza was in 1580. Since then 31 influenza pandemics have been reported, with the five most recent being in 1889, 1900, 1918, 1957 and 1968. The 1918 pandemic was the most deadly in modern history.
Other useful background information in the paper includes the start and finish dates of the pandemic outbreaks in the 14 countries studied, with graphs showing the peaks in each country.
Influenza and Other Respiratory Viruses is the first journal to specialize exclusively on influenza and other respiratory viruses and is edited by one of the world’s leading flu experts, Dr Alan Hampson.
It is the official journal of the International Society for Influenza and Other Respiratory Virus Diseases, an independent scientific professional society promoting the prevention, detection, treatment, and control of influenza and other respiratory virus diseases.
Interesting4: In 1918 a human influenza virus known as the Spanish flu spread through the central United States while a swine respiratory disease occurred concurrently. A Kansas State University researcher has found that the virus causing the pandemic was able to infect and replicate in pigs, but did not kill them, unlike in other mammalian hosts like monkeys, mice and ferrets where the infection has been lethal.
Juergen A. Richt, Regents Distinguished Professor of Diagnostic Medicine and Pathobiology at K-State’s College of Veterinary Medicine, studied the 1918 Spanish flu pandemic with colleagues from the Canadian Food Inspection Agency, U.S. Department of Agriculture and Mount Sinai School of Medicine.
Their research supports the hypothesis that the 1918 pandemic influenza virus and the virus causing the swine flu were the same. Richt said the virus was able to infect and replicate in swine and cause mild respiratory disease. The 1918 virus spread through the pig population, adapted to the swine and resulted in the current lineage of the H1N1 swine influenza viruses.
The researchers’ study is published in the May 2009 Journal of Virology. "This study emphasizes that an influenza virus, which is known to induce a lethal infection in ferrets and macaques, is not highly virulent in pigs, indicating a potential resistance of swine to highly virulent influenza viruses," Richt said.
"It also suggests that pigs could have played a role in maintaining and spreading the 1918 human pandemic influenza virus." Swine flu is a respiratory disease of pigs caused by type A influenza that regularly causes outbreaks of influenza among the animals and can be transmitted to humans.
It is a typical zoonotic agent. While swine flu was first recognized as a disease in 1918, there also were reports of the influenza occurring in the Midwest in 1930. For the study, the researchers used the 1918 pandemic virus and a 1930 H1N1 influenza virus for experimental infections in swine.
The 1930 virus was chosen as a virus because it is thought to be a descendent of the 1918 virus, Richt said. The researchers did not find a significant difference in effects from the 1918 and 1930 viruses in infected pigs. This was surprising, since the 1918 virus killed more than 20 million people and was lethal to ferrets, mice and macaques.
Another surprising finding from the study was the rapid antibody response in the animals infected with the 1918 virus, which is not typically reported for the swine influenza virus. Richt said he plans to conduct a follow-up project that will study what makes a swine flu virus a pandemic flu virus.
Interesting5: What do you do when you have a fossil quarry that has yielded some of the most important and rarest of dinosaur fossils in North America, but the fossil-bearing layer of rock is tilted at 70 degrees and there is so much rock that not even jackhammers can get you to the fossils any longer? That was the problem facing Dinosaur National Monument at a Lower Cretaceous dinosaur quarry — the one that has produced the only complete brontosaur skulls from the last 80 million years of the Age of Dinosaurs in North America.
The site is so scientifically important that excavations cannot be stopped, yet there was no way to reach the bones. Dave Larsen, Steve Bors, and Tim George, a blasting team from Rocky Mountain National Park, rode to the rescue in mid-April.
Over several days these skilled employees, using their expertise with explosives, blew away the rock covering the fossils and exposed a significant amount of the fossil-bearing layer so that excavation can begin again this year. Without their talents, scientifically important fossils would have remained locked underground in their stony mausoleum.
Fossil excavation often uses small tools, either pneumatic or manual, to carefully remove rock from delicate fossils. However, in some instances, instruments that are more powerful are needed. Although explosives might seem extreme, in the right setting and in the right hands, they are the right tool for the job — staff at Dinosaur National Monument can certainly testify to that.
Interesting6: Dolphins have a clever trick that doesn’t involve jumping in the air for fish: They can overcome sleep deprivation and remain constantly vigilant for days at a time by resting one half of their brain while the other half remains conscious. Because they need to periodically come up for air and keep an eye out for potential predators, dolphins can’t curl up and zonk out at night like land mammals can. So they must stay somewhat conscious and sleep with the proverbial one eye open.
Sam Ridgway of the U.S. Navy Marine Mammal Program wondered if this constant watchfulness would dull their senses, like sleep deprivation does in humans (as anyone who has pulled an all-nighter knows). To investigate the effects of this mode of sleep on the dolphins, Ridgway and his colleagues trained two dolphins to respond to a 1.5-second beep sounded randomly against a background of 0.5-second beeps. (The sounds were low enough that they didn’t bother the dolphins in their daytime swims around their tank, but the random tone would still catch the dolphins’ attention.)
Even after listening to the tone for five straight days, the dolphins continued to respond to the beep just as sharply as they had at the beginning. Next, two of the researchers, Allen Goldblatt and Don Carder, designed a visual stimulus test to see if the dolphins were just as vigilant with their eyes. They also continued to see if the dolphins responded to the beeps.
Dolphins have binocular vision (with their eyes sitting on opposite sides of their head), so the researchers trained one of the dolphins (named Say) to recognized two shapes, either three horizontal red bars or one vertical green bar. They trained Say with her right eye first. The scientists thought that because half of the dolphin’s brain would be asleep during testing, Say would only recognize the shapes with the eye connected to the conscious half of her brain.
But she gave them a surprise: She trained her left eye on the shapes, even though that eye had not seen the shapes before. Ridgway said this must mean that information is transferred between the two hemispheres of the brain. The dolphins proved just as sharp with their eyes as they were with their ears: After 120 hours, they still saw the shapes. Researchers checked the dolphins’ blood for physical signs of sleep deprivation, but couldn’t find any. The results of the research are detailed in the May 1 issue of the Journal of Experimental Biology.
Posted by Glenn
No Comments
May 2-3, 2009
Air Temperatures – The following maximum temperatures were recorded across the state of Hawaii Saturday afternoon:
Lihue, Kauai – 78
Honolulu, Oahu – 84
Kaneohe, Oahu – 79
Kahului, Maui – 81
Hilo, Hawaii – 82
Kailua-kona – 83
Air Temperatures ranged between these warmest and coolest spots near sea level – and on the highest mountains…at 5 p.m. Saturday evening:
Kapalua, Maui – 82F
Lihue, Kauai – 75
Haleakala Crater – 54 (near 10,000 feet on Maui)
Mauna Kea summit – 41 (near 14,000 feet on the Big Island)
Precipitation Totals – The following numbers represent the largest precipitation totals (inches) during the last 24 hours on each of the major islands, as of Saturday afternoon:
0.01 Kapahi, Kauai
0.02 Waimanalo, Oahu
0.01 Molokai
0.00 Lanai
0.00 Kahoolawe
0.29 West Wailuaiki, Maui
0.15 Honokaa, Big Island
Weather Chart – Here’s the latest (automatically updated) weather map shows high pressure systems located just to the NNW, and far to the ENE of the islands now. Both of these high’s are weak, so that our winds will be generally light through Monday.
Satellite and Radar Images: To view the cloud conditions we have here in Hawaii, please use the following satellite links, starting off with the Infrared Satellite Image of the islands to see all the clouds around the state during the day and night. This next image is one that gives close images of the islands only during the daytime hours, and is referred to as a Close-up visible image. This next image shows a larger view of the Pacific…giving perspective to the wider ranging cloud patterns in the Pacific Ocean. Finally, here’s a looping IR satellite image, making viewable the clouds around the islands 24 hours a day. To help you keep track of where any showers may be around the islands, here’s the latest animated radar image.
Hawaii’s Mountains – Here’s a link to the live webcam on the summit of near 14,000 foot Mauna Kea on the Big Island of Hawaii. The tallest peak on the island of Maui is the Haleakala Crater, which is near 10,000 feet in elevation. These two webcams are available during the daylight hours here in the islands…and when there’s a big moon rising just after sunset for an hour or two! Plus, during the nights and early mornings you will be able to see stars, and the sunrise too…depending upon weather conditions.
Aloha Paragraphs

Baldwin Beach…Maui
Our local winds were light trades Saturday…with light southeast breezes taking over on Sunday. The trade winds brought a pleasant start to our weekend, with the southeast breezes bringing a period of hazy weather (volcanic in origin) Sunday into Monday. We should see a short return of the trade winds by Tuesday, with another interruption on Wednesday. The trade winds will begin again in earnest around Thursday, lasting through the rest of next week…at least.
This give and take between the trade winds, and those southeasterly breezes, will be accompanied by just a few showers. The main thing perhaps, will be warmer weather that arrives, bringing our air temperatures back to near normal. There will be a few showers falling, but the overlying atmosphere remains dry and stable…limiting showers in all areas. We may begin to see a modest increase in showers around the middle of the new week, especially along the windward sides during the night and early morning hours.
It’s Saturday evening as I begin writing this last section of today’s weather narrative. Saturday started off really nice, with clouds forming during the afternoon hours. Here in Kula, Maui at around 530pm, it’s foggy, after having light off and on showers for a while during the afternoon. ~~~ I went down to Paia for a haircut this morning, after which I headed down to Baldwin Beach for a long walk and a swim. I ran into a friend there, and we ended up sitting around talking, so that I got slightly more sunshine than I had planned on. Then I went back into Paia for some food shopping, and then came back upcountry afterwards. ~~~ I enjoy the fog, so will be going out on my weather deck to enjoy its coolness soon. I may have a Saturday evening drink out there, which will be fun. I’m out there now, a little later, as the sun has broken out. Neil Young just came out on the local fm radio station…Manaoradio.com I’m heading over to Haiku fairly early in the morning Sunday, as there’s an Orchid sale going on, and I may stop by Baldwin Beach for another walk and swim while I’m on that side. I’ll be back here before I leave though, to bring you the latest weather information here. I hope you have a great Saturday night until then! Aloha for now…Glenn.
Interesting: Invasive species are putting major strains on our environment, our pocketbooks and our health, new studies suggest, and our nation’s demand for exotic pets may be to blame. The wild animal trade may even be upping our risk for diseases like the current outbreak of swine flu.
Between 2000 and 2006, the United States imported nearly 1.5 billion live animals from 190 countries, mostly for sale as pets, according to a paper published today in the journal Science. Eighty percent of those animals came from wild populations.
Nearly 70 percent of them came from Southeast Asia, a known hotspot for emerging diseases that, like the swine flu, can jump from animals to people. Once invasive species have escaped into the environment, they can cause a cascade of problems that are expensive to fix.
In another paper, published last week in Frontiers in Ecology and the Environment, European researchers found that controlling an invasive species, can cost $10 million or more. "That’s what hits home," said Katherine Smith, a conservation biologist at Brown University in Providence, Rhode Island – "money and disease."
Interesting2: The American Lung Association’s State of the Air 2009 report acknowledges substantial progress against air pollution in many areas of the country, but finds nearly every major city still with some problem pollutants. Sixteen cities making this year’s 25 most ozone-polluted list experienced worsened ozone (smog) problems than last year’s report found.
Fifty-eight percent of people in the United States live in counties with recorded unhealthy levels of ozone air pollution, measured against the tighter standard in effect since March 2008. This year, 12 more California counties received failing grades than last year, reflecting the tighter national ozone standard implemented in 2008.
The Los Angeles-Long Beach-Riverside metro area demonstrates a continued and notable improvement trend for annual particle pollution levels (dropping to number three on that most-polluted list nationwide), based on State of the Air report grades during the past decade, although particle pollution levels remain unhealthy.
Ozone is the most widespread form of air pollution. Ozone is a powerful gas formed most often when sunlight reacts with vapors when vehicles, factories, power plants and other sources burn fuel. Ozone pollution immediately irritates the lungs when inhaled, resulting in something like a bad sunburn.
The American Lung Association’s State of the Air 2009 report finds that 6 out of 10 Americans –186.1 million people — live in areas where air pollution levels endanger lives.
State of the Air 2009 acknowledges substantial progress against air pollution in many areas of the country, but finds nearly every major city still burdened by air pollution. Despite America’s growing “green” movement, the air in many cities became dirtier since the last report.
Interesting3: A French study of the 1918-1919 influenza pandemic, which analyzed mortality rates in approximately three-quarters of the European population, has concluded that it is unlikely that the virus, often described as Spanish Flu, originated in Europe. Published in the May issue of Influenza and Other Respiratory Viruses, the research shows a high degree of synchronicity in the 14 countries studied, including Spain, with the flu peaking in October to November 1918.
The study, carried out by a team from INSERM, the French National Institute for Health and Medical Research, provides invaluable background briefing for clinicians and media during the current pandemic alert.
Key facts
• Overall deaths increased by 86 per cent in the 14 European countries studied during the 1918-1919 pandemic, with 1.98 million excess deaths recorded. When these figures were extrapolated to cover the 25 per cent of Europe not covered by the study, the figure reached 2.64 million.
• Excess mortality rates for the individual countries covered by the INSERM analysis were: Bulgaria (102%), England and Wales (55%), Finland (33%), Sweden (74%), France (66%), Germany (73%), Italy (172%), Norway (65%), Denmark (58%), Portugal (102%), Scotland (57%), Spain (87%), Switzerland (69%) and The Netherlands (84%).
• Figures for the worldwide death toll remain very imprecise. A first American report in 1927 suggested that the main 1918-1919 wave was responsible for 21 million deaths worldwide. A revised estimate in 1991 put the figure between 24.7 and 39.3 million and another in 2002 set the death toll at up to 100 million to take into account the lack of data in a large part of the world.
• The authors point out that the source of the 1918 pandemic remains unclear. A recent analysis of the 1918 H1N1 genome failed to single out a particular location. Theories put forward by various researchers include Asia, a British army post in France in 1916, the USA and Spain.
• The first reported pandemic was in 412 BC and the first attributed to influenza was in 1580. Since then 31 influenza pandemics have been reported, with the five most recent being in 1889, 1900, 1918, 1957 and 1968. The 1918 pandemic was the most deadly in modern history.
Other useful background information in the paper includes the start and finish dates of the pandemic outbreaks in the 14 countries studied, with graphs showing the peaks in each country.
Influenza and Other Respiratory Viruses is the first journal to specialize exclusively on influenza and other respiratory viruses and is edited by one of the world’s leading flu experts, Dr Alan Hampson.
It is the official journal of the International Society for Influenza and Other Respiratory Virus Diseases, an independent scientific professional society promoting the prevention, detection, treatment, and control of influenza and other respiratory virus diseases.
Interesting4: In 1918 a human influenza virus known as the Spanish flu spread through the central United States while a swine respiratory disease occurred concurrently. A Kansas State University researcher has found that the virus causing the pandemic was able to infect and replicate in pigs, but did not kill them, unlike in other mammalian hosts like monkeys, mice and ferrets where the infection has been lethal.
Juergen A. Richt, Regents Distinguished Professor of Diagnostic Medicine and Pathobiology at K-State’s College of Veterinary Medicine, studied the 1918 Spanish flu pandemic with colleagues from the Canadian Food Inspection Agency, U.S. Department of Agriculture and Mount Sinai School of Medicine.
Their research supports the hypothesis that the 1918 pandemic influenza virus and the virus causing the swine flu were the same. Richt said the virus was able to infect and replicate in swine and cause mild respiratory disease. The 1918 virus spread through the pig population, adapted to the swine and resulted in the current lineage of the H1N1 swine influenza viruses.
The researchers’ study is published in the May 2009 Journal of Virology. "This study emphasizes that an influenza virus, which is known to induce a lethal infection in ferrets and macaques, is not highly virulent in pigs, indicating a potential resistance of swine to highly virulent influenza viruses," Richt said.
"It also suggests that pigs could have played a role in maintaining and spreading the 1918 human pandemic influenza virus." Swine flu is a respiratory disease of pigs caused by type A influenza that regularly causes outbreaks of influenza among the animals and can be transmitted to humans.
It is a typical zoonotic agent. While swine flu was first recognized as a disease in 1918, there also were reports of the influenza occurring in the Midwest in 1930. For the study, the researchers used the 1918 pandemic virus and a 1930 H1N1 influenza virus for experimental infections in swine.
The 1930 virus was chosen as a virus because it is thought to be a descendent of the 1918 virus, Richt said. The researchers did not find a significant difference in effects from the 1918 and 1930 viruses in infected pigs. This was surprising, since the 1918 virus killed more than 20 million people and was lethal to ferrets, mice and macaques.
Another surprising finding from the study was the rapid antibody response in the animals infected with the 1918 virus, which is not typically reported for the swine influenza virus. Richt said he plans to conduct a follow-up project that will study what makes a swine flu virus a pandemic flu virus.
Interesting5: What do you do when you have a fossil quarry that has yielded some of the most important and rarest of dinosaur fossils in North America, but the fossil-bearing layer of rock is tilted at 70 degrees and there is so much rock that not even jackhammers can get you to the fossils any longer? That was the problem facing Dinosaur National Monument at a Lower Cretaceous dinosaur quarry — the one that has produced the only complete brontosaur skulls from the last 80 million years of the Age of Dinosaurs in North America.
The site is so scientifically important that excavations cannot be stopped, yet there was no way to reach the bones. Dave Larsen, Steve Bors, and Tim George, a blasting team from Rocky Mountain National Park, rode to the rescue in mid-April.
Over several days these skilled employees, using their expertise with explosives, blew away the rock covering the fossils and exposed a significant amount of the fossil-bearing layer so that excavation can begin again this year. Without their talents, scientifically important fossils would have remained locked underground in their stony mausoleum.
Fossil excavation often uses small tools, either pneumatic or manual, to carefully remove rock from delicate fossils. However, in some instances, instruments that are more powerful are needed. Although explosives might seem extreme, in the right setting and in the right hands, they are the right tool for the job — staff at Dinosaur National Monument can certainly testify to that.
Interesting6: Dolphins have a clever trick that doesn’t involve jumping in the air for fish: They can overcome sleep deprivation and remain constantly vigilant for days at a time by resting one half of their brain while the other half remains conscious. Because they need to periodically come up for air and keep an eye out for potential predators, dolphins can’t curl up and zonk out at night like land mammals can. So they must stay somewhat conscious and sleep with the proverbial one eye open.
Sam Ridgway of the U.S. Navy Marine Mammal Program wondered if this constant watchfulness would dull their senses, like sleep deprivation does in humans (as anyone who has pulled an all-nighter knows). To investigate the effects of this mode of sleep on the dolphins, Ridgway and his colleagues trained two dolphins to respond to a 1.5-second beep sounded randomly against a background of 0.5-second beeps. (The sounds were low enough that they didn’t bother the dolphins in their daytime swims around their tank, but the random tone would still catch the dolphins’ attention.)
Even after listening to the tone for five straight days, the dolphins continued to respond to the beep just as sharply as they had at the beginning. Next, two of the researchers, Allen Goldblatt and Don Carder, designed a visual stimulus test to see if the dolphins were just as vigilant with their eyes. They also continued to see if the dolphins responded to the beeps.
Dolphins have binocular vision (with their eyes sitting on opposite sides of their head), so the researchers trained one of the dolphins (named Say) to recognized two shapes, either three horizontal red bars or one vertical green bar. They trained Say with her right eye first. The scientists thought that because half of the dolphin’s brain would be asleep during testing, Say would only recognize the shapes with the eye connected to the conscious half of her brain.
But she gave them a surprise: She trained her left eye on the shapes, even though that eye had not seen the shapes before. Ridgway said this must mean that information is transferred between the two hemispheres of the brain. The dolphins proved just as sharp with their eyes as they were with their ears: After 120 hours, they still saw the shapes. Researchers checked the dolphins’ blood for physical signs of sleep deprivation, but couldn’t find any. The results of the research are detailed in the May 1 issue of the Journal of Experimental Biology.
« Previous Page — Next Page »


