


May 27-28, 2009
Air Temperatures – The following maximum temperatures were recorded across the state of Hawaii Wednesday afternoon:
Lihue, Kauai – 82
Honolulu, Oahu – 86
Kaneohe, Oahu – 84
Kahului, Maui – 85
Hilo, Hawaii – 84
Kailua-kona – 85
Air Temperatures ranged between these warmest and coolest spots near sea level – and on the highest mountains…at 4 p.m. Wednesday afternoon:
Honolulu, Oahu – 85F
Lihue, Kauai – 78
Haleakala Crater – 52 (near 10,000 feet on Maui)
Mauna Kea summit – 41 (near 14,000 feet on the Big Island)
Precipitation Totals – The following numbers represent the largest precipitation totals (inches) during the last 24 hours on each of the major islands, as of Wednesday afternoon:
3.56 Anahola, Kauai
0.76 Kalaeloa airport, Oahu
0.50 Molokai
0.02 Lanai
0.31 Kahoolawe
0.43 Waikapu Country Club, Maui
0.19 Keahole airport, Big Island
Marine Winds – Here’s the latest (automatically updated) weather map shows a weak 1006 millibar low pressure system to the north-northeast of Hawaii, with its associated front and trough extending southwest through the Kauai channel between Kauai and Oahu. This pressure configuration will keep light breezes in place, generally from the southeast to southwest…with localized sea breezes through Friday.
Satellite and Radar Images: To view the cloud conditions we have here in Hawaii, please use the following satellite links, starting off with the Infrared Satellite Image of the islands to see all the clouds around the state during the day and night. This next image is one that gives close images of the islands only during the daytime hours, and is referred to as a Close-up visible image. This next image shows a larger view of the Pacific…giving perspective to the wider ranging cloud patterns in the Pacific Ocean. Finally, here’s a looping IR satellite image, making viewable the clouds around the islands 24 hours a day. To help you keep track of where any showers may be around the islands, here’s the latest animated radar image.
Hawaii’s Mountains – Here’s a link to the live webcam on the summit of near 14,000 foot Mauna Kea on the Big Island of Hawaii. The tallest peak on the island of Maui is the Haleakala Crater, which is near 10,000 feet in elevation. These two webcams are available during the daylight hours here in the islands…and when there’s a big moon rising just after sunset for an hour or two! Plus, during the nights and early mornings you will be able to see stars, and the sunrise too…depending upon weather conditions.
Aloha Paragraphs
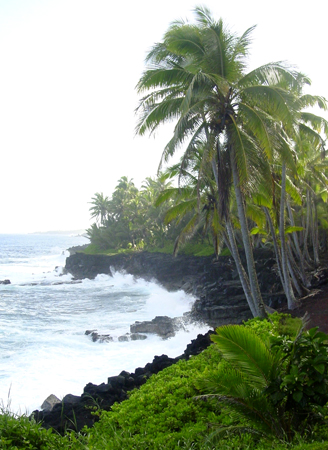
Palm lined lava coast…Big Island
A muggy and humid weather will remain in place over the islands through most of the rest of this week…if not all of the week. Looking at this weather map we see a weak low pressure system, with its trailing trough of low pressure, dangling down into our island chain Wednesday evening. This strongly suggests that our trade winds, which are often blowing this time of year, will hold off until late this weekend…or even wait to arrive until early next week. As noted above, this leaves us in a stagnant air mass, with uncomfortably sultry conditions prevailing during the heat of the day.
The presence of a low to our north-northeast, and its associated trough extending southward into the Aloha state…will keep our atmosphere locally shower prone. These low pressure areas in the vicinity of the islands will keep the threat of showers in the forecast…some of which will be locally heavy. Kauai received the largest precipitation total during the last 24 hours, which was 3.56" at the Anahola rain gauge. We saw another round of generous showers falling from Kauai to Maui County Wednesday afternoon. Here’s a looping radar image, so you can keep track of where those showers are falling. This long lasting convective pattern will persist, that is until the trade winds manage to work their way back into our island weather picture.
The weather here in the islands the last several days has been very warm and excessively humid…at least in many sea level locations. One of the reasons why, is that we’ve had very unusual Kona winds blowing up from the south, bringing tropical moisture into our area. As the winds have been so light, there’s been no relief from these ultra-tropical conditions. This reality will continue until the trade winds return, which won’t likely happen for another 4-5 days. The fact that the trade winds are on hold through then, which grades into the beginning of June…is uncommon to say the least!
This Friday afternoon between 3-5pm, the Pacific Disaster Center in Kihei, Maui, is hosting a NWS hurricane workshop. You would need to call the PDC at 891-0525 in order to reserve a seat, which are limited to around 87 people. There’s been many calls already, as this will be a golden opportunity to ask all the questions you have about hurricanes…directed to experts in the field. The meteorologist in charge of the National Weather Service office in Honolulu, along with one of his top guns, will be there to field your best inquires. I’ll be there too, and would enjoy meeting you during this workshop. The purpose of this meeting is to describe what’s expected in terms of hurricanes this season…which starts June 1st in the central Pacific.
It’s Wednesday evening here in Kihei, Maui, as I begin writing this last section of today’s narrative. Today was another one of those very muggy days, with our skies filled with not only lots of clouds, some of which were generously showery…but also localized rather thick volcanic haze. Looking out the window here before I leave for home in Kula, it’s very cloudy, and those cumulus clouds look rather wet, although it’s dry here on the south coast, at least in my view. I have a feeling that it will be foggy, and at least somewhat wet upcountry, which I’ll find out as I get out on the road, and have a better look around. Let’s take a look at this satellite image, so we can see where all these clouds are located as we head into Wednesday night. ~~~ I’ll be back again early Thursday morning with your next new weather narrative. I hope you have a great Wednesday night until then, either here in the islands, or somewhere else! Aloha for now…Glenn.
Interesting: A new map shows where desert tortoises could relocate, if displaced by climate change or human development. While the project didn’t turn up many surprises, it is the first real numbers-based tortoise map that is designed to adapt to changing environmental conditions. For now, the map mostly outlines where good tortoise habitats are today. Future modifications, researchers hope, will help them protect the threatened species.
"We can say, ‘OK, what do we think the 100-year climate prediction is going to look like?’" said Kenneth Nussear, a wildlife biologist with the United States Geological Service in Las Vegas. "We can make that change and redo the map and see what the future might look like for tortoises. This is the first step needed to get there. That’s where we want to go."
Interesting2: In the midst of a third consecutive dry year, California’s water supply continues to shrink as the state’s population grows, but according to a new report by the Natural Resources Defense Council, the state’s commercial, industrial and institutional (CII) sector has the tools to save more than enough water to meet the annual needs of Los Angeles, San Francisco and San Diego combined. Some leading California businesses and institutions are already catching on — saving water and money at the same time.
"After three consecutive dry years and global warming threatening to intensify California’s droughts, we need smart-water solutions that that will stop waste and help businesses use only what they need," said Ronnie Cohen, Director of Water Efficiency Policy for the Natural Resources Defense Council.
"Luckily, 21st-century technologies exist to stretch our water supply and save money. And some trailblazing California businesses and water agencies are already showing us how it’s done." In February of 2008, Governor Schwarzenegger called for a 20 percent reduction in per capita water use by 2020, and legislation to help reach that target is currently pending in the State Assembly (AB 49).
California’s CII sector — which includes office buildings, hotels, oil refineries, golf courses, schools and universities, restaurants and manufacturers — is responsible for one-third of urban water use, making progress in this sector essential to reaching this reduction goal.
The CII sector uses the equivalent of more than a million Olympic-sized swimming pools of water annually. NRDC estimates California businesses could save about 25-50 percent of that water with efficiency measures, or as much as 700,000 -1.3 million acre-feet — the equivalent to 350,000-650,000 Olympic-sized swimming pools.
Interesting3: Global scale oceanic circulation modeling has been moving to a new gridding method that projects the faces of a cube onto the surface of a sphere. They found that this method covers the sphere more uniformly than a latitude-longitude grid, and that it produces more accurate results near Earth’s poles.
This is helping refine modeling of ocean currents which are critical to global climate models, and has the potential to significantly improve the accuracy of climate change modeling. Researchers from NASA’s Jet Propulsion Laboratory (JPL), Pasadena, Calif. and Massachusetts Institute of Technology (MIT), Cambridge, Mass. are reaping huge benefits from research performed on NASA’s advanced supercomputers.
Scientists believe the ocean and its interactions with the atmosphere are key to studying climate change. To better understand these interactions, they identified three important areas in climate research. They look at the ‘states’ of the ocean and sea-ice, which includes their temperature, salinity, current speeds, and sea-surface elevation, and study their changes at and below the surface.
They also look at the ‘state’ of the atmosphere, which includes its temperature, humidity, and wind patterns, and study how it was affected by the changes in the ocean. These interactions between the atmosphere and ocean directly affect the weather. The scientists study the biological activity in the ocean and its responses to the changing ‘state’ of the ocean. These are important variables in the models, and require the most detailed treatment to be most accurately addressed.
Interesting4: Unlike trash disposal, carbon dioxide cannot be dumped in a landfill, shipped away or burned. But some Pennsylvania lawmakers hope to find another place for the greenhouse gas that scientists implicate as the main cause of global warming.
They’re looking to bury it. Carbon capture and sequestration would take a stream of compressed carbon dioxide directly from electric utilities and pump it underground into depleted oil fields, shale formations and aquifers thousands of feet below ground.
There, proponents hope, the gas will be permanently stored. Pennsylvania’s geology could store at least 100 years worth of the state’s annual carbon dioxide emissions, according to a report released earlier this month by the Department of Conservation and Natural Resources.
Such an amount would be significant: Pennsylvania emits 1 percent of the world’s annual carbon dioxide emissions. Pumping millions of pounds of pressurized gas more than 2,500 feet below ground is not easy.
Interesting5: It may seem like a stretch to call Jack Bernat, who spends his off-duty hours collecting and lovingly restoring muscle cars of the 1980s, an environmentalist. But then trace back a working life spent chasing after the vanishing jobs in Pennsylvania’s steel industry. In his 35 years in the workforce, Bernat endured lay-offs and shut-downs, scrambled for part-time and temporary work, and took jobs far from home.
Now the former steelworker is hoping he has at last found a job with a future, putting the finishing touches to the giant fiberglass blades for wind turbines produced by the Spanish firm, Gamesa.
"My biggest concern is not to have happening to this generation what happened to mine — where you end up 10 years here, 10 years there, and then you are like me 54 years old, and five different careers and no seniority anywhere," said Bernat, who heads the chapter of the United Steelworkers of America union at the wind turbine plant.
"I want to see the longevity of this thing." Those hopes provide a powerful impetus for an alliance between the environmental and labor movements that could prove critical to the course of Barack Obama’s hopes to transform America’s energy economy.
Interesting6: Geothermal energy has always been thought of as a clean, renewable form of power, but since the Hellisheidi geothermal power plant began operation about 30 km from central Reykjavik in 2006, various problems have come to light. Not long after the station started producing electricity, Reykjavik residents became aware that they had to clean silverware every three to four days instead of three to four months because it was always covered with black soot.
Truck drivers who drove daily to sand mines in the western part of Hellisheidi found that the rubber in the suspension and steering systems of their vehicles became hard and prone to breakage after only a year, whereas normally it would take three to five years for this to happen.
People suspected that the Hellisheidi plant was responsible for the damage, but at first this was never discussed openly. Then in September 2008, people saw that the moss vegetation adjacent to the Hellisheidi plant was severely damaged.
The company Reykjavik Energy immediately arranged for research to be carried out on the moss damage, together with research at two other geothermal plants, Nesjavellir and Svartsengi, and a control site.
Interesting7: Drip, drip, drip come the studies one after another, reinforcing the threat to the Northeast from rising sea levels along the U.S. and Canadian east coast. If Greenland’s ice melts at moderate to high rates, ocean circulation by 2100 could shift and cause sea levels off the Northeast coast of North America to rise by about 12 to 20 inches more than other coastal areas, researchers report Wednesday in Geophysical Research Letters. "Major northeastern cities are directly in the path of the greatest rise," researcher Aixue Hu of the National Center for Atmospheric Research said.
The report comes on the heels of two other studies with similar warnings.
• Just over a week ago scientists at Britain’s University of Bristol reported that while collapse of the West Antarctic Ice Sheet would not raise global sea levels as much as had previously been feared, the maximum increase is expected along the East and West Coasts of the USA.
• And in March, researchers at the University of Maryland warned that, however much the oceans rise by the end of the century, add an extra eight inches or so for New York, Boston and other spots along the coast from the mid-Atlantic to New England because of predicted changes in ocean currents.
The Intergovernmental Panel on Climate Change in 2007 projected that sea levels worldwide could rise by an average of seven to 23 inches this century. "The oceans will not rise uniformly as the world warms," NCAR scientist Gerald Meehl, a co-author of the new paper, said in a statement.
"Ocean dynamics will push water in certain directions, so some locations will experience sea level rise that is larger than the global average." In recent years, the melting of the Greenland ice cap has been increasing at a rate of about 7% per year.
The researchers calculated the sea level impact if that were to continue and also if the increase declined to 3% or 1% annually. At the middle or 3% rate, the Northeast would see an extra foot of sea level rise because of ocean circulation changes, in addition to the global sea level increase, they reported.
A drop to 1% would mean eight additional inches of water in the Northeast, and a continued 7% increase would result in an extra 20 inches, the new study said. The research was supported by the U.S. Department of Energy, National Science Foundation and NASA.