


Air Temperatures – The following maximum temperatures (F) were recorded across the state of Hawaii Monday…along with the low temperatures Monday:
83 – 73 Lihue, Kauai
85 – 75 Honolulu, Oahu
89 – 76 Molokai AP
91 – 70 Kahului AP, Maui – Record high Monday was 93…in 1976
88 – 78 Kona AP
87 – 71 Hilo AP, Hawaii
Here are the latest 24-hour precipitation totals (inches) for each of the islands…Monday evening:
5.23 Mount Waialeale, Kauai
8.75 Manoa Lyon Arboretum, Oahu
0.31 Molokai
0.22 Lanai
0.00 Kahoolawe
0.89 Puu Kukui, Maui
0.42 Glenwood, Big Island
The following numbers represent the strongest wind gusts (mph)…Monday evening:
30 Port Allen, Kauai
29 Kuaokala, Oahu
25 Molokai
29 Lanai
35 Kahoolawe
30 Maalaea Bay, Maui
31 Kealakomo, Big Island
Hawaii’s Mountains – Here’s a link to the live web cam on the summit of near 13,800 foot Mauna Kea on the Big Island of Hawaii. This web cam is available during the daylight hours here in the islands…and when there’s a big moon shining down during the night at times. Plus, during the nights you will be able to see stars, and the sunrise and sunset too…depending upon weather conditions.
Aloha Paragraphs

Tropical Storm Howard…far east-southeast of the islands

![]()
What the computer models are showing…no worries for Hawaii

Thunderstorms far southwest of Hawaii

Low clouds being carried towards the islands from the east

Showers will increase along the windward sides into Tuesday morning – Looping radar image
Small Craft Advisory…windiest coasts and channels Maui County and the Big Island
~~~ Hawaii Weather Narrative ~~~
Moderately strong trade winds will become gradually stronger through the week…then likely lighter as we move into the weekend. Here’s the latest weather map, showing moderately strong, near 1034 millibar high pressure system far north-northeast of Hawaii. The trade winds will continue through the next week, likely peaking in strength towards Wednesday or Thursday. The models suggest that by the weekend into early next week, our local trade winds may go through some changes, although its too early to know if they will quicken their pace…or ease up some.
Here’s a wind profile…of the offshore waters around the islands – with a closer view
Here’s the Hawaiian Islands Sulfate Aerosol animated graphic – showing vog forecast
Somewhat wetter than normal on windward Kauai and Oahu tonight into Tuesday morning…with somewhat less showers falling across Maui County and the Big Island. Meanwhile, a low pressure system aloft will provide enough instability, to produce a few heavier showers. The models go on to suggest an increase in showers early Thursday into Friday morning, as another slug of tropical moisture (associated with former TC Frank) arrives on the trade wind flow. Then, as we move into the weekend we could see yet another area of tropical moisture (associated with what will be former TC Howard) arriving into early next week.
Marine environment details: A small craft advisory (SCA) remains in effect for the typically windy waters around Maui County and the Big Island through mid-week. Strong high pressure will remain in place well to the north of the state through the week, so this advisory will likely need to be extended in time…and may need to be expanded to include other marine zones as well.
Surf will remain below advisory levels along all shorelines for the foreseeable future. A series of small south to southwest swells will provide small surf to leeward shores, while trade winds supply wind swell waves to the windward coasts.


What’s known as Chinaman’s Hat, two views…Oahu
World-wide tropical cyclone activity
>>> Atlantic Ocean: No active tropical cyclones
Here’s a satellite image of the Atlantic Ocean
>>> Caribbean Sea: No active tropical cyclones
1.) A vigorous tropical wave passing just south of Jamaica is moving rapidly westward at about 20 mph toward the northwestern Caribbean Sea. Environmental conditions are favorable for additional development, and a tropical storm will likely form later today. An Air Force plane is enroute to investigate the wave and determine if a closed circulation has formed. Regardless of tropical cyclone formation, the wave is already producing winds of 40 to 45 mph, and these conditions along with heavy rains will likely continue over portions of Jamaica this morning, and will spread over the Cayman Islands later today. Interests in the western Caribbean Sea, primarily the north coast of Honduras, Belize, and the Yucatan Peninsula should monitor products issued by their local meteorological services for possible watches and warnings.
* Formation chance through 48 hours…high…80 percent
* Formation chance through 5 days…high…90 percent
This disturbance is being referred to as Invest 97L…soon to strengthen and become more organized, at which time this system will be called Tropical Storm Earl, here’s a satellite image...and what the computer models are showing

>>> Gulf of Mexico: No active tropical cyclones
Tropical cyclone formation is not expected during the next 5 days
Here’s a satellite image of the Caribbean Sea…and the Gulf of Mexico
Here’s the link to the National Hurricane Center (NHC)
>>> Eastern Pacific:
Tropical Storm 09E (Howard) remains active in the eastern Pacific…located 1255 miles west of the southern tip of Baja California. Here’s a NHC graphical track map, with a satellite image…and what the computer models are showing.
1.) A broad low pressure system located about 800 miles south-southwest of the southern tip of the Baja California peninsula is producing disorganized showers and thunderstorms. Environmental conditions are expected to be conducive for gradual development of this system, and a tropical depression is likely to form later this week while the low moves west-northwestward at about 15 mph.
If this system becomes a tropical depression, it will be called 10E, and if it goes on to become a tropical storm…will take on the name Ivette.
* Formation chance through 48 hours…medium…50 percent
* Formation chance through 5 days…high…90 percent

Here’s a wide satellite image that covers the entire area between Mexico, out through the central Pacific…to the International Dateline.
Here’s the link to the National Hurricane Center (NHC)
>>> Central Pacific: No active tropical cyclones
Tropical cyclone formation is not expected during the next 2-days
Here’s a link to the Central Pacific Hurricane Center (CPHC)
Typhoon 06W (Nida) has moved inland across the Chinese coast and is dissipating…located about 49 miles northwest of Hong Kong, here’s the JTWC graphical track map, with a satellite image – Final Warning
>>> South Pacific Ocean: No active tropical cyclones
>>> North and South Indian Oceans / Arabian Sea: No active tropical cyclones
Here’s a link to the Joint Typhoon Warning Center (JTWC)
Interesting: 2016 climate trends continue to break records – Two key climate change indicators — global surface temperatures and Arctic sea ice extent — have broken numerous records through the first half of 2016, according to NASA analyses of ground-based observations and satellite data.
Each of the first six months of 2016 set a record as the warmest respective month globally in the modern temperature record, which dates to 1880, according to scientists at NASA’s Goddard Institute for Space Studies (GISS) in New York. The six-month period from January to June was also the planet’s warmest half-year on record, with an average temperature 1.3 degrees Celsius (2.4 degrees Fahrenheit) warmer than the late nineteenth century.
Two key climate change indicators — global surface temperatures and Arctic sea ice extent — have broken numerous records through the first half of 2016, according to NASA analyses of ground-based observations and satellite data.
Each of the first six months of 2016 set a record as the warmest respective month globally in the modern temperature record, which dates to 1880, according to scientists at NASA’s Goddard Institute for Space Studies (GISS) in New York.
The six-month period from January to June was also the planet’s warmest half-year on record, with an average temperature 1.3 degrees Celsius (2.4 degrees Fahrenheit) warmer than the late nineteenth century.
Five of the first six months of 2016 also set records for the smallest respective monthly Arctic sea ice extent since consistent satellite records began in 1979, according to analyses developed by scientists at NASA’s Goddard Space Flight Center, in Greenbelt, Maryland. The one exception, March, recorded the second smallest extent for that month.
While these two key climate indicators have broken records in 2016, NASA scientists said it is more significant that global temperature and Arctic sea ice are continuing their decades-long trends of change. Both trends are ultimately driven by rising concentrations of heat-trapping carbon dioxide and other greenhouse gases in the atmosphere.
The extent of Arctic sea ice at the peak of the summer melt season now typically covers 40 percent less area than it did in the late 1970s and early 1980s. Arctic sea ice extent in September, the seasonal low point in the annual cycle, has been declining at a rate of 13.4 percent per decade.
“While the El Niño event in the tropical Pacific this winter gave a boost to global temperatures from October onwards, it is the underlying trend which is producing these record numbers,” GISS Director Gavin Schmidt said.
Previous El Niño events have driven temperatures to what were then record levels, such as in 1998. But in 2016, even as the effects of the recent El Niño taper off, global temperatures have risen well beyond those of 18 years ago because of the overall warming that has taken place in that time.
The global trend in rising temperatures is outpaced by the regional warming in the Arctic, said Walt Meier, a sea ice scientist at NASA Goddard.
“It has been a record year so far for global temperatures, but the record high temperatures in the Arctic over the past six months have been even more extreme,” Meier said. “This warmth as well as unusual weather patterns have led to the record low sea ice extents so far this year.”
NASA tracks temperature and sea ice as part of its effort to understand the Earth as a system and to understand how Earth is changing. In addition to maintaining 19 Earth-observing space missions, NASA also sends researchers around the globe to investigate different facets of the planet at closer range.
Right now, NASA researchers are working across the Arctic to better understand both the processes driving increased sea ice melt and the impacts of rising temperatures on Arctic ecosystems.
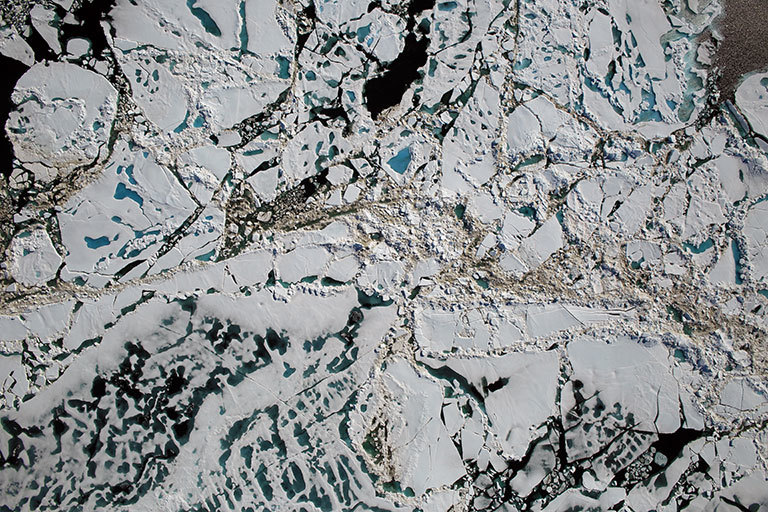
NASA’s long-running Operation IceBridge campaign last week began a series of airborne measurements of melt ponds on the surface of the Arctic sea ice cap. Melt ponds are shallow pools of water that form as ice melts. Their darker surface can absorb more sunlight and accelerate the melting process.
IceBridge is flying out of Barrow, Alaska, during sea ice melt season to capture melt pond observations at a scale never before achieved. Recent studies have found that the formation of melt ponds early in the summer is a good predictor of the yearly minimum sea ice extent in September.
“No one has ever, from a remote sensing standpoint, mapped the large-scale depth of melt ponds on sea ice,” said Nathan Kurtz, IceBridge’s project scientist and a sea ice researcher at NASA Goddard. “The information we’ll collect is going to show how much water is retained in melt ponds and what kind of topography is needed on the sea ice to constrain them, which will help improve melt pond models.”
Operation IceBridge is a NASA airborne mission that has been flying multiple campaigns at both poles each year since 2009, with a goal of maintaining critical continuity of observations of sea ice and the ice sheets of Greenland and Antarctica.