


Air Temperatures – The following maximum temperatures (F) were recorded across the state of Hawaii Wednesday…along with the minimums Wednesday:
81 – 66 Lihue, Kauai
82 – 69 Honolulu, Oahu
82 – 63 Molokai AP
82 – 67 Kahului AP, Maui
80 – 64 Kailua Kona
84 – 69 Hilo AP, Hawaii
Here are the latest 24-hour precipitation totals (inches) for each of the islands, as of Wednesday evening:
0.17 Hanapepe, Kauai
0.35 Mililani, Oahu
0.00 Molokai
0.00 Lanai
0.33 Kahoolawe
0.49 Kula Branch Station, Maui
4.15 Pali 2, Big Island
The following numbers represent the strongest wind gusts (mph)…as of Wednesday evening:
17 Moloaa Dairy, Kauai – SE
12 Honouliuli FWS, Oahu – NNE
10 Molokai – ENE
14 Lanai – NE
12 Kahaloowe – SSE
12 Hana, Maui – NNW
20 Upolu AP, Big Island – NE
Hawaii’s Mountains – Here’s a link to the live web cam on the summit of near 13,800 foot Mauna Kea on the Big Island of Hawaii. This web cam is available during the daylight hours here in the islands…and when there’s a big moon shining down during the night at times. Plus, during the nights you will be able to see stars, and the sunrise and sunset too…depending upon weather conditions.
Aloha Paragraphs

The early spring storm track remains well north of Hawaii,
with a large swath of tropical moisture moving northeast…
far to the southeast of the islands

An area of low pressure is evident to our north, along with
a large area of deep clouds well southeast of Hawaii

Mostly clear to partly cloudy…with thunderstorms over the ocean
to the northeast, with a frontal cloud band northwest of Kauai

Showers falling locally over the ocean – looping radar image
(Kauai Radar is out of service)
~~~ Hawaii Weather Narrative ~~~
Light south to southeast winds prevail…keeping volcanic haze and muggy conditions in the area. Here’s the latest weather map, showing the Hawaiian Islands, and the rest of the North Pacific Ocean. We find a high pressure system far to the northeast of Hawaii, with an associated ridge of high pressure over the state. At the same time, we see a storm low pressure system far to the north, in the Gulf of Alaska…with an associated weak cold front/trough over the ocean to the northwest of the islands. Our local winds are generally light southeast and south. This wind direction is carrying thick volcanic haze, and moisture at times over the islands…with light winds continuing through the weekend into early next week at least.
There will be localized showers, with still the threat of a few heavy downpours or even a thunderstorm. The primary focus of showers over the next few days, will occur mostly during the afternoon and early evening hours…although not exclusively. This is due to a nearby area of low pressure, which is keeping our local atmosphere shower prone. The days should begin in a clear to partly cloudy way, with the daytime heating of the islands prompting late morning through early evening clouds. These clouds are still apt to unload a few showers, some of which may continue to be locally quite generous in places. We’ll see yet another chance of heavy showers or thunderstorms later Friday into Saturday. Our local weather may remain a bit unsettled through the weekend in fact…with the next cold front approaching early next week.
Marine environment details: No marine warnings or advisories are in effect now, and none are expected for the rest of the week, with winds and swell staying below small craft advisory levels. Surf-wise, small surf, perhaps the smallest this season, will have a small bump arriving Thursday. This swell will be followed by a slightly larger northwest swell on Saturday and Saturday night, with surf maxing out at 5 feet (10 foot wave faces) along best aligned north shores. A gradual decline will follow on Sunday. Models are suggesting a very large northwest swell arriving next Tuesday night…with warning level surf into Wednesday. A small background swell from the south will persist along our leeward beaches throughout the forecast period.
Here’s a wind profile…of the offshore waters around the islands – with a closer view
Here’s the Hawaiian Islands Sulfate Aerosol…animated graphic – showing vog forecast
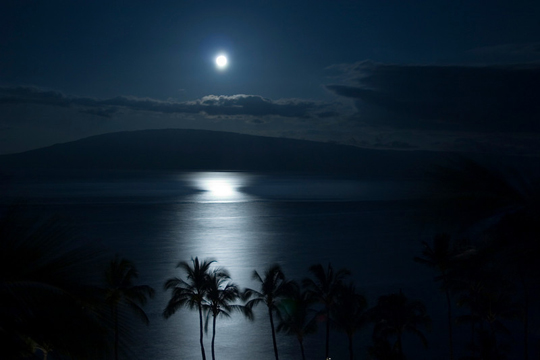
Here in Maui County…It’s mostly clear early this Wednesday morning. There are streaks of high cirrus clouds around, which may light up a pretty pink at sunrise. As the moon is nearing its full measure, it’s sinking into the western horizon. I can see volcanic haze in our environment before sunrise. Here in upcountry Kula, it was mostly clear and calm, with the air temperature 50F degrees. The temperature at near the same time was 66 degrees down in Kahului under clear skies, 64 out in Hana with clear skies, and 37 atop the Haleakala summit. Meanwhile, Kahoolawe was 72 degrees, 64 at Lanai City under clear skies, with 66 at the Molokai airport…also with clear skies.
– 1250pm, partly cloudy, and I just heard a substantial couple of claps of thunder in the distance! I can see towering cumulus over the West Maui Mountains from here in Kula, and of course the ongoing volcanic haze that’s blanketing Maui County. / Our first shower of the afternoon just arrived at 115pm, although already now at 130pm…it’s turning lighter. Water is falling again, a nice light steady shower…which has turned into a downpour – even as the sun shines! / Now at 320pm, I can hear many claps of thunder in the distance, and see rain falling in several directions…including a moderately heavy shower here at my place in Kula now. / 4pm with a big thunderstorm right over my area…pouring rain too!
– Early evening, just after 5pm as a matter of fact, and I just heard the latest clap of thunder to the west of my location here in Kula. As I mentioned above, the combination of the plentiful moisture, low pressure in our area, and the daytime heating of the islands…is what set the stage for the locally heavy showers and thunderstorms today. I anticipate that upon sunset into the night, we’ll see most of the clouds gradually evaporating. This in turn, will highlight the near full moon that will be beaming down upon us during the night.
World-wide tropical cyclone activity:
>>> Atlantic Ocean: The last regularly scheduled Tropical Weather Outlook of the 2015 Atlantic hurricane season…has occurred. Routine issuance of the Tropical Weather Outlook will resume on June 1, 2016. During the off-season, Special Tropical Weather Outlooks will be issued if conditions warrant. Here’s the 2015 hurricane season summary
Here’s a satellite image of the Atlantic Ocean
>>> Caribbean Sea: The last regularly scheduled Tropical Weather Outlook of the 2015 Atlantic hurricane season…has occurred. Routine issuance of the Tropical Weather Outlook will resume on June 1, 2016. During the off-season, Special Tropical Weather Outlooks will be issued if conditions warrant.
>>> Gulf of Mexico: The last regularly scheduled Tropical Weather Outlook of the 2015 Atlantic hurricane season…has occurred. Routine issuance of the Tropical Weather Outlook will resume on June 1, 2016. During the off-season, Special Tropical Weather Outlooks will be issued if conditions warrant.
Here’s a satellite image of the Caribbean Sea…and the Gulf of Mexico
Here’s the link to the National Hurricane Center (NHC)
>>> Eastern Pacific: The last regularly scheduled Tropical Weather Outlook of the 2015 North Pacific hurricane season…has occurred. Routine issuance of the Tropical Weather Outlook will resume on May 15, 2016. During the off-season, Special Tropical Weather Outlooks will be issued if conditions warrant. Here’s the 2015 hurricane season summary
Here’s a wide satellite image that covers the entire area between Mexico, out through the central Pacific…to the International Dateline.
Here’s the link to the National Hurricane Center (NHC)
>>> Central Pacific: The central north Pacific hurricane season has officially ended. Routine issuance of the tropical weather outlook will resume on June 1, 2016. During the off-season, special tropical weather outlooks will be issued if conditions warrant. Here’s the 2015 hurricane season summary
Here’s a link to the Central Pacific Hurricane Center (CPHC)
>>> South Pacific Ocean: No active tropical cyclones
>>> North and South Indian Oceans / Arabian Sea: No active tropical cyclones
Here’s a link to the Joint Typhoon Warning Center (JTWC)
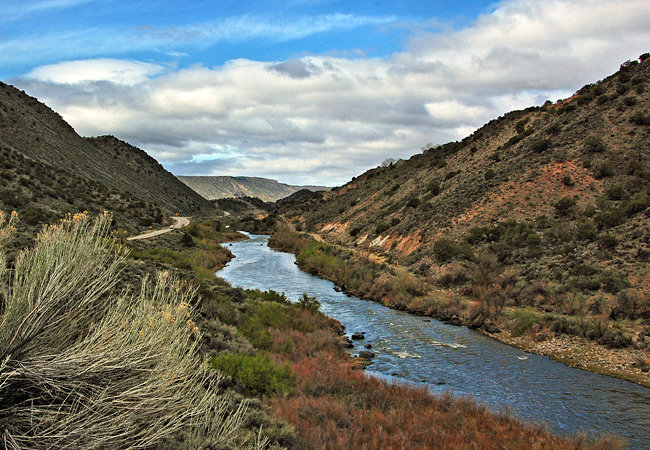
Interesting: New research on the Rio Grande and impacts of long drought – New research can help water managers along the Rio Grande make wise decisions about how to best use the flow of a river vital for drinking water, agriculture and aquatic habitat. These studies also show how conditions from the prolonged drought in the West have affected the Rio Grande watershed.
The Rio Grande forms the world’s longest river border between two countries as it flows between Texas and Mexico, where it is known as the Rio Bravo. The river runs through three states in the U.S., beginning in southern Colorado and flowing through New Mexico and Texas before it forms the border with Mexico.
Parts of the Rio Grande are designated as wild and scenic, but most of the river is controlled and passes through several dam and reservoir systems during its 1,896 mile journey to the Gulf of Mexico. The river is managed through a complex system of compacts, treaties, and agreements that determine when and how much water is released along the river’s length.
The amount and timing of water releases have varied in recent years due to drought. Recent USGS research on the middle Rio Grande looked at the effects of those changes on the amount of salts that build up in the Rincon and Mesilla Valleys in Texas and New Mexico. Results showed a decline in the amount of salt carried by the river due to a decrease of releases during the drought. The two valleys responded differently to the decreased releases. Salt levels in the Rincon Valley declined, whereas salt levels in the Mesilla Valley increased. Salt buildup in the soil and water can affect agriculture, which is an important industry in those valleys.
Successfully managing water use along the river is important to the sustainability of agricultural and communities along the river. To help with that goal, USGS has measured water gains and losses to the Rio Grande from between the Leasburg Dam near Leasburg, New Mexico, and the American Dam near El Paso, Texas. American Dam is near where the Rio Grande becomes the border with Mexico. For the past several years, drought conditions contributed to decreasing flows along this 64-mile stretch, and sections of the river were dry during parts of the year.
Flow in the Rio Grande is affected by how water is used throughout the basin. For instance, the Albuquerque area of New Mexico has two principal sources of water: groundwater from the underlying aquifer system and withdrawals and diversions from the Rio Grande. From 1960 to 2002, pumping from the aquifer system caused groundwater levels to decline from about 40 feet along the Rio Grande in Albuquerque to more than 120 feet in the valley away from the river. As a result, the USGS, in cooperation with the Bureau of Reclamation, conducted a study to understand the exchange of water between the Rio Grande and the aquifer system.
By characterizing the interaction between surface water from the Rio Grande and groundwater from the aquifer system, scientists provide valuable information to help managers make informed decisions about water use.