


Air Temperatures – The following maximum temperatures were recorded across the state of Hawaii Thursday:
Lihue, Kauai – 83
Honolulu airport, Oahu – 84 (Record high for Thursday / 90 – 1979 )
Kaneohe, Oahu – M
Molokai airport – 82
Kahului airport, Maui – 84 (Record high for Thursday / 90 – 1952 )
Kona airport – 83
Hilo airport, Hawaii – 81
Air Temperatures ranged between these warmest and coolest spots near sea level – and on the highest mountain tops…as of 5pm Thursday evening:
Barking Sands, Kauai – 84
Kapalua, Maui – 77
Haleakala Crater – 52 (near 10,000 feet on Maui)
Mauna Kea – 37 (near 13,800 feet on the Big Island)
Hawaii’s Mountains – Here’s a link to the live web cam on the summit of near 13,800 foot Mauna Kea on the Big Island of Hawaii. This web cam is available during the daylight hours here in the islands…and when there’s a big moon shining down during the night at times. Plus, during the nights you will be able to see stars, and the sunrise and sunset too…depending upon weather conditions. Here's the Haleakala Crater webcam on Maui…although this webcam is not always working correctly.
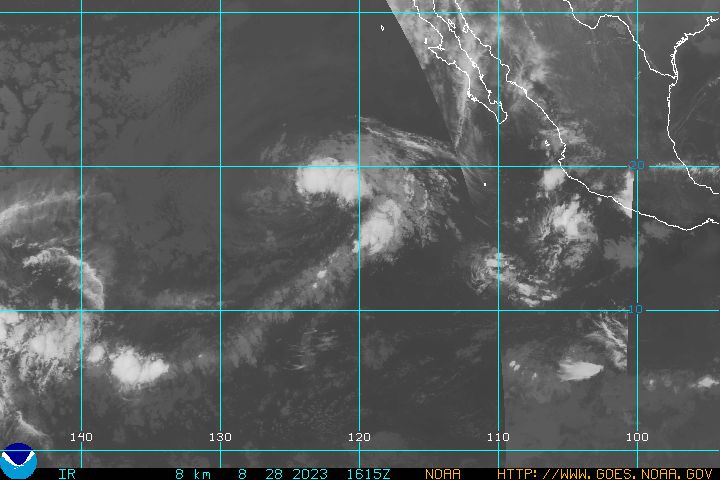
Tropical Cyclone activity in the eastern and central Pacific – Here’s the latest weather information coming out of the National Hurricane Center, covering the eastern north Pacific. You can find the latest tropical cyclone information (once the season begins June 1) for the central north Pacific (where Hawaii is located) by clicking on this link to the Central Pacific Hurricane Center. A satellite image, which shows the entire ocean area between Hawaii and the Mexican coast…can be found here. Here's a tropical cyclone tracking map for the eastern and central Pacific.
Aloha Paragraphs

Strong and gusty trade winds…passing windward
showers at times, a few leeward – diminishing Friday
Small craft wind advisory coastal and channel waters
statewide – gale warnings in the windiest areas
in Maui County-Big Island
High surf advisory east facing beaches
As this weather map shows, we have a a near 1034 millibar high pressure system located to the northeast of the islands, with elongated high pressure ridges extending far northwest and northeast of the state. Our local winds will continue to be from the trade wind direction…remaining locally strong and gusty.
The following numbers represent the most recent top wind gusts (mph), along with directions as of Thursday evening:
28 Waimea Heights, Kauai – ENE
35 Kuaokala, Oahu – NE
33 Molokai – NE
43 Kahoolawe – NE
39 Kahului, Maui – NE
36 Lanai – NE
33 Pali 2, Big Island – NE
We can use the following links to see what’s going on in our area of the north central Pacific Ocean. Here's the latest NOAA satellite picture – the latest looping satellite image…and finally the latest looping radar image for the Hawaiian Islands.
Here are the latest 24-hour precipitation totals (inches) for each of the islands as of Thursday evening:
1.79 Mount Waialeale, Kauai
0.25 Moanalua, Oahu
0.00 Molokai
0.00 Lanai
0.00 Kahoolawe
0.37 Puu Kukui, Maui
0.65 Island Dairy, Big Island
Sunset Commentary: The trade winds will remain stronger than normal into Friday…into the holiday weekend. This is turning out to be a long lasting trade wind weather pattern, as our trades will remain active through the next week at least. The NWS forecast office in Honolulu is keeping the small craft wind advisories across all the marine zones statewide. An unusual gale warning remains active across those windiest coastal and channel waters around Maui County and the Big Island through 6pm Friday. These gusty winds will gradually taper off…becoming moderately strong as we push into next week.
As far as precipitation goes, there will be incoming showers at times, carried by the stronger than usual trade wind flow. The trade winds will carry most of the showery clouds to our windward coasts and slopes. These showers will taper off somewhat Friday into the weekend time frame. The leeward sides of the islands should remain quite nice, although some areas will find clouds being carried over there on the blustery trade winds…leading to a few showers at times too. The overlying atmosphere however remains relatively stable, which will generally keep any showers that do fall, in the light to locally moderately category.
Here in Kula, Maui at 550pm, it was clear to partly cloudy, with still some volcanic hazy around, with an air temperature of 74.7F degrees. The winds continued to be our most pressing issue today, as they have been the last few days…and will continue to be into the holiday weekend. The vog that we saw earlier in the week faded away quite a bit yesterday, although looking down into the Central Valley from here in Kula, I can it has remained in place through the day into this evening. I would call it light to moderately thick at the moment. As to why it is occurring so often this week, my best guess is that the winds are coming directly out of the east, or perhaps even out of the east-southeast. This may be catching some of the volcanic emissions issuing from the vent on the Big Island…that's the only thing I can think of.
Glancing over towards the windward side of east Maui, I can see the usual clouds, that continue to be brought in on the gusty trade wind flow. We can use this satellite image to see clouds upstream of the windward sides of the islands, especially from the Big Island up through Maui, and to somewhat a lesser degree Oahu and Kauai. There are also areas of high and middle level clouds to our north…those brighter white clouds. We've had showers overnight in places, with the largest amounts over an inch, on both Kauai and the Big Island. ~~~ I'll be back early Friday morning with your next new weather narrative. As always, I hope that you have a great Thursday night wherever you happen to be spending it! Aloha for now…Glenn.
Tropical cyclone reports-
Eastern Pacific: The second tropical cyclone of the 2012 hurricane season remains active in the eastern Pacific. This tropical system has now become category 3 major Hurricane Bud (2E). Bud was located approximately 170 miles southwest of Manzanillo, Mexico, with 115 mph sustained winds. Here's the NHC storm track map, along with a satellite image. This satellite image shows Bud's central eye. There is absolutely no threat to the Hawaiian Islands from this developing tropical system as it continues on a path towards the Mexican coast into the weekend. As Bud nears the coast it's expected to bring very strong winds and heavy flooding rains. / The eastern Pacific Ocean is expected to have a near normal hurricane season, with 12-18 tropical cyclones.
Central Pacific: Here in the central part of the Pacific, the hurricane season begins as of June 1. The Central Pacific Hurricane Center in Honolulu is forecasting 2-4 tropical cyclones in this part of the Pacific Basin…which is slightly below the average number. An average season has 4-5 tropical cyclones, which include tropical depressions, tropical storms and hurricanes.
Atlantic Ocean: There are no active tropical cyclones – although there is an area under investigation (called 94L) in the northwestern Caribbean. This tropical disturbance has a near 60% chance of developing into a tropical system by Saturday. Although environmental conditions are not conducive for development at this time, there is a better chance that this tropical disturbance will develop into a tropical cyclone this weekend…as it moves into the southwest Atlantic. Persons in the southeast coastal areas of the United States should pay close attention to this likely developing tropical system over the weekend./ According to the NOAA 2012 hurricane season forecast, the Atlantic Ocean is expected to have a near-normal amount of tropical cyclones. This would include 12 named storms with six hurricanes…including three major hurricanes.
Western Pacific Ocean: Typhoon Sanvu (03W) is active in the western Pacific. The latest forecast by the Joint Typhoon Warning Center (JTWC) is for Sanvu to become stronger during the next 12 hours. It was located approximately 190 nautical miles southwest of Iwo To, Japan. Here's the latest JTWC graphical track map. Here's a NOAA satellite image of Sanvu. At the moment, this tropical cyclone isn't expected to impact any island areas in the western Pacific…although is forecast to get within just 56 miles from the small Japanese island of Iwo To. Top sustained winds at the time of this writing were 80 knots, with gusts to 100 knots.
Interesting: The island nation of Kiribati is one of the countries most threatened by rising sea levels. However, many of the floods it has seen may be due to a mix of natural variability and human activities, complicating the picture of how rising sea levels are endangering Kiribati and other island nations. The Republic of Kiribati in the central tropical Pacific is home to about 103,500 people.
Its capital on the atoll of Tarawa has seen dramatic flooding in recent years. For instance, during the 2004 to 2005 El Niño, two major floods occurred — a "king" tide in February 2005 damaged the hospital in the town of Betio, and a second flood two weeks later breached sea walls, flooded causeways and damaged homes and public infrastructure.
The existence of low-lying nations such as Kiribati is indeed threatened by rising sea levels — "there is no doubt whatsoever," said researcher Simon Donner, a climate scientist at the University of British Columbia in Vancouver who has done research on Kiribati since 2005. In fact, the island nation is considering the purchase of land in Fiji to safeguard its people threatened by the rising seas.
Moreover, the flooding events Kiribati has seen are more likely to happen as global average sea levels continue to rise. "A lot of the country could be uninhabitable within the century," said Donner, who based his conclusions on a review of past research on the phenomenon.
However, Donner cautioned these flooding events are not in and of themselves evidence of rising sea levels. "You can't blame every flood on sea-level rise, just like you can't blame every heat wave on climate change," he said. "The evidence for a human-caused increase in global sea level is overwhelming," Donner added. "I'm merely reminding people that, like the temperature, the sea level varies from place to place and from day to day."
Sea level can vary over time for many reasons. There are daily, weekly and annual cycles of tides due to the gravitational pulls of the moon and sun. Also, sea level at any single location is sensitive to changes in the weather and ocean features, with sea level capable of rising on an hourly to weekly time scale during periods of low atmospheric pressure — for example, the storm surges driven by tropical cyclones.
In addition, local sea level can vary on weekly to monthly time scales because of phenomena such as El Niño and La Niña, collectively known as the El Niño Southern Oscillation. This oscillation refers to the seesaw pattern of reversing surface air pressure between the eastern and western tropical Pacific.
At the same time, people are modifying coastlines in ways that can influence the magnitude and frequency of floods, as well as the very shapes of islands. For instance, land reclamation at Tarawa — which involved filling in areas behind sea walls — increased land in some locations but aggravated erosion and flooding in others, such as the atoll's airport.
Mining barrier reefs and beaches for construction material can also make the shoreline vulnerable to extreme tides and storms. Moreover, the building of causeways between islets has altered how these small islands evolve, diverting sediment to some while eroding it away from others. For instance, the loss of the lagoon islet of Bikeman, a once-popular resting spot for fisherman near Betio, is due primarily to the construction of the Betio-Bairiki causeway, and not rising sea levels.
Donner wants to avoid the false impression that Tarawa is subject to constant flooding because of sea-level rise. "When scientists or environmentalists use a photo of a flooded village in Kiribati as evidence of sea-level rise, they open the door for critics of climate science," Donner said.
"We can't attribute an individual flooding event on sea level rise any more than we can attribute an individual heat wave to global warming." Future research should pinpoint ways one might responsibly attribute flooding to rising sea levels.
"Climate scientists often try to work out the odds of an event, like a heat wave, happening with and without the human influence on the climate," Donner said. "We should analyze recent storm surges and flooding events the same way."
Interesting2: Two manmade pollutants known best as threats to human health have just been charged with two more offenses: shifting rainfall patterns and mucking with food production. Black carbon and tropospheric ozone, both of which derive from the incomplete burning of fossil fuels, may be working in cahoots with greenhouse gases to expand Earth’s tropical belt (highlighted above in red).
Unabated, future expansion could drive major shifts in global precipitation patterns, which could in turn disrupt regional agriculture, warns climatologist Robert J. Allen of the University of California, Riverside. When the tropics widen, wind patterns shift toward the poles, dragging important mid-latitude storm tracks along with them.
If storm systems move farther north, for example, southern portions of the U.S. and Asia could become drier, Allen explained in an article published in UCR Today. Based on comprehensive new climate simulations, Allen and his colleagues reported in Nature that black carbon and tropospheric ozone are the most likely primary drivers of the tropical expansion observed in the Northern Hemisphere. (In the Southern Hemisphere, the main culprit is depletion of stratospheric ozone.)
Direct observations have shown that the tropics widened by 0.7 degrees latitude per decade between 1979 and 2009, and previous climate simulations revealed that heating of the atmosphere at mid-latitudes is to blame. As expected, warming from greenhouse gases contributed to this effect. But Allen and his colleagues discovered that simulations that ignored black carbon and tropospheric ozone underestimated the observed tropical expansion in the Northern Hemisphere by about a third.
When they included black carbon and tropospheric ozone in the mix, their simulations showed far better agreement with observations. Indeed, their results imply that these two pollutants are responsible for about 70 percent of the recent tropical expansion in the Northern Hemisphere, Allen told Discovery News. That's no surprise when you consider that black carbon and tropospheric ozone both absorb solar radiation.
And since they persist in the atmosphere only one or two weeks, they cause the greatest atmospheric heat gain near their sources, which in the Northern Hemisphere tend to be the heavily populated low- to mid-latitudes. “Greenhouse gases do contribute to the tropical expansion in the Northern Hemisphere,” Allen said.
“But our work shows that black carbon and tropospheric ozone are the main drivers here. We need to implement more stringent policies to curtail their emissions, which would not only help mitigate global warming and improve human health, but could also lessen the regional impacts of changes in large-scale atmospheric circulation.”
Jamin Says:
Glen – is it possible that all this wind combined with the cane field burning is kicking up enough dust and smoke to have an effect similar to vog? Very dusty on the north shore from all this. Also there was a large dust devil spinning in the valley downwind of pu'unene this afternoon – reminded me of an Arizona desert scene. ~~~Hi Jamin, I’m sure that with the winds being as strong as they are, and have been lately, there there is dust involved in this haze as well. The cane field burning doesn’t help either, its difficult to know for sure, although I’d say that any way you look at it, that our local air qualities are less than perfect at this time. Thanks for your good comment! Aloha, Glenn