


April 29-30, 2010
Air Temperatures – The following maximum temperatures were recorded across the state of Hawaii Thursday afternoon:
Lihue, Kauai – 82
Honolulu, Oahu – 83
Kaneohe, Oahu – 79
Kaunakakai, Molokai – 83
Kahului, Maui – 89
Hilo, Hawaii – 71
Kailua-kona – 79
Air Temperatures ranged between these warmest and coolest spots near sea level around the state – and on the highest mountains…at 4pm Thursday afternoon:
Kahului, Maui – 85F
Princeville, Kauai – 72
Haleakala Crater – 54 (near 10,000 feet on Maui)
Mauna Kea summit – 39 (near 14,000 feet on the Big Island)
Precipitation Totals – The following numbers represent the largest precipitation totals (inches) during the last 24 hours on each of the major islands, as of Thursday afternoon:
2.07 Mount Waialaele, Kauai
3.51 Moanalua RG, Oahu
0.24 Molokai
0.00 Lanai
0.00 Kahoolawe
1.02 Mount Waialaele, Maui
0.22 Pahoa, Big Island
Marine Winds – Here’s the latest (automatically updated) weather map showing a 1035 millibar high pressure system to the northeast of the islands…moving northeast. The winds become lighter from the ESE to southeast Friday, then all the way down to light and variable Saturday.
Satellite and Radar Images: To view the cloud conditions we have here in Hawaii, please use the following satellite links, starting off with this Infrared Satellite Image of the islands to see all the clouds around the state during the day and night. This next image is one that gives close images of the islands only during the daytime hours, and is referred to as a Close-up visible image. This next image shows a larger view of the Pacific…giving perspective to the wider ranging cloud patterns in the Pacific Ocean. Finally, here’s a Looping IR satellite image, making viewable the clouds around the islands 24 hours a day. To help you keep track of where any showers may be around the islands, here’s the latest animated radar image.
Hawaii’s Mountains – Here’s a link to the live webcam on the summit of near 14,000 foot Mauna Kea on the Big Island of Hawaii. The tallest peak on the island of Maui is the Haleakala Crater, which is near 10,000 feet in elevation. These two webcams are available during the daylight hours here in the islands…and when there’s a big moon rising just after sunset for an hour or two! Plus, during the nights and early mornings you will be able to see stars, and the sunrise too…depending upon weather conditions.
Tropical Cyclone activity in the eastern and central Pacific – Here’s the latest weather information coming out of the National Hurricane Center, covering the eastern north Pacific. You can find the latest tropical cyclone information for the central north Pacific (where Hawaii is located) by clicking on this link to the Central Pacific Hurricane Center. Here’s a tracking map covering both the eastern and central Pacific Ocean. A satellite image, which shows the entire ocean area between Hawaii and the Mexican coast…can be found here. Of course, as we know, our hurricane season won’t begin again until June 1st here in the central Pacific.
Aloha Paragraphs
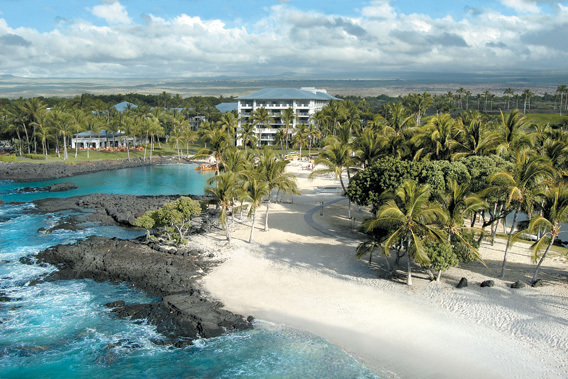
The Big Island’s beauty
The trade winds are currently giving way to southeast winds…which will become light and variable later Friday through the weekend into Monday. The NWS forecast office is keeping the limited small craft wind advisory restricted to only those windiest locations around Molokai down through the Big Island Thursday night. The trade winds will continue to blow through the rest of Thursday, although once they fade away…they aren’t expected to return until around next Tuesday. We’ll be into the month of May as the trade winds return next week…which is a month often filled with moderately strong trades.
An approaching upper trough of low pressure, with its associated surface cold front, will push towards our state during the weekend…bringing about a change in our weather. The first signs of this change will occur as the trade winds slow down going into Friday. The winds may become light and variable as a ridge of high pressure gets forced down over the islands into the weekend. While the southeast winds are blowing, they will pick up volcanic haze from the vents on the
The approach and arrival of this upper level trough of low pressure, with its cold air aloft, will begin to destabilize our overlying air mass. This trough will have a surface reflection, including a cold front that will try to push into the state Saturday night into Sunday. At the same time, the southeast breezes will help to carry moist tropical air our way. The combination of this moisture laden air, the unstable air mass, and the daytime heating of the islands, all add up to the chance of increasing showers. This weekend into perhaps Monday will be the time frame with the best chance of localized heavy downpours…perhaps even leading to flash flooding in some areas of the Aloha state.
We have until next Monday, after which the trade winds return Tuesday, to conjure up some much needed precipitation. The truth is that this chance of showers, even localized heavy downpours, couldn’t come at a better time! Many areas of the state are experiencing a distinct lack of water. The term that has been used lately is severe drought, which obviously means that any rainfall that we can get will be very welcome. We’d like to see this precipitation occur along our driest areas, which are of course the leeward sides from Molokai, down through Maui and the
It’s Thursday evening as I begin writing this last section of today’s narrative. Thursday was a great day, with the morning cloudiness burning off during the afternoon hours. As expected, it was quite a warm day, with Kahului, Maui reaching a very summery 89F degrees! I went back into the record books, and found that this was several degrees lower then the record hottest day for the month of April…which reached 92 degrees several times in the past. Our weather will continue to reach well up into the 80’s over the next several days, perhaps even reaching 90 degrees here and there! 90 doesn’t sound all that hot, athough considering that 100 is the highest maximum ever reached anywhere in the state, it’s still pretty impressive. Our winds were still strong today, most notably in those areas exposed to the southeast winds, like South Point on the Big Island, and Kahoolawe. South Point had a gust to 47 mph, while Kahoolawe topped out at 43 mph! Winds should be lighter on Friday, and then even lighter than that this weekend, when we’re going to be feeling hot and muggy! ~~~ I’m getting ready to leave Kihei, Maui now, taking the drive back upcountry to Kula. I’ll be up well before the crack of dawn Friday, preparing your next new weather narrative. I hope you have a great Thursday night until then! Aloha for now…Glenn.
Interesting: The poles control much of our global climate. Giant ice sheets in Antarctica behave like mirrors, reflecting the sun’s energy and moderating the world’s temperatures. The waxing and waning of these ice sheets contribute to changes in sea level and affect ocean circulation, which regulates our climate by transporting heat around the planet. Despite their present-day cold temperatures, the poles were not always covered with ice.
New climate records recovered from Antarctica during the recent Integrated Ocean Drilling Program (IODP) "Wilkes Land Glacial History" Expedition show that approximately 53 million years ago, Antarctica was a warm, sub-tropical environment. During this same period, known as the "greenhouse" or "hothouse" world, atmospheric CO2 levels exceeded those of today by ten times. Then suddenly, Antarctica’s lush environment transitioned into its modern icy realm.
In only 400,000 years — a mere blink of an eye in geologic time — concentrations of atmospheric carbon dioxide decreased. Global temperatures dropped. Ice sheets developed. Antarctica became ice-bound. How did this change happen so abruptly and how stable can we expect ice sheets to be in the future? To answer these questions, an international team of scientists participating in the Wilkes Land Glacial History Expedition spent two months aboard the scientific research vessel JOIDES Resolution in early 2010, drilling geological samples from the seafloor near the coast of Antarctica.
Despite negotiating icebergs, near gale-force winds, snow, and fog, they managed to recover approximately 2,000 meters (over one mile) of sediment core. "These sediments are essential to our research because they preserve the history of the Antarctic ice sheet," observed Dr. Carlota Escutia of the Research Council of Spain CSIC-University of Granada, who led the expedition, along with co-chief scientist Dr. Henk Brinkhuis of Utrecht University in the Netherlands.
"We can read these sediments like a history book," Brinkhuis explained. "And this book goes back 53 million years, giving us an unprecedented record of how ice sheets form and interact with changes in the climate and the ocean." Wilkes Land is the region of Antarctica that lies due south of Australia, and is believed to be one of the more climate-sensitive regions of the polar continent.
The new core samples collected during IODP’s Wilkes Land expedition are unique because they provide the world’s first direct record of waxing and waning of ice in this region of Antarctica. Combined, the cores tell the story of Antarctica’s transition from an ice-free, warm, greenhouse world to an ice-covered, cold, dry "icehouse" world. Sediments and microfossils preserved within the cores document the onset of cooling and the development of the first Antarctic glaciers and the growth and recession of Antarctica’s ice sheets.
Cores from one site resemble tree rings — unprecedented alternating bands of light and dark sediment preserve seasonal variability of the last deglaciation that began some 10,000 years ago. Understanding the behavior of Antarctica’s ice sheets plays a fundamental role in our ability to build robust, effective global climate models, which are used to predict future climate. "These models rely on constraints imposed by data from the field," the co-chiefs pointed out.
"Measurements of parameters such as age, temperature, and carbon dioxide concentration provide invaluable inputs that help increase the accuracy of these models. The more we can constrain the models, the better they’ll perform — and the better we can predict ice sheet behavior." What’s next? The science team now embarks on a multi-year process of on-shore analyses to further investigate the Wilkes Land cores. Age-dating and chemistry studies among other analyses are expected to resolve changes in Antarctica’s climate over unprecedented short timescales (50-20,000 years).
Data collected from the Wilkes Land expedition will complement previous research from drilling operations conducted elsewhere in the Antarctic over the last 40 years. Together, this research will provide important age constraints for models of Antarctic ice sheet development and evolution, thereby forming the basis for models of future ice sheet behavior and polar climatic change.
Interesting2: Compared to their neighbors south of the border, Canadians live longer, healthier lives. Research published in BioMed Central’s open access journal Population Health Metrics has found this disparity between the two countries, suggesting that America’s lack of universal health care and lower levels of social and economic equality are to blame. David Feeny, from Kaiser Permanente Center for Health Research, Oregon, USA, worked with a team of American researchers to study data from the Joint Canada/United States Survey of Health 2002/03.
He said, "Canada and the US share a common border and enjoy very similar standards of living, yet life expectancy in Canada is higher than in the US. There are two distinct potential explanations for the gap: differences in access to health care and in the prevalence of poverty." Canadians have a universal ‘prenatal to grave’ health service, which is free at point of care, while Americans’ access to health insurance is typically based on employment, income (Medicaid), or age (Medicare), and is not universal.
The degree of social inequality is also more pronounced in the US. The researchers found that Canadians can expect 2.7 more years of ‘perfect health’ than Americans — more than half of the gap found between the richest and poorest people in Canada. Speaking about the results, Feeny said, "The difference in health between the two countries seems to be associated with substantial differences in access to care as well as substantial differences in social and economic inequality. Yet distinguishing among the potential explanations for the differences in health between the two countries would require longitudinal data. Perhaps it is time for Canada and the US to contemplate a joint longitudinal survey."
Interesting3: Kallak Torvstrøfabrikk in Trøgstad in eastern Norway has developed a peat moss mixture with unusually good absorbent qualities. The material could be a useful tool for clearing up oil-spills after minor incidents or major catastrophes. The three-man company has traditionally sold treated peat moss as a component of soil for flowering plants and as growth medium.
But realizing that the peat moss is a remarkably good absorbent, they began to find other potential uses for it. SINTEF "Expertise broker" Leif Estensen connects researchers with companies that lack research and development experience. Three years ago, he brought Kallak and SINTEF together. An expertise broking project was set up with scientists from SINTEF’s Marine Environmental Technology department, with the aim of testing different types of peat moss and documenting their properties.
The conclusions drawn from the testing program were quite clear: the peat moss had excellent potential, as since its ability to take up oil was as good as, or in some cases even considerably better than, other products already available on the market. Used in the "Full City" incident In the summer of 2009, the Panama-registered "Full City" ran aground off Langesund on the south-east coast of Norway, causing severe oil contamination along much of the coast.
This incident gave Kallak Torvstrøfabrikk the chance to demonstrate the efficacy of its new product on land. Svein Ramstad of SINTEF’s Marine Environment department says that the peat moss was deployed on a geological conservation area near Langesund and at Stavern. The area was heavily contaminated, and particular care needed to be taken. Gravel and stones were mixed with the peat moss and were laid back in their original position, to good effect.
Further activities Kallak Torvstrøfabrikk has recently developed a series of other products based on its peat-moss absorbent material, such as three meter-long "sausages" and buckets of peat moss, which the fire brigade and operators of heavy machinery can use in the event of spills of oil, diesel fuel or other environmentally hazardous liquids.
The peat moss mixtures have been laboratory tested on various types of crude oil and bunkers oil. In 2008, the little company won an industrial research and development contract with Veolia Miljø for product development and commercialization, and it is now looking at potential sales elsewhere in Europe.
Interesting4: An icy asteroid orbiting the sun between Mars and Saturn is adding credence to theories that Earth’s water was delivered from space, according to a report published in the new issue of the science journal Nature. Two teams of scientists found their evidence when looking at 24 Themis, a asteroid about 479 million kilometers (300 million miles) from the sun, or roughly three times the average distance from Earth to the sun.
Using the infrared telescope at Mauna Kea, Hawaii, they were surprised to find not only water on 24 Themis, but organic compounds as well. Asteroids were thought to be devoid of water because they sit too close to the sun, while comets have been the water bearers of the universe because they form farther out in space.
"Astronomers have looked at dozens of asteroids with this technique, but this is the first time we’ve seen ice on the surface and organics," astronomer Andrew Rivkin of the Johns Hopkins University Applied Physics Laboratory in Laurel, Maryland, told Nature.com. The scientific teams from Johns Hopkins and the University of Central Florida that looked at 24 Themis speculate that the ice may be held in a reservoir under the asteroid’s surface.
They speculate that the water is brought to the surface as small bodies in the asteroid belt hit the surface of 24 Themis. The findings on 24 Themis lend weight to the idea that asteroids and comets are the source of Earth’s water and organic material. Geochemists believe that early Earth went through a molten phase that would have removed any organic molecules, meaning any new organic material would have had to come to the planet at a later time, said Humberto Campins at UCF.
"I believe our findings are linked to the origin of life on Earth," he added. Scientists now plan to scan the asteroid belt for more evidence of water and organic materials, hoping to determine if 24 Themis is just an interloper — possibly a comet that got caught in the asteroid belt — or the first of many water-bearing asteroids that will change the way astronomers look at the solar system. "The old-fashioned picture of the solar system in which asteroids are asteroids and comets are comets is getting harder to sustain," Rivkin said.