


Air Temperatures – The following maximum temperatures were recorded across the state of Hawaii Monday:
Lihue, Kauai – 84
Honolulu airport, Oahu – 85
Kaneohe, Oahu – 77
Molokai airport – mm
Kahului airport, Maui – 90 (Record high temperature for Monday: 91 – 1961)
Kona airport – 83
Hilo airport, Hawaii – 81
Air Temperatures ranged between these warmest and coolest spots near sea level – and on the highest mountain tops…as of 5pm Monday evening:
Barking Sands, Kauai – 85
Kailua-kona – 72
Haleakala Crater – 39 (near 10,000 feet on Maui)
Mauna Kea summit – 27 (over 13,500 feet on the Big Island)
Precipitation Totals – The following numbers represent the largest precipitation totals Monday afternoon:
5.18 Mount Waialeale, Kauai
2.90 Oahu Forest NWR, Oahu
0.02 Molokai
0.02 Lanai
0.01 Kahoolawe
1.23 Hana airport, Maui
1.58 Saddle Quarry, Big Island
Marine Winds – Here’s the latest (automatically updated) weather map showing a 1034 millibar high pressure system to the northeast of the Hawaiian Islands. At the same time we find a trough of low pressure to the west of our western islands in the chai. Our local trade winds will continue to be moderately strong…although stronger locally at times through Wednesday.
Satellite and Radar Images: To view the cloud conditions we have here in Hawaii, please use the following satellite links, starting off with this Infrared Satellite Image of the islands to see all the clouds around during the day and night. This next image is one that gives close images of the islands only during the daytime hours, and is referred to as a Close-up visible image. This next image shows a larger view of the Pacific…giving perspective to the wider ranging cloud patterns in the Pacific Ocean. Finally, here's a Looping IR satellite image, making viewable the clouds around the islands 24 hours a day. To help you keep track of where any showers may be around the islands, here’s the latest animated radar image.
Hawaii’s Mountains – Here’s a link to the live web cam on the summit of near 13,500 foot Mauna Kea on the Big Island of Hawaii. The tallest peak on the island of Maui is the Haleakala Crater, which is near 10,000 feet in elevation. These two web cams are available during the daylight hours here in the islands…and when there’s a big moon shining down during the night at times. Plus, during the nights you will be able to see stars, and the sunrise and sunset too…depending upon weather conditions.
Tropical Cyclone activity in the eastern and central Pacific – Here’s the latest weather information coming out of the National Hurricane Center, covering the eastern north Pacific. You can find the latest tropical cyclone information for the central north Pacific (where Hawaii is located) by clicking on this link to the Central Pacific Hurricane Center. Here’s a tracking map covering both the eastern and central Pacific Ocean. A satellite image, which shows the entire ocean area between Hawaii and the Mexican coast…can be found here. Of course, as we know, our hurricane season ended November 30th here in the central Pacific…and begins again June 1st.
Aloha Paragraphs
An unstable atmosphere will keep showers, some
heavy…with a few thunderstorms in the forecast.
Our winds will be moderately strong…picking up Tuesday onwards. Glancing at this weather map, we find a moderately strong 1034 millibar high pressure system located to the northeast of the Hawaiian Islands. An upper level trough of low pressure over the state will stick around a little while longer. As the trough moves away, our trade wind speeds will increase, starting Tuesday into Wednesday…through the remainder of the week. As the trade winds pick up over the next couple of days, we'll see a small craft wind advisory going up around Maui County and the Big Island.
Our local winds will blow from the east to southeast…the following numbers represent the strongest gusts, along with directions Monday evening:
25 mph Port Allen, Kauai – ESE
23 Kahuku, Oahu – NE
04 Molokai
28 Kahoolawe – ESE
27 Lipoa, Maui –SE
08 Lanai Airport – WSW
38 South Point, Big Island – NE
We can use the following links to see what’s going on in our area of the north central Pacific Ocean Monday night. Looking at this NOAA satellite picture we see variable clouds over the ocean around the islands, having moved ashore over the islands of Oahu, Maui County and the Big Island. There are a mix of lower cumulus clouds…along with towering cumulus, and thunderstorms too. We can use this looping satellite image to see a stream of high and middle level clouds to our south…curling up to the east of the Big Island. At the same time we find an counterclockwise swirling upper low pressure to the east of the state as well. This area of cold air associated with the low pressure system, will keep a vertical motion to our local cumulus clouds…with a continued chance of heavy showers during the next 24 hours or so. Checking out this looping radar image shows some heavy showers falling over the ocean, some of which are focusing their efforts over the islands too.
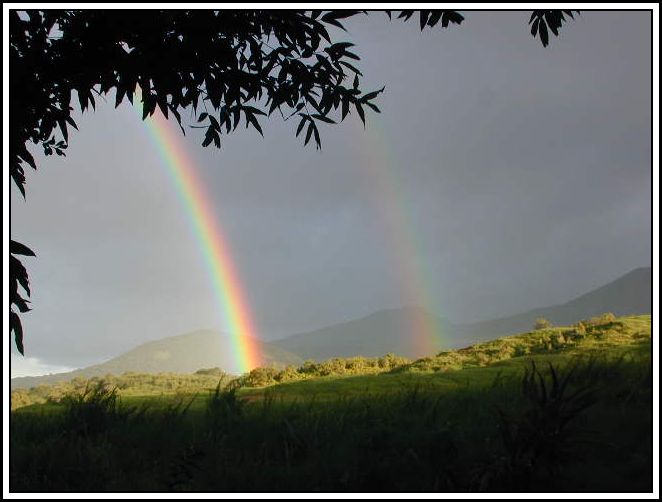
Sunset Commentary: Here in Kihei, Maui at around 530pm Monday evening, skies were partly to mostly cloudy. I want to keep this looping radar image handy, so we can easily check out the locally heavy showers falling over and around the islands. The air mass over and around the islands remains unstable, which is what's keeping it shower prone. The daytime heating of the islands have once again triggered more showers over the islands. This threat of showers and even heavy showers or thunderstorms will remain in place through Tuesday. As we move into Wednesday, the air mass will become less shower prone.
Monday was a very interesting day from a weather perspective! The day started off in a fairly mild mannered way, although became more and more unstable, especially from Oahu down through the Big Island. Cumulus clouds grew into towering cumulus, which quickly became thunderstorms. Here in Kihei, despite being inside a building, I could hear thunder outside off and on through the afternoon. I got two reports of hail falling, one in Olinda, and another in Kula. You can go to the bottom of this page, in the comments section, and see two youtube video's of this unusual hail event in Kula…thanks to TMS for providing these video's for us.
I'm about ready to take the drive back upcountry, although likely have missed most of the action up that way. It still looks very dark and threatening up there, although I can see the top of the Haleakala Crater from down here in Kula. The air temperature up there was a chilly 39F degrees at around 5pm. Meanwhile, the top of the Mauna Kea summit on the Big Island, where there has been off and on snow flurries, the temperature was 27 degrees at the same time. This verifies why our atmosphere is so unstable now, with warm air near the surface, bubbling up into the colder air aloft. These are the ingredients for thunderstorms. I'll be back either later with more, or most certainly early Tuesday morning, with your next new weather narrative. I hope you have a great Monday night until then! Aloha for now…Glenn.
Interesting: Humans are pushing sea turtles to the brink of extinction by entangling them in fishing gear, tossing plastic garbage into their habitats, and building resorts on prime nesting beaches, among other affronts. That's the going hypothesis, anyway. But a new study suggests that our transgressions are peanuts compared to natural oceanic cycles, at least for loggerheads.
The findings don't let people off the hook, the authors say, but they do provide new insight into the ways climate can shape turtle populations. Loggerheads lay their eggs on subtropical beaches around the world. After hatching, baby sea turtles head out to sea where they spend years maturing. When females reach breeding age—25 to 35 years old for loggerheads—they clamber ashore to lay eggs on the beach.
Nest counts are the main source of demographic data for sea turtles, but it's hard to estimate population size from these counts. Between the mid-1990s and 2006, loggerhead nests in Florida—one of the species' nesting epicenters—declined from roughly 55,000 per year to around 30,000. That drop and declines elsewhere prompted U.S. federal agencies to propose upgrading most loggerheads from threatened to endangered under the Endangered Species Act.
Numerous studies have shown that fishing bycatch kills an alarming number of sea turtles each year, and the threats posed by many other human activities are well documented. But ecologists Kyle Van Houtan of the National Oceanic and Atmospheric Administration's Pacific Islands Fisheries Science Center in Honolulu and John Halley of the University of Ioannina in Greece wondered if other factors were also at work.
In the new study, published online this week in PLoS ONE, the duo measured the effect of certain ocean conditions on loggerhead nesting, using nest count data from Japan and Florida stretching back as far as the 1950s. Specifically, they looked at two long-term warming and cooling cycles whose effect on sea turtles hadn't been investigated, one in the Pacific where Japanese turtles spend their formative years, and another in the Atlantic, where young Floridian turtles live.
They also looked at recent ocean conditions, in particular the temperature of the sea surface near Japan and Florida the winter before a given breeding season. Such conditions have been shown to influence whether females are robust enough to make the long migration to shore and produce hundreds of eggs. Using mathematical models, Van Houtan and Halley found a strong correlation between the nest counts in a given year and the state of the long-term oceanic cycles some 3 decades earlier.
That's when most nesting females would have been in their first year of life, the researchers say. Van Houtan and Halley think the two oceanic cycles—the Pacific Decadal Oscillation (PDO) and the Atlantic Multidecadal Oscillation (AMO)—can make or break a young turtle's survival; favorable cycles bring food and good weather, for example. The number of survivors seems to strongly affect the number of nests.
Interesting2: Researchers from Woods Hole Oceanographic Institution (WHOI) and their colleagues have discovered that massive, swirling ocean eddies — known to be up to 500 kilometers across at the surface — can reach all the way to the ocean bottom at mid-ocean ridges, some 2,500 meters deep, transporting tiny sea creatures, chemicals, and heat from hydrothermal vents over large distances. The previously unknown deep-sea phenomenon, reported in the April 28 issue of the journal Science, helps explain how some larvae travel huge distances from one vent area to another, said Diane K. Adams, lead author at WHOI and now at the National Institutes of Health.
"We knew these eddies existed," said Adams, a biologist. "But nobody realized they can affect processes on the bottom of the ocean. Previous studies had looked at the upper ocean." Using deep-sea moorings, current meters and sediment traps over a six-month period, along with computer models, Adams and her colleagues studied the eddies at the underwater mountain range known as the East Pacific Rise.
That site experienced a well-documented eruption in 2006 that led to a discovery reported last year that larvae from as far away as 350 km somehow traveled that distance to settle in the aftermath of the eruption. The newly discovered depth of the powerful eddies helps explain that phenomenon but also opens up a host of other scientific possibilities in oceans around the world.
"This atmospherically generated mechanism is affecting the deep sea and how larvae, chemical and heat are transported over large distances," Adams said. The eddies are generated at the surface by atmospheric events, such as wind jets, which can be strengthened during an El Niño, and "are known to have a strong influence on surface ocean dynamics and production," say Adams and Dennis J. McGillicuddy from WHOI, along with colleagues from Florida State University, Lamont Doherty Earth Observatory, and the University of Brest in France.
But this "atmospheric forcing…is typically not considered in studies of the deep sea," they report. Moreover, the eddies appear to form seasonally, suggesting repeated interactions with undersea ridges such as the Eastern Pacific Rise. The models "predict a train of eddies across the ocean," Adams said. "There may be two to three eddies per year at this location," Adams said.
Each one, she says, "could connect the site of the eruption to other sites hundreds of miles away." Elsewhere, she adds, "there are numerous places around the globe where they could be interacting with the deep sea." In her 2010 report on larvae traveling great distances to settle at the eruption site, WHOI Senior Scientist Lauren S. Mullineaux , along with Adams and others, suggested the larvae traveled along something like an undersea superhighway, ocean-bottom "jets" travelling up to 10 centimeters a second.
But conceding that even those would not be enough to carry the larvae all that distance in such a short time, the researchers speculated that large eddies may be propelling the migrating larvae even faster. Adams's current work follows up on that possibility. "The mechanism we found helps explain what we saw in the first paper," Adams said. It is the larger picture, over longer periods of time, however, that Adams and her colleagues find particularly intriguing.
"Transport [of ocean products] could occur wherever…eddies interact with ridges — including the Mid-Atlantic Ridge, the Southwest Indian Ridge, and the East Scotia Ridge — and the surrounding deep ocean," the researchers say. And because the eddies appear to form repeatedly, the high-speed, long-distance transport can last for months.
"Although the deep sea and hydrothermal vents in particular are often naively thought of as being isolated from the surface ocean and atmosphere, the interaction of the surface-generated eddies with the deep sea offers a conduit for seasonality and longer-period atmospheric phenomena to influence the 'seasonless' deep sea," Adams and her colleagues write. "Thus, although hydrothermal sources of heat, chemical and larval fluxes do not exhibit seasonality there is potential for long-distance transport and dispersal to have seasonal to interannual variability."
Interesting3: This finding will leave you breathless. A physiology professor at the University of Milan concluded that four men running, walking and riding bicycles emit more carbon dioxide than hybrid cars. He also compared it to gas and diesel cars, which beat the men in terms of carbon emissions. Of course the research carried out by Alberto E. Minetti is just illustrative of how clean hybrid cars have become.
As one commentator questioned in the Scientific American, where the original article appeared, "does the carbon dioxide total with each vehicle used include the CO2 released by the four men sitting at rest within the vehicle? From the earth's point of view, it should." Nor did the study take into account the C02 produced during the manufacturing of the car. But then, we could also factor in the food consumed by the runners in order to get the energy to do all this running.
Or, as Dvice notes, cars can be turned off and temporarily stop emitting carbons, while humans can't. As Dvice also highlights, the point of the comparison is to show that vehicles running on green technology have come a long way and are definitely leaving a lighter footprint on the planet. That's good news. And you can start breathing again…
Interesting4: The outbreak of tornadoes that ravaged the southern US last week was the largest in US recorded history, the National Weather Service has said. The three-day period from 25-28 April saw 362 tornadoes strike, including some 312 in a single 24-hour period. The previous record was 148 in two days in April 1974. The tornadoes and the storm system that spawned them killed at least 350 people in Alabama and six other states.
It was the deadliest outbreak since 1936. The review by US meteorologists came as the southern US states of Mississippi, Alabama, Georgia, Tennessee, Virginia, Louisiana and Kentucky continued the huge task of digging out from the destruction. In Tuscaloosa, Alabama, a university town that was the worst-hit single location, officials estimated debris removal alone would cost $70m to $100m.
The storm tore down century-old trees, flattened farm buildings and downed power lines, leaving as many as one million people without electricity in Alabama alone. On Monday, more than 400,000 people still had no power in that state, emergency officials said.
The most destructive tornado struck Tuscaloosa, killing at least 65 people between there and the city of Birmingham, the National Weather Service said in a statement. That was the deadliest single tornado since 1955, when a twister in Kansas killed 80. Storm scientists say that tornado had a maximum width of 1.5 miles and a track 80 miles long.
Cheryl Phillipson Says:
Hi Glen, what a lightning show we had here in Kailua & Kaneohe!! pretty much constant for a few hours, now tapering off, and moving NW…~~~Hi Cheryl, thanks for the report! There was an impressive water spout on the other side of your island too. Wild weather, very interesting. Aloha, Glenn
TMS Says:
Glenn:
Can!
http://www.youtube.com/watch?v=KrO5c6RyYDQ
http://www.youtube.com/watch?v=ZZUl61TWznQ
The hail has stopped but we just had a couple of huge lightning strikes which occurred less than 1 second before the accompanying thunder….almost directly overhead. Wow.~~~Excellent, will make these available for everyone, thanks so much! Aloha, Glenn
TMS Says:
Hey Glenn,
I live around the corner from you in Kula. It is 15:30 on Monday and we are having a WICKED hailstorm. The hailstones are about half the size of an edamame bean.
I got some great video and some photos. If you want them for your web site, ee me privately and I'll send them to you.
TMS~~~Hi TMS, wow, why couldn’t that have happened when I was home yesterday!? Thanks for letting us know, I could show a youtube video if it was in that form…could? Aloha, Glenn
Amy Says:
Glenn,
My husband and I are coming to Maui for the first time May 7-14. We are staying in Lahaina and I have been trying to find accurate weather info for that area. I have looked at Weatherchannel.com and accuweather.com and now have found your website. I have noticed that it seems to be rainy/cloudy the week we are to arrive. When there is a 30% chance of showers is that for the whole island or just a particular area? Does that mean it will be raining all day or are they usually quick showers? I am trying to plan our activities for the week and I wasn't expecting such a wet forecast! Please provide me with as much info as you can so we can plan accordingly.
Mahalo!~~Amy, I understand your concern. You have fortunately picked one of the driest parts of Maui, so that works in your favor. I honestly don’t know exactly what the weather will be like during your vacation, as that is still too far out into the future. However, I would say that you should pack for sunny weather, with daytime high temperatures in the middle 80’s, with generally warm nights around 72 degrees. I wouldn’t worry at all to tell you the truth. Best of luck, Aloha, Glenn
Jerry Smallwood Says:
Aloha Glenn – As always, I really appreciate your salient and comprehensive website! I've a question: I noticed that the radiation warning has been dropped from the weather map. Does this mean that the radiation leakage has been abated?
Thanks!
Jerry~~~Hi Jerry, good eye, it was on the map yesterday. I don’t know for sure, although I’d assume, as you thought, that this is the case. Lets hope so. Aloha, Glenn