


August 9-10, 2009
Air Temperatures – The following maximum temperatures were recorded across the state of Hawaii Sunday afternoon:
Lihue, Kauai – 83
Honolulu, Oahu – 90
Kaneohe, Oahu – 85
Kahului, Maui – 86
Hilo, Hawaii – 80
Kailua-kona – 89
Air Temperatures ranged between these warmest and coolest spots near sea level – and on the highest mountains…at 4 p.m. Sunday afternoon:
Honolulu, Oahu – 87F
Princeville, Kauai – 79
Haleakala Crater – 57 (near 10,000 feet on Maui)
Mauna Kea summit – 64 (near 14,000 feet on the Big Island)
Precipitation Totals – The following numbers represent the largest precipitation totals (inches) during the last 24 hours on each of the major islands, as of Sunday afternoon:
1.00 Mount Waialaele, Kauai
0.56 Oahu Forest NWR, Oahu
0.01 Molokai
0.00 Lanai
0.00 Kahoolawe
0.54 West Wailuaiki, Maui
0.27 Mountain View, Big Island
Marine Winds – Here’s the latest (automatically updated) weather map showing two 1028 millibar high pressure systems to the north and northeast of the islands. These high pressure cells, along with their associated ridges to our north, will keep the trade winds blowing Sunday into Monday. Winds will become stronger and gusty late Monday into Tuesday…as Felicia moves through the central part of the Hawaiian Islands.
Satellite and Radar Images: To view the cloud conditions we have here in Hawaii, please use the following satellite links, starting off with this Infrared Satellite Image of the islands to see all the clouds around the state during the day and night. This next image is one that gives close images of the islands only during the daytime hours, and is referred to as a Close-up visible image. This next image shows a larger view of the Pacific…giving perspective to the wider ranging cloud patterns in the Pacific Ocean. Finally, here’s a Looping IR satellite image, making viewable the clouds around the islands 24 hours a day. To help you keep track of where any showers may be around the islands, here’s the latest animated radar image.
Hawaii’s Mountains – Here’s a link to the live webcam on the summit of near 14,000 foot Mauna Kea on the Big Island of Hawaii. The tallest peak on the island of Maui is the Haleakala Crater, which is near 10,000 feet in elevation. These two webcams are available during the daylight hours here in the islands…and when there’s a big moon rising just after sunset for an hour or two! Plus, during the nights and early mornings you will be able to see stars, and the sunrise too…depending upon weather conditions.
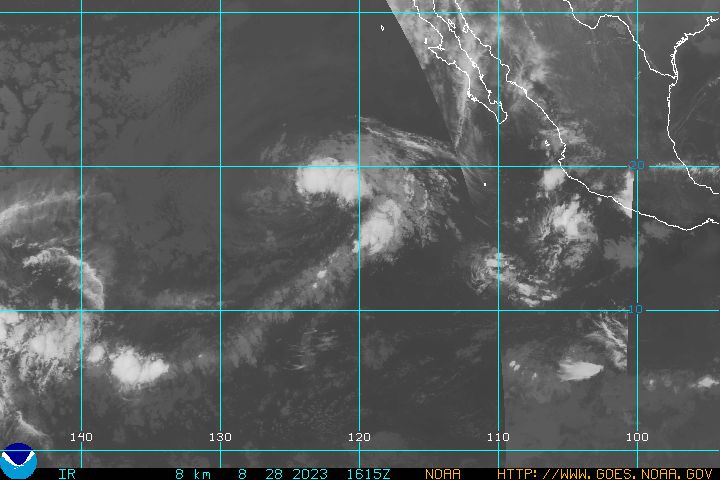
Tropical Cyclone activity in the eastern and central Pacific – Here’s the latest weather information coming out of the National Hurricane Center, covering the eastern north Pacific. You can find the latest tropical cyclone information for the central north Pacific (where Hawaii is located) by clicking on this link to the Central Pacific Hurricane Center. Here’s a tracking map covering both the eastern and central Pacific Ocean. A satellite image, which shows the entire ocean area between Hawaii and the Mexican coast…can be found here.
Aloha Paragraphs


Tropical storm Felicia approaches from the east
Generally nice conditions will prevail Sunday night into Monday morning, giving way to blustery weather later Monday into Tuesday…with improving conditions Wednesday. The Central Pacific Hurricane Center (CPHC) is keeping the tropical storm watch over the state of Hawaii in effect Sunday night, which includes the area from the Kauai Channel, across Oahu down through Maui County…to the Big Island. Meanwhile, tropical storm warnings remain in effect over the offshore waters around the islands. Tropical storm force winds are 39 to 73 mph.
Skies will be clear to partly cloudy Sunday night, with those usual cloudy periods…and a few showers. When tropical cyclone Felicia pushes towards the state of Hawaii during the day Monday into the night…we will see increasingly heavy rains arrive around the Big Island and Maui. As the storm moves closer, the other islands will get wet into Tuesday. Once this rainy weather moves west past the state later Tuesday and on Wednesday, we’ll return to favorably inclined trade wind weather conditions statewide through the rest of the week.
Note: The NWS has a Flash Flood Watch active for the islands of Oahu, Maui County, and the Big Island starting Monday morning through Tuesday afternoon. This means that…quoting the NWS: "ABUNDANT MOISTURE ASSOCIATED WITH FELICIA IS EXPECTED TO PRODUCE EXTREMELY HEAVY RAINFALL WITH THE POTENTIAL FOR WIDESPREAD FLASH FLOODING INCREASING ON MONDAY AND CONTINUING INTO TUESDAY."
Note: The NWS office in Honolulu continues its Flood Potential Outlook for Kauai and Niihau. There is the potential for heavy rains and flash flooding Monday night through Wednesday on those two islands. The NWS disclaimer reads: "AT THIS POINT…THERE IS CONSIDERABLE UNCERTAINTY IN THE LOCATIONS THAT WILL BE AFFECTED…THE ONSET…AND DURATION OF HEAVY RAINS…AS WELL AS THE RAINFALL AMOUNTS THAT ARE EXPECTED TO OCCUR. ALL OF THESE ARE DEPENDENT ON THE TRACK FELICIA ULTIMATELY TAKES."
Felicia continues moving across the central Pacific towards Hawaii…as a weakening tropical storm. The latest CPHC forecast now shows that Felicia will be a tropical storm, as it moves through the central part of the island chain over the next two days. Here’s a tracking map, showing the center of Felicia moving over the island of Oahu, and then onwards just south of Kauai Tuesday morning…into the afternoon hours. Here’s a satellite image showing this weakening tropical storm in relation to the Hawaiian Islands. At approximately 8pm Sunday evening, the center of TS Felicia was 435 miles east-northeast of Hilo, Hawaii.
The latest sustained wind measurements with tropical storm Felicia at 8pm Sunday evening, showed 45 knots of sustained winds, which translates into 52 mph…with gusts to near 63 mph near the center. This tropical storm is expected to gradually weaken throughout the rest of its life cycle…although remaining a lower end tropical storm as it moves into the state of Hawaii…at least that’s the latest snap shot of its expectations. Again, tropical storm force winds are 39-73 mph, while tropical depression winds are 39 mph or lower. By the way, here’s a sea water temperature map showing the ocean to the east of the islands.
If the current Central Pacific Hurricane Center (CPHC) forecast holds true, with a tropical storm moving over the central islands…we would see the following influences. We’ve already seen the first signs of the storm along the east facing shores of the Big Island and Maui, where rising high surf has arrived…which could bring dangerously large breaking waves to our beaches Monday and Tuesday. As Felicia gets closer, we will see blustery weather, with gusty winds being enhanced where physical terrain features accelerate the flow Monday into Tuesday. Finally, when this tropical storm moves into the state…we’ll see increasing clouds, and heavy flooding rainfall during the day Monday into Tuesday as well. It’s difficult to gauge exactly how much precipitation that we might receive ahead of time, but an estimate might be 3-6 inches, with higher amounts towards 8-10"+…in those most wet mountain locations. Flash flooding is a definite threat across the entire island chain.
Note: In terms of high surf, the NWS forecast office in Honolulu has issued a High Surf Warning, which started at 6pm Sunday evening…for the east facing shores of Maui and the Big Island. This dangerously high surf is expected to continue pounding those shores into Tuesday. The other islands in the chain will see rising surf as well, becoming larger on Monday.
It’s early Sunday evening here in Kula, Maui, as I begin writing this last part of today’s narrative. If you had a chance to read down through this entire page, you know that gradually weakening tropical storm Felica is heading towards our Hawaiian Islands. The gradual weakening of Felicia is being caused by the stronger winds at upper levels of the atmosphere. These are conditions that typically inhibit further strengthening of a storm…and almost always cause further weakening.
~~~ Tropical storm Felicia seems to be holding her own, in terms of strength. The shearing upper winds have begun to do their work, although there’s still a considerable amount of thunderstorm activity to the northeast of the center. Here’s a looping satellite image of Felicia moving towards the islands, so you can see what I mean.
There should continue to be a very gradual diminishment of this storm’s strength as it nears Hawaii. This weakening doesn’t mean that we won’t be seeing blustery winds and heavy rains however, which are still forecast to bring inclement weather conditions to our islands starting Monday. It would be wise to keep a close eye on this storm as it spins closer in our direction. Speaking of a close eye, here’s a good satellite image of Felicia and the Hawaiian Islands.
~~~ Just as an aside, a new tropical depression called 9E has spun up in the eastern Pacific Ocean Sunday. I’d recommend that we don’t worry about, what will likely become tropical storm Guillermo. We have enough to handle with Felicia at the moment…wouldn’t you agree! At any rate, here’s the NHC tracking map for this newly formed system. While we’re looking at new stuff, here’s the satellite photo of 9E.
~~~ I’ll be working into the night Sunday from home here in Kula, Maui. This will allow me to continue bringing you the latest updates, and information as we head into what looks to be a couple of days of windy and wet weather starting Monday. I hope you have a great Sunday night from wherever you’re reading from! I’ll grab a couple of hours of sleep, and then rise again around 430am Monday, to begin preparing your next new weather narrative from paradise. Aloha for now…Glenn.
~~~ Oh my gosh…it’s a little after 815pm Sunday evening, and there have been 34,962 page impressions on this website today! There have been 931 clicks on the google ads here too. It’s a good thing that I worked on this website all day, as there are so many of you who are logging on…wanting to find out about tropical storm Felicia! Thanks by the way for your readership…and the clicks too! I just did a google search on the very generic subject: Hawaii Weather…and noticed that this website comes up #1 on that well used list…thanks to all of you who are coming here for your weather information!
Here’s another one of those funny video’s, this time about cats again.
Interesting: Scientists have placed high-tech "spiders" inside and around the mouth of Mount St. Helens, one of the most active volcanoes in the United States. Networks such as these could one day be used to respond rapidly to an impending eruption. On July 14, 2009, these spider pods were lowered by cable from a helicopter hovering about 100 feet up and gently put in hot spots inside and around the volcano crater.
"This project demonstrates that a low-cost sensor network system can support real-time monitoring in extremely challenging environments," said WenZhan Song of Washington State University Vancouver. Song is the principal investigator for this NASA-funded technology research project, which also draws on participation from the U.S. Geological Survey and from NASA’s Jet Propulsion Laboratory, Pasadena, Calif.
These robotic emissaries were built to go where no human can and operate in extreme temperatures and treacherous terrain. Fifteen pods form a virtual wireless network, communicating with each other and the Earth Observing-1 (EO-1) satellite, operated by NASA’s Goddard Space Flight Center, in Greenbelt, Md.
"Taking data from the ground onsite and from above by satellite gives you a great picture of what is going on inside the volcano," said Steve Chien, principal scientist for autonomous systems at JPL. Each pod contains a seismometer to detect earthquakes; a GPS receiver to pinpoint the exact location and measure subtle ground deformation; an infrared sounder to sense volcanic explosions; and a lightning detector to search for ash cloud formation.
The main instrument box is the size and shape of a microwave oven. It sits on top of a three-legged tripod, which is why scientists call them spiders. The pods are powered by batteries that can last for at least a year. "With these high-tech instruments, we can rapidly respond during periods of volcanic unrest to supplement our permanent monitoring network or quickly replace damaged stations without excessive exposure to personnel," said Rick LaHusen, an instrumentation engineer with the U.S. Geological Survey’s Cascades Volcano Observatory, Vancouver, Wash.
In 1980, a tremendous eruption at Mount St. Helens caused considerable loss of life and damage. More recently, in 2004, the volcano came back to life and erupted more than 26 billion gallons of lava, accompanied by a series of explosions that hurled rock and ash far from the vent.
If eruptions like these ever occur again, a sensor network could be quickly put in place to provide valuable real-time information to scientists and emergency services. This work is part of NASA’s plan to develop a sensor web to provide timely data and analyses for scientific research, natural hazard mitigation, and the exploration of other planets in this solar system and beyond.
"We hope this network will provide a blueprint for future networks to be installed on many of the world’s unmonitored active volcanoes, so educated and reliable estimates can be made when a town or a village needs to be evacuated to reduce the risk to life and property," said Project Manager Sharon Kedar of JPL.
Chien said, "Hostile environments like Mount St. Helens are proving grounds for future space missions, such as to Mars, where we may someday have similar sensor networks to track a meteor strike, dust storm or Mars quake, as a virtual scientist on the ground." Song said, "The design and deployment experiences will help us understand challenging environments and inspire new discoveries."
Interesting2: Scientists now know how a natural hydrocarbon emitted in large quantities by plants can be transformed into light-scattering aerosols that contribute to haze and influence climate. The finding will improve models of atmospheric chemistry and climate and may help explain puzzling field observations in some parts of the world, the researchers report. Worldwide, plants release more than 550 million metric tons of the hydrocarbon isoprene into the atmosphere each year.
But scientists have disagreed about the particular chain of chemical reactions that transform isoprene into haze-forming aerosols, says Fabien Paulot, an atmospheric chemist at the California Institute of Technology in Pasadena. Now, lab tests by Paulot and his colleagues, reported in the Aug. 7 Science, have identified a new class of substances long suspected to form as an intermediate in those reactions but never before seen.
The team created the chemicals, called dihydroxyepoxides, by placing isoprene and hydrogen peroxide in an 800-liter bag of unpolluted air and then illuminating the mix with ultraviolet light. The UV light stimulated chemical reactions, just as sunlight would, and the hydrogen peroxide served as a source of hydroxyl radicals — highly reactive compounds known as "the detergent of the atmosphere," Paulot says.
Isoprene and hydroxyl radicals reacted to form dihydroxyepoxides via two separate chemical processes. Because the resulting epoxides are highly soluble, they readily dissolve into droplets of moisture in the air to form organic-rich aerosols, Paulot says.
Interesting3: Harvard University scientists are predicting some forms of air pollution could increase significantly across the West as more of the region’s wild lands burn as a result of rising temperatures. Smoke from wildfires contains two main kinds of carbon particles: black soot, or elemental carbon, and lighter-colored particles, called organic carbon aerosols, which are a mix of chemicals.
"In large quantities, downwind of fires, organic carbon aerosols are hazardous," said senior research fellow Jennifer Logan, who led a study examining rising wildfire rates and the impact on air quality. "The particles irritate lung tissue and the chemicals they carry are toxic. But even at low concentrations, these aerosols may be dangerous. We don’t know. There is no known threshold where damage begins."
Interesting4: Three major glaciers in Alaska and Washington state have thinned and shrunk dramatically, clear signs of a warming climate, according to a study released Thursday by the U.S. Geological Survey. The three glaciers — Gulkana and Wolverine in Alaska and South Cascade in Washington — are considered benchmarks for those in alpine and maritime climates because they closely parallel other glaciers in their regions.
They have also been the subject of close scientific scrutiny since 1957. "These are the three glaciers in North America that have the longest record of mass change," said Shad O’Neel, a United States Geological Survey glaciologist in Anchorage who was one of the study authors.
"All three of them have a different climate from the other two, yet all three are showing a similar pattern of behavior, and that behavior is mass loss." Scientists are keeping a close watch on melting glaciers, as a rise in sea-levels would threaten coastal and low-lying areas around the world.
The latest study compares records of snow and ice thickness and densities over the years, the factors used to calculate mass. The glaciers have lost mass as melting outpaced new snow and ice accumulation, and for all three, the losses were especially dramatic over the past 15 years, according to the USGS study.