











Glenn James
Hawaii Weather Today
Creator, Author, and Administrator for over 30+ years
The latest update to this website was at 633am Monday morning HST
Here are the latest 24-hour precipitation totals (inches) for each of the islands Monday morning:
0.29 Kilohana, Kauai
0.04 Kaala, Oahu
0.10 Puu Alii, Molokai
0.05 Lanai City, Lanai
0.48 Kahakuloa, Maui
0.75 Laupahoehoe, Big Island
The following numbers represent the strongest wind gusts (mph) Monday morning:
30 Barking Sands, Kauai – NNE
27 Kuaokala, Oahu – NE
20 Molokai AP, Molokai – NE
25 Lanai 1, Lanai – NE
23 Kealia Pond, Maui – NE
23 Kealakomo, Big Island – NE
Hawaii’s Mountains – Here’s a link to the live webcam on the summit of our tallest mountain Mauna Kea (~13,800 feet high) on the Big Island of Hawaii. Here’s the webcam for the (~10,023 feet high) Haleakala Crater on Maui. These webcams are available during the daylight hours here in the islands, and at night whenever there’s a big moon shining down. Also, at night you will be able to see the stars, and the sunrise and sunset too…depending upon weather conditions.
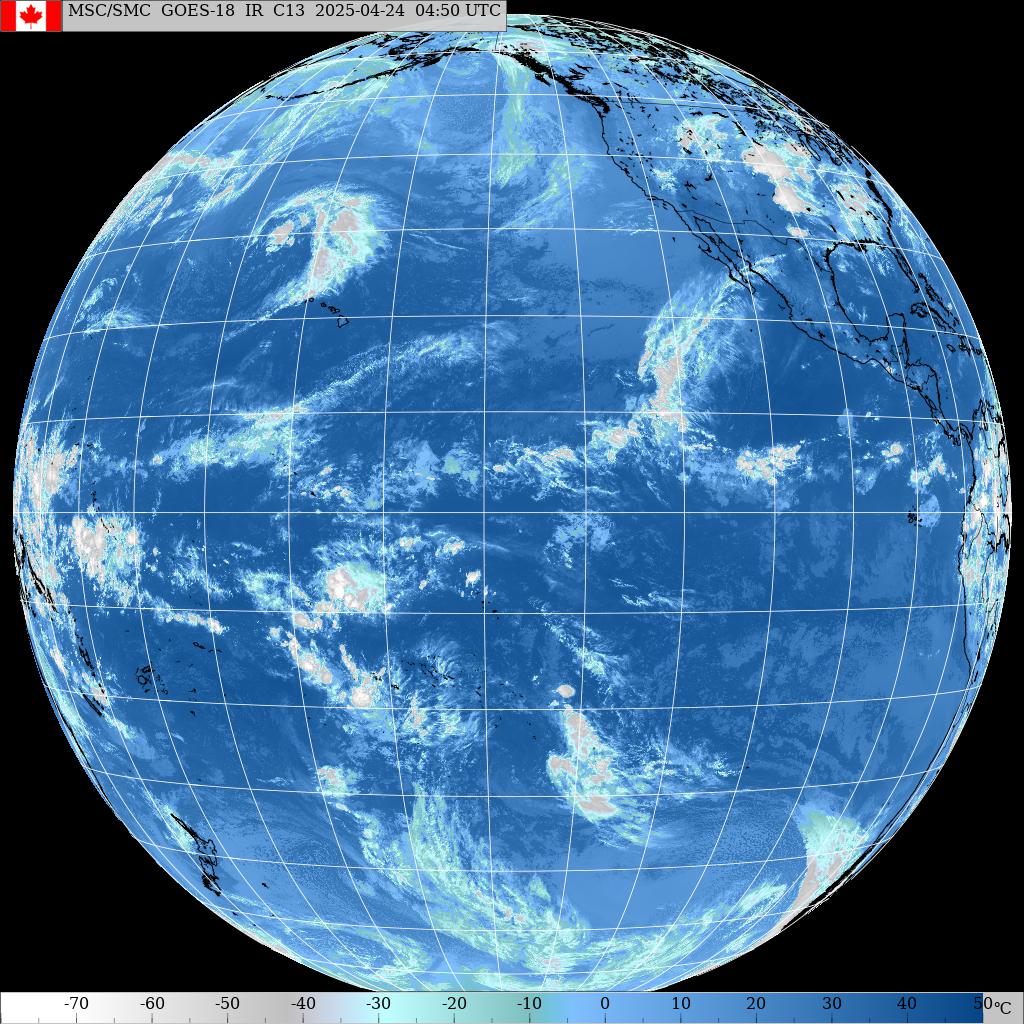
Big Blue…click twice for largest version

Upper level low far northeast…Tropical Depression Olana far southwest of Hawaii…thunderstorms in the deeper tropics

High clouds over parts of the state…low clouds locally
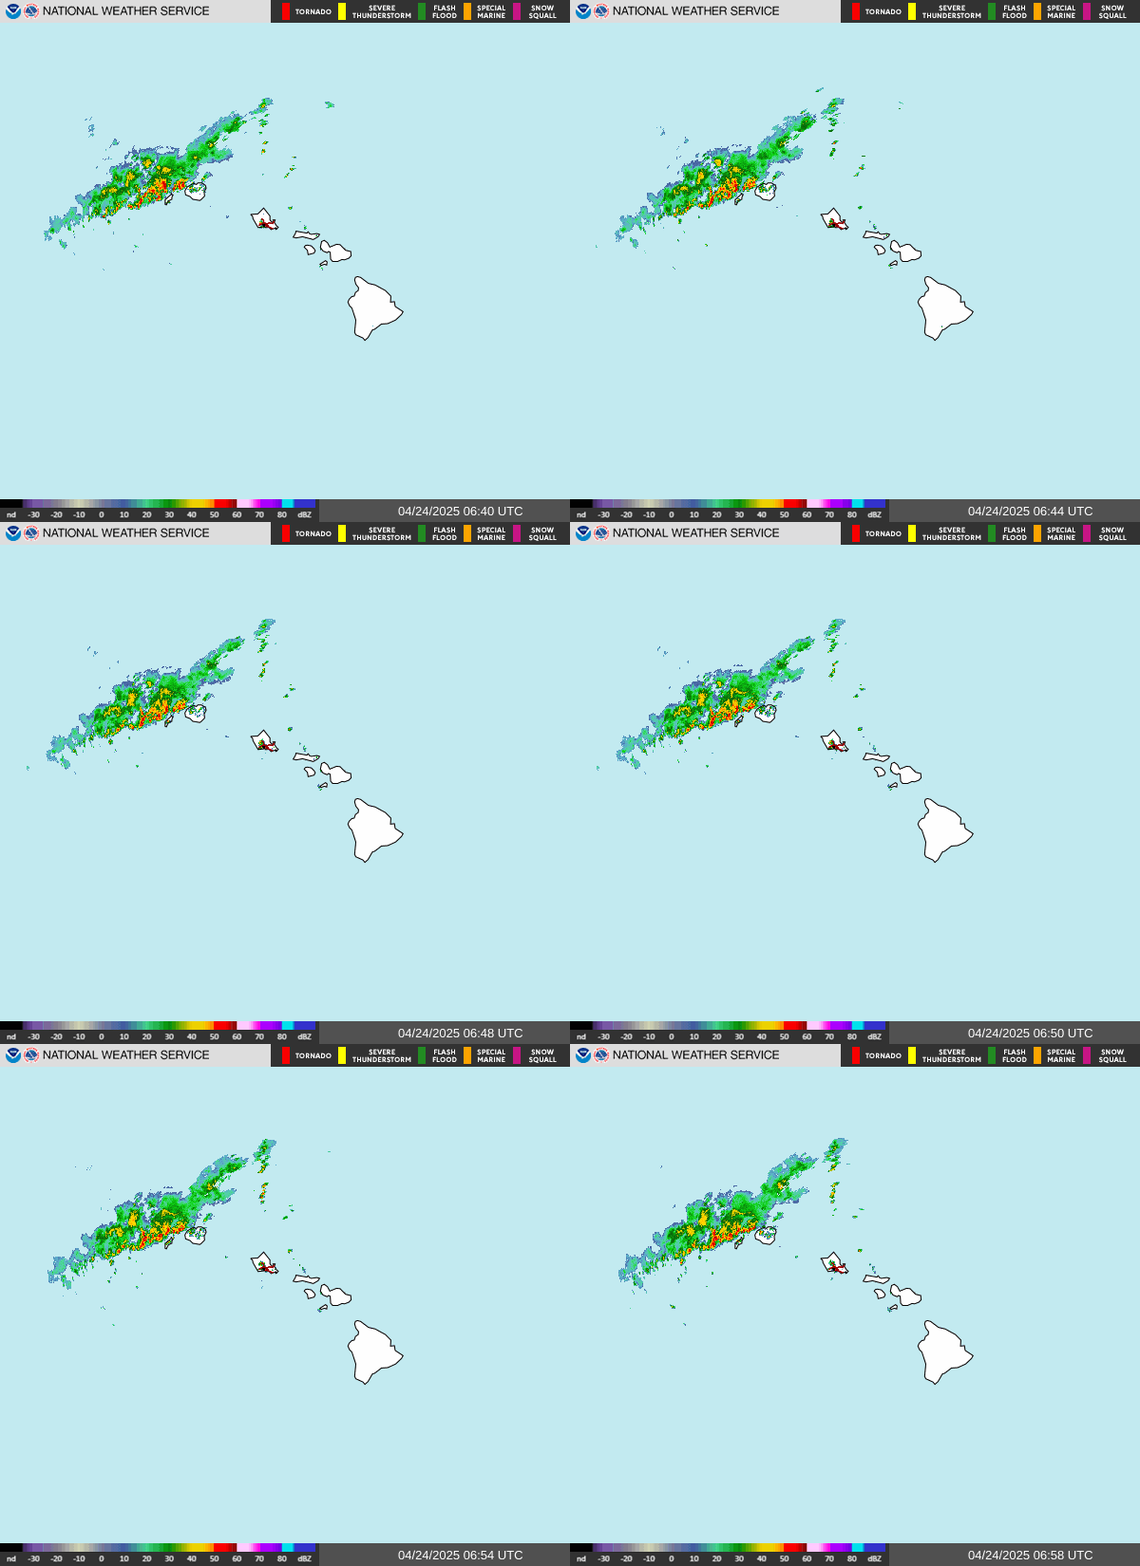
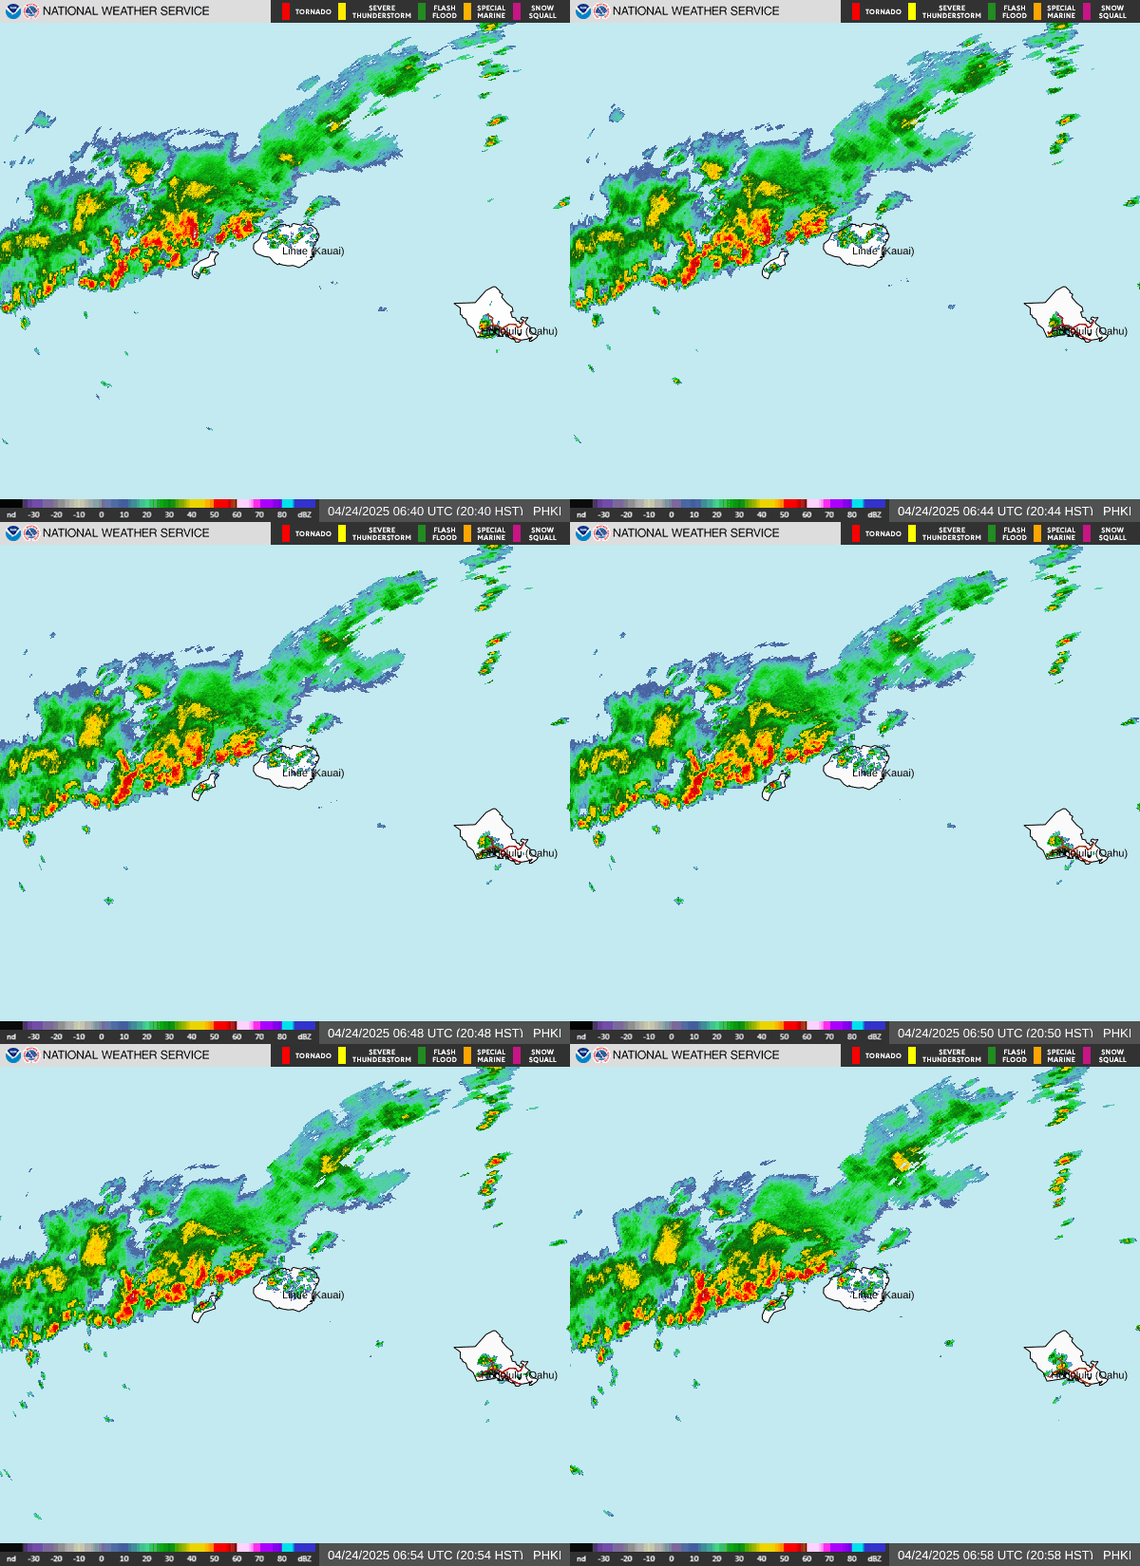
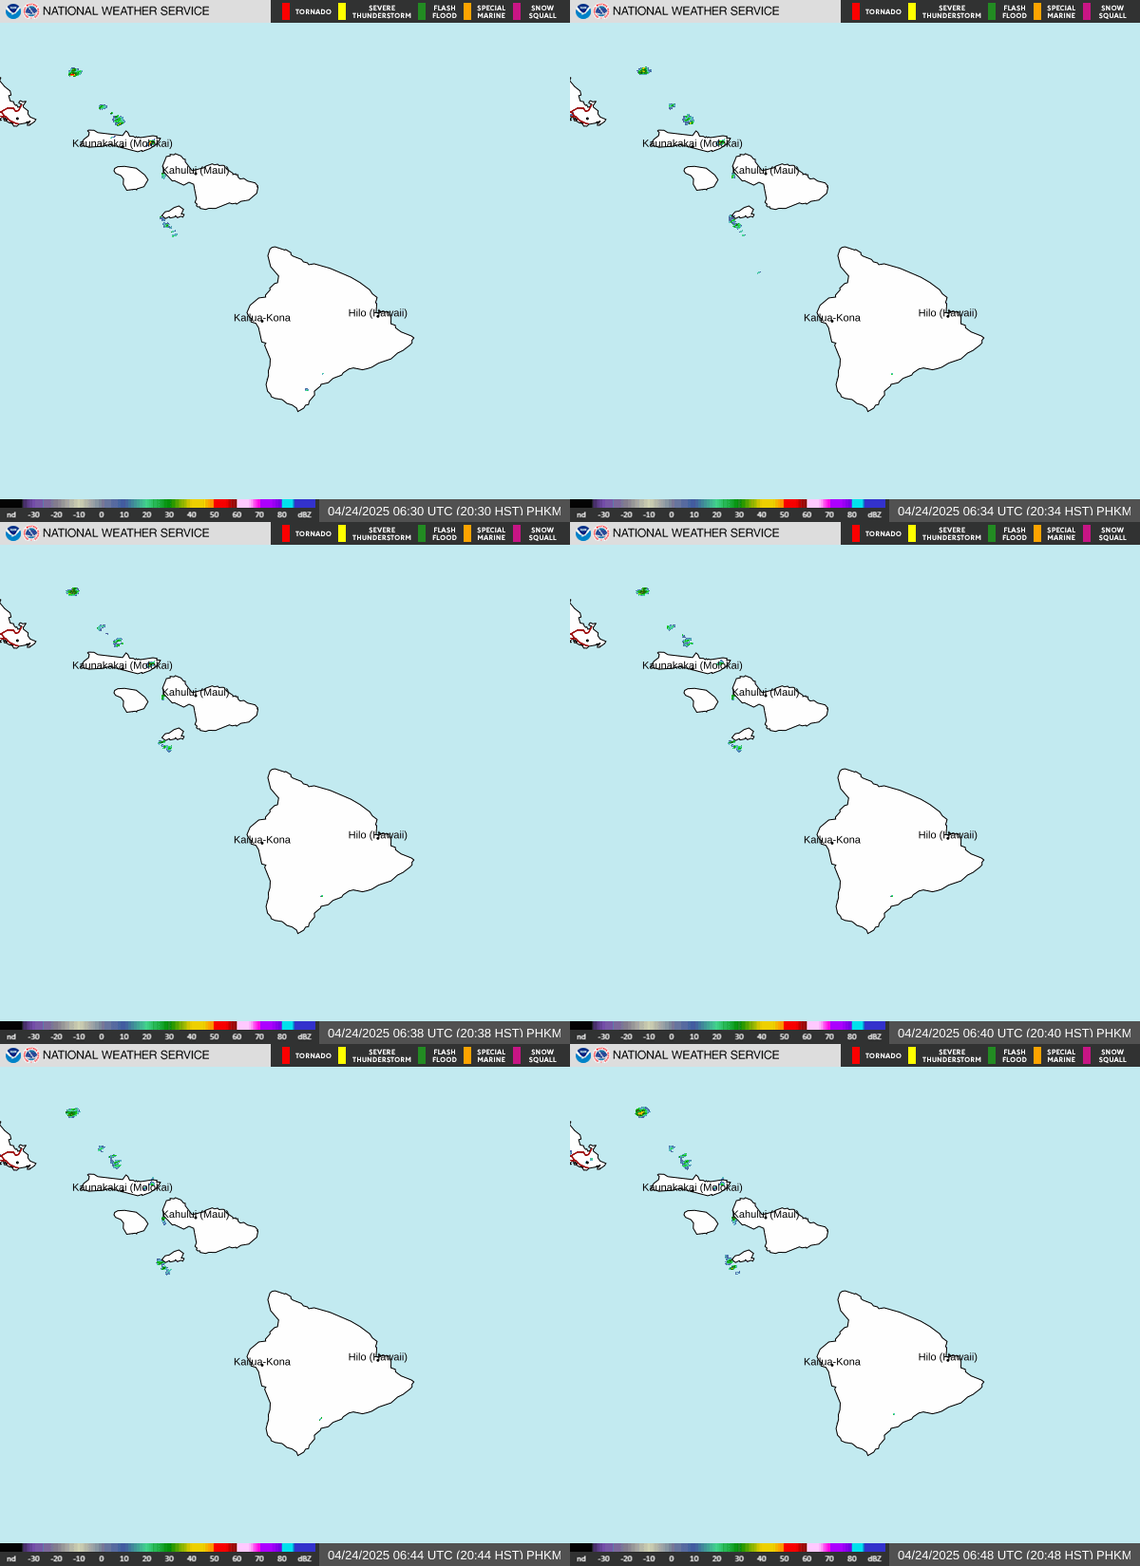
Localized Showers…very few
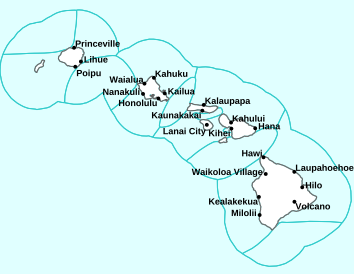

Please open this link to see details on any current Watches, Warnings and Advisories noted above
~~~ Hawaii Weather Narrative ~~~
Glenn’s Monday comments: I’m at my friend Bob’s here in Bend, Oregon on a working vacation.
417am, it’s partly cloudy here in Bend, Oregon, the low temperature was 37 degrees…with calm winds
Tropical Storm Olana…far to our southwest won’t be an issue in impacting our islands
>>> It would be wise to pay attention to this heavy weather situation coming up in the near future
A significant pattern change is expected late Monday night through at least Thursday as deep tropical moisture is brought north. A combination of surface lows and troughs will bring exceptionally moist air over the state beginning late Monday night. Heavy rain and isolated thunderstorms are possible throughout this period. Models have not converged on details yet, so exact locations, timing, and rainfall amounts are not certain. Please be prepared for periods of heavy rain this coming week.
Here’s an interesting weather web blog, Mauka Showers…Hawaii’s Upcoming Drought of 2027?
Hawaii’s Weather Highlights…as of Monday morning: Gentle to moderate northeast trade winds expected for the next few days. Deep tropical moisture will bring the potential for heavy rain and thunderstorms across the state starting late tonight through at least Thursday. The forecast for the weekend is a return of trades, but continued above-normal rainfall.
Weather Narrative…as of Monday morning: Radar and satellite imagery shows a few scattered clouds and showers across the state. Expect northeasterly trades to gradually decrease today. As we head into this evening and for the next few days the weather pattern gets rather complicated.
A large low sits about 800 miles to our northeast. A front extends to the east and then south of the low, and a trough extends southwest from the decaying end of the front toward Hawaii. A separate upper level trough is to our northwest and Tropical Storm Olana sits to our southwest. The northwestern trough will sag southeast helping pull Olana toward the islands. Tropical Storm Olana is expected to weaken into a tropical depression and stay to the west of the islands Tuesday.
The trough extending from the low to our northeast will eventually extend all the way to the remnants of Olana, and then drift north over the state. This trough will bring abundant tropical moisture and remain nearly stationary over the area through the end of the week. A series of small lows will form with one or more potentially moving over the state. Models still show disagreement on timing and locations of these features. This makes the uncertainty higher than normal.
With the potential for heavy rain and a few thunderstorms continuing over the state for a few days, a Flood Watch will go into effect at 6am Tuesday through Wednesday evening, with the potential of it being extended. Total rainfall amounts Tuesday through Thursday range from 2 to 8 inches, with the highest amounts in the higher elevations. There is also a chance of a few thunderstorms at times. With any thunderstorms brief gusty winds and very heavy rain can be expected. We look to return to a trade wind pattern this weekend into early next week.
Fire Weather: Gentle to moderate trades expected today. Deep tropical moisture will move in Tuesday, bringing a threat for heavy rain and a few thunderstorms through at least Thursday. As a result, fire weather concerns will be low through most of the next week. Inversion heights will range from 4,500-6,000 feet.
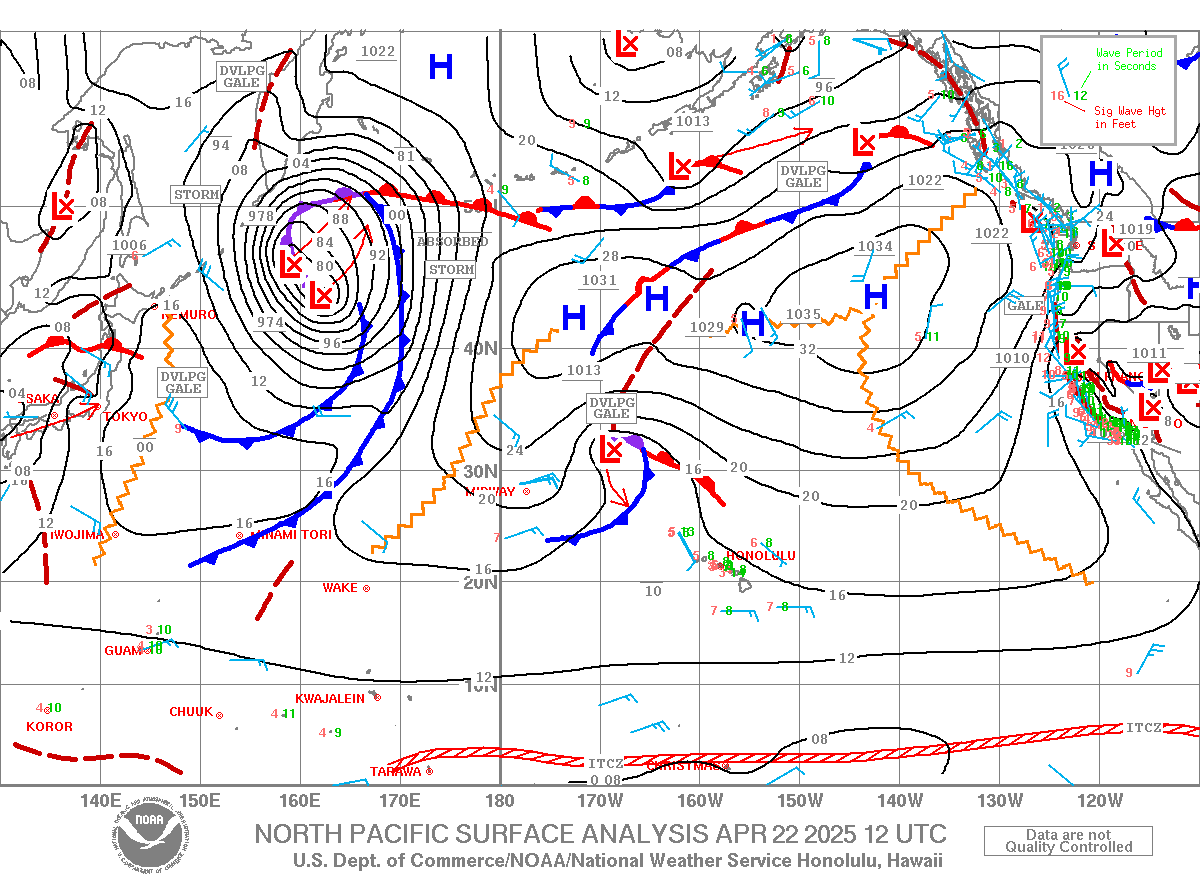
Here’s a near real-time Wind Profile of the Pacific Ocean – along with a Closer View of the islands / Here’s the latest Weather Map / Looping Surface Precipitation…through the next 8-days / Vog Map
Marine Conditions…as of Monday morning: A surface low far northeast of the Hawaiian Islands will stall roughly 800 miles northeast of the state today. A low pressure trough is forecast to approach the area by late tonight, bringing heavy showers with embedded thunderstorms to the waters over the next several days. Relatively weak wind flow will persist through the forecast period.
A short period north-northwest swell will gradually lower today. Meanwhile, an overlapping, moderate, mid-period northwest swell is will build today and bring surf to near advisory levels along north and west facing shores through Wednesday. A small north-northeast swell should arrive during the second half of the week.
Overlapping south-southwest swells will keep surf along south-facing shores to around seasonal averages through Tuesday. A larger south swell may push surf up to near advisory levels Thursday and Friday.
Surf along most east-facing shores will be small through early this week, but areas exposed to wrapping northerly swells will experience periods of moderate surf today. East-facing shores should also see a bump in surf if the north-northeast swell materializes during the latter half of this week.
>>> Highest Temperature Sunday, October 25, 2026 – 89 degrees near Ingleside, TX
>>> Lowest Temperature Saturday, October 24, 2026 – 12 degrees near White Sulphur Springs, MT
World-wide Tropical Cyclone Activity
>>> Here’s a link to the latest Pacific Disaster Center’s Weather Wall
Atlantic Ocean: There are no active tropical cyclones
Caribbean Sea: There are no active tropical cyclones
Gulf of America: There are no active tropical cyclones
Northeast Pacific:
Tropical Cyclone 22E (Vance)…is located 265 miles south-southwest of Manzanillo, Mexico
VANCE MOVING SLOWLY WEST-NORTHWESTWARD AND LIKELY TO WEAKEN
According to the NHC advisory number 21
Vance is moving toward the west-northwest near 7 mph. This motion is expected to continue for the next day or so, followed by a turn to the northwest on Tuesday and north on Wednesday. Maximum sustained winds remain near 65 mph with higher gusts. Gradual weakening is forecast during the next several days. Tropical-storm-force winds extend outward up to 125 miles from the center. The estimated minimum central pressure is 997 mb (29.44 inches).

Central North Pacific:
Tropical Cyclone 3C (Olana)
OLANA WEAKENS TO A TROPICAL DEPRESSION
According to the NHC advisory number 5
The depression is moving toward the southeast near 5 mph. A general southeastward to eastward motion is expected during the next day or two. Maximum sustained winds have decreased to near 35 mph with higher gusts. Additional weakening is expected, and Olana is forecast to become a remnant low in a day or so. The estimated minimum central pressure is 1005 mb (29.68 inches).

Northwest Pacific Ocean:
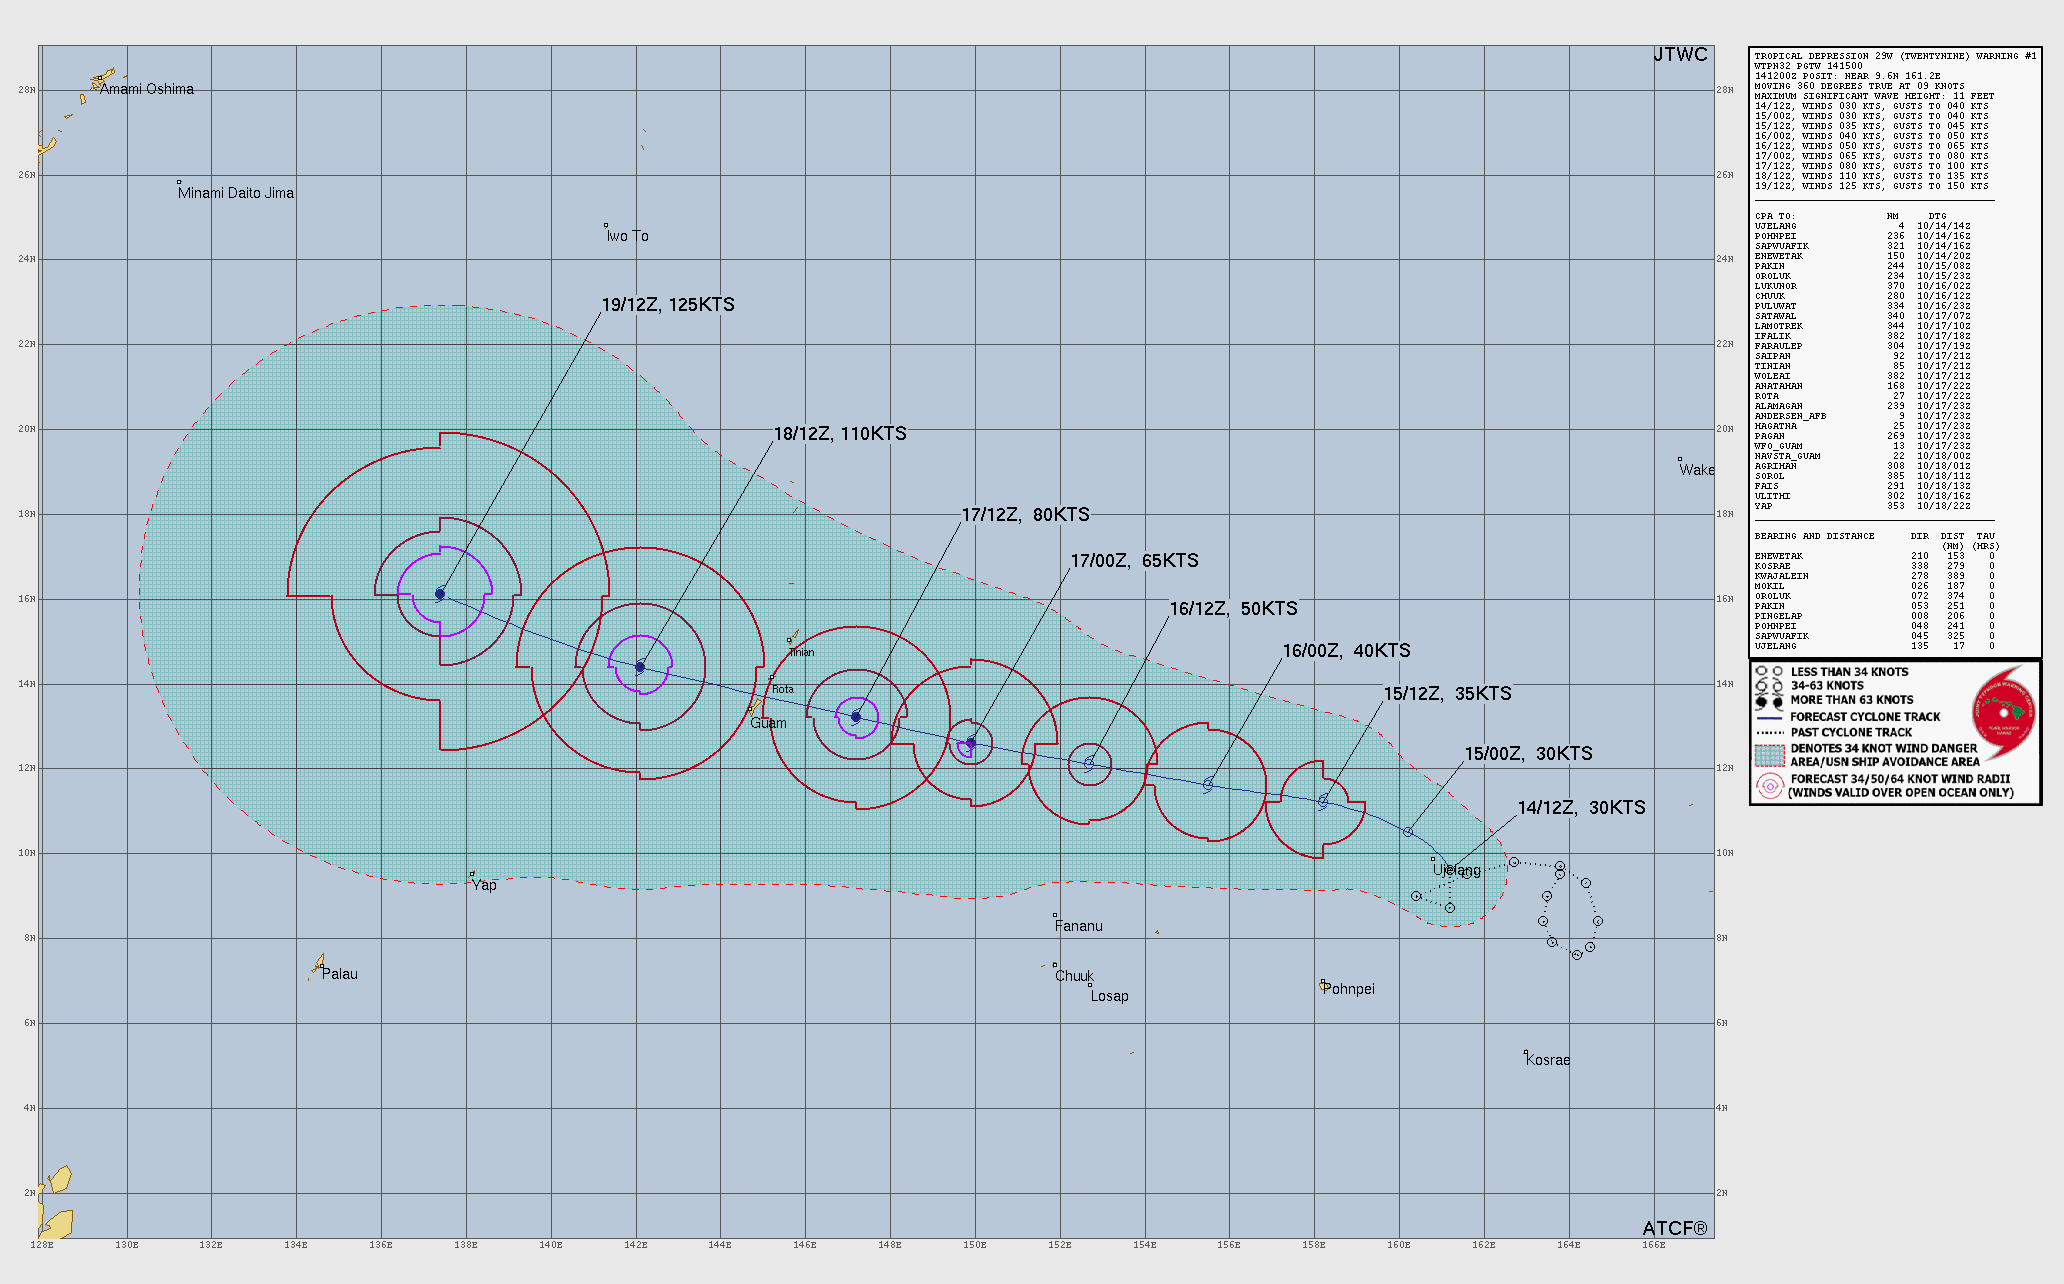
Tropical Cyclone 29W (Champi)…is located approximately 163 NM southwest of Sasebo, Japan – Final Warning
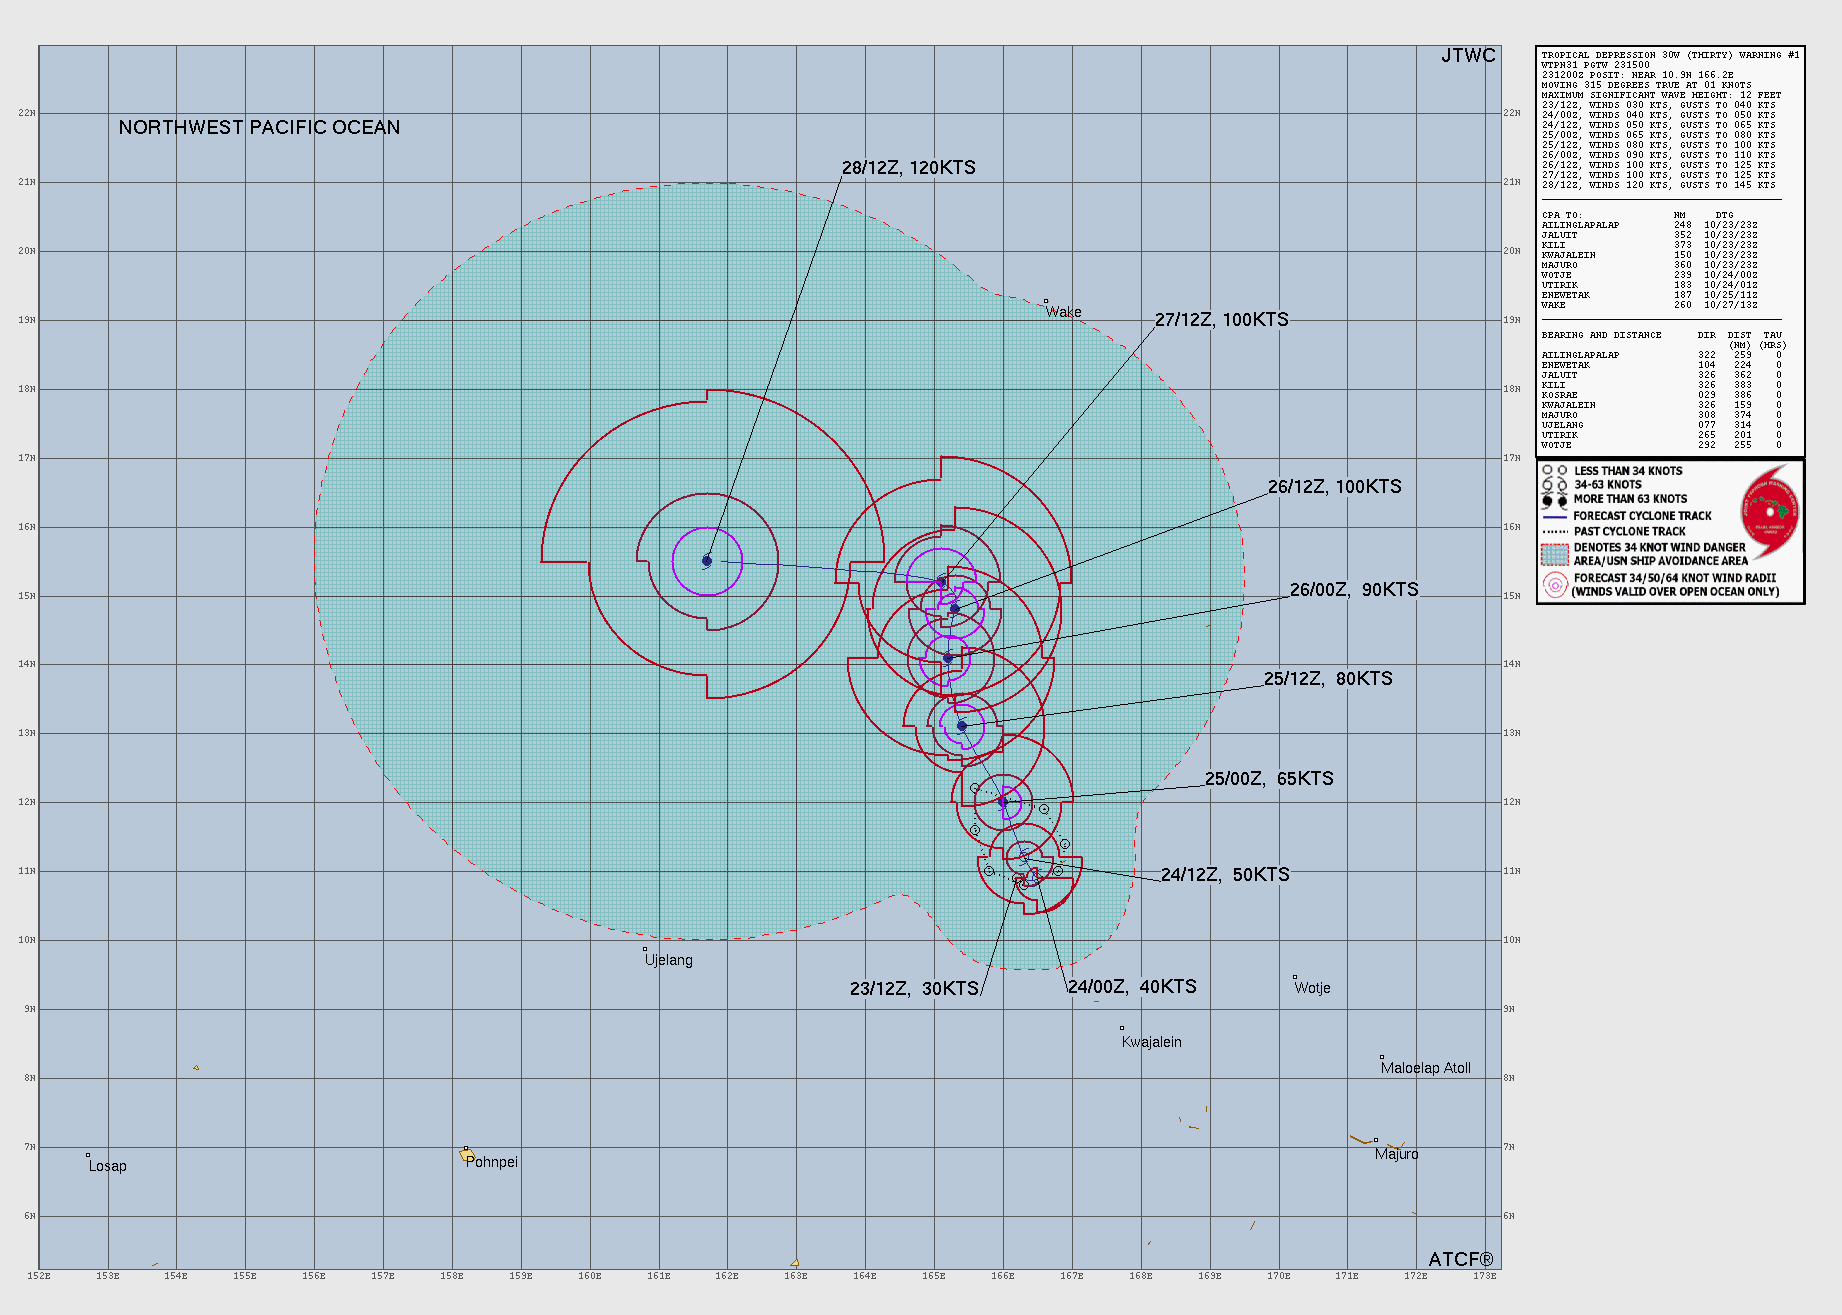
Tropical Cyclone 30W (In-fa)…is located approximately 384 NM southwest of Wake Island
Southwest Pacific Ocean: There are no active tropical cyclones
North and South Indian Oceans / Arabian Sea:
North Indian Ocean
Tropical Cyclone 02B (Arnab)…is located approximately 408 NM south of Kolkata, India
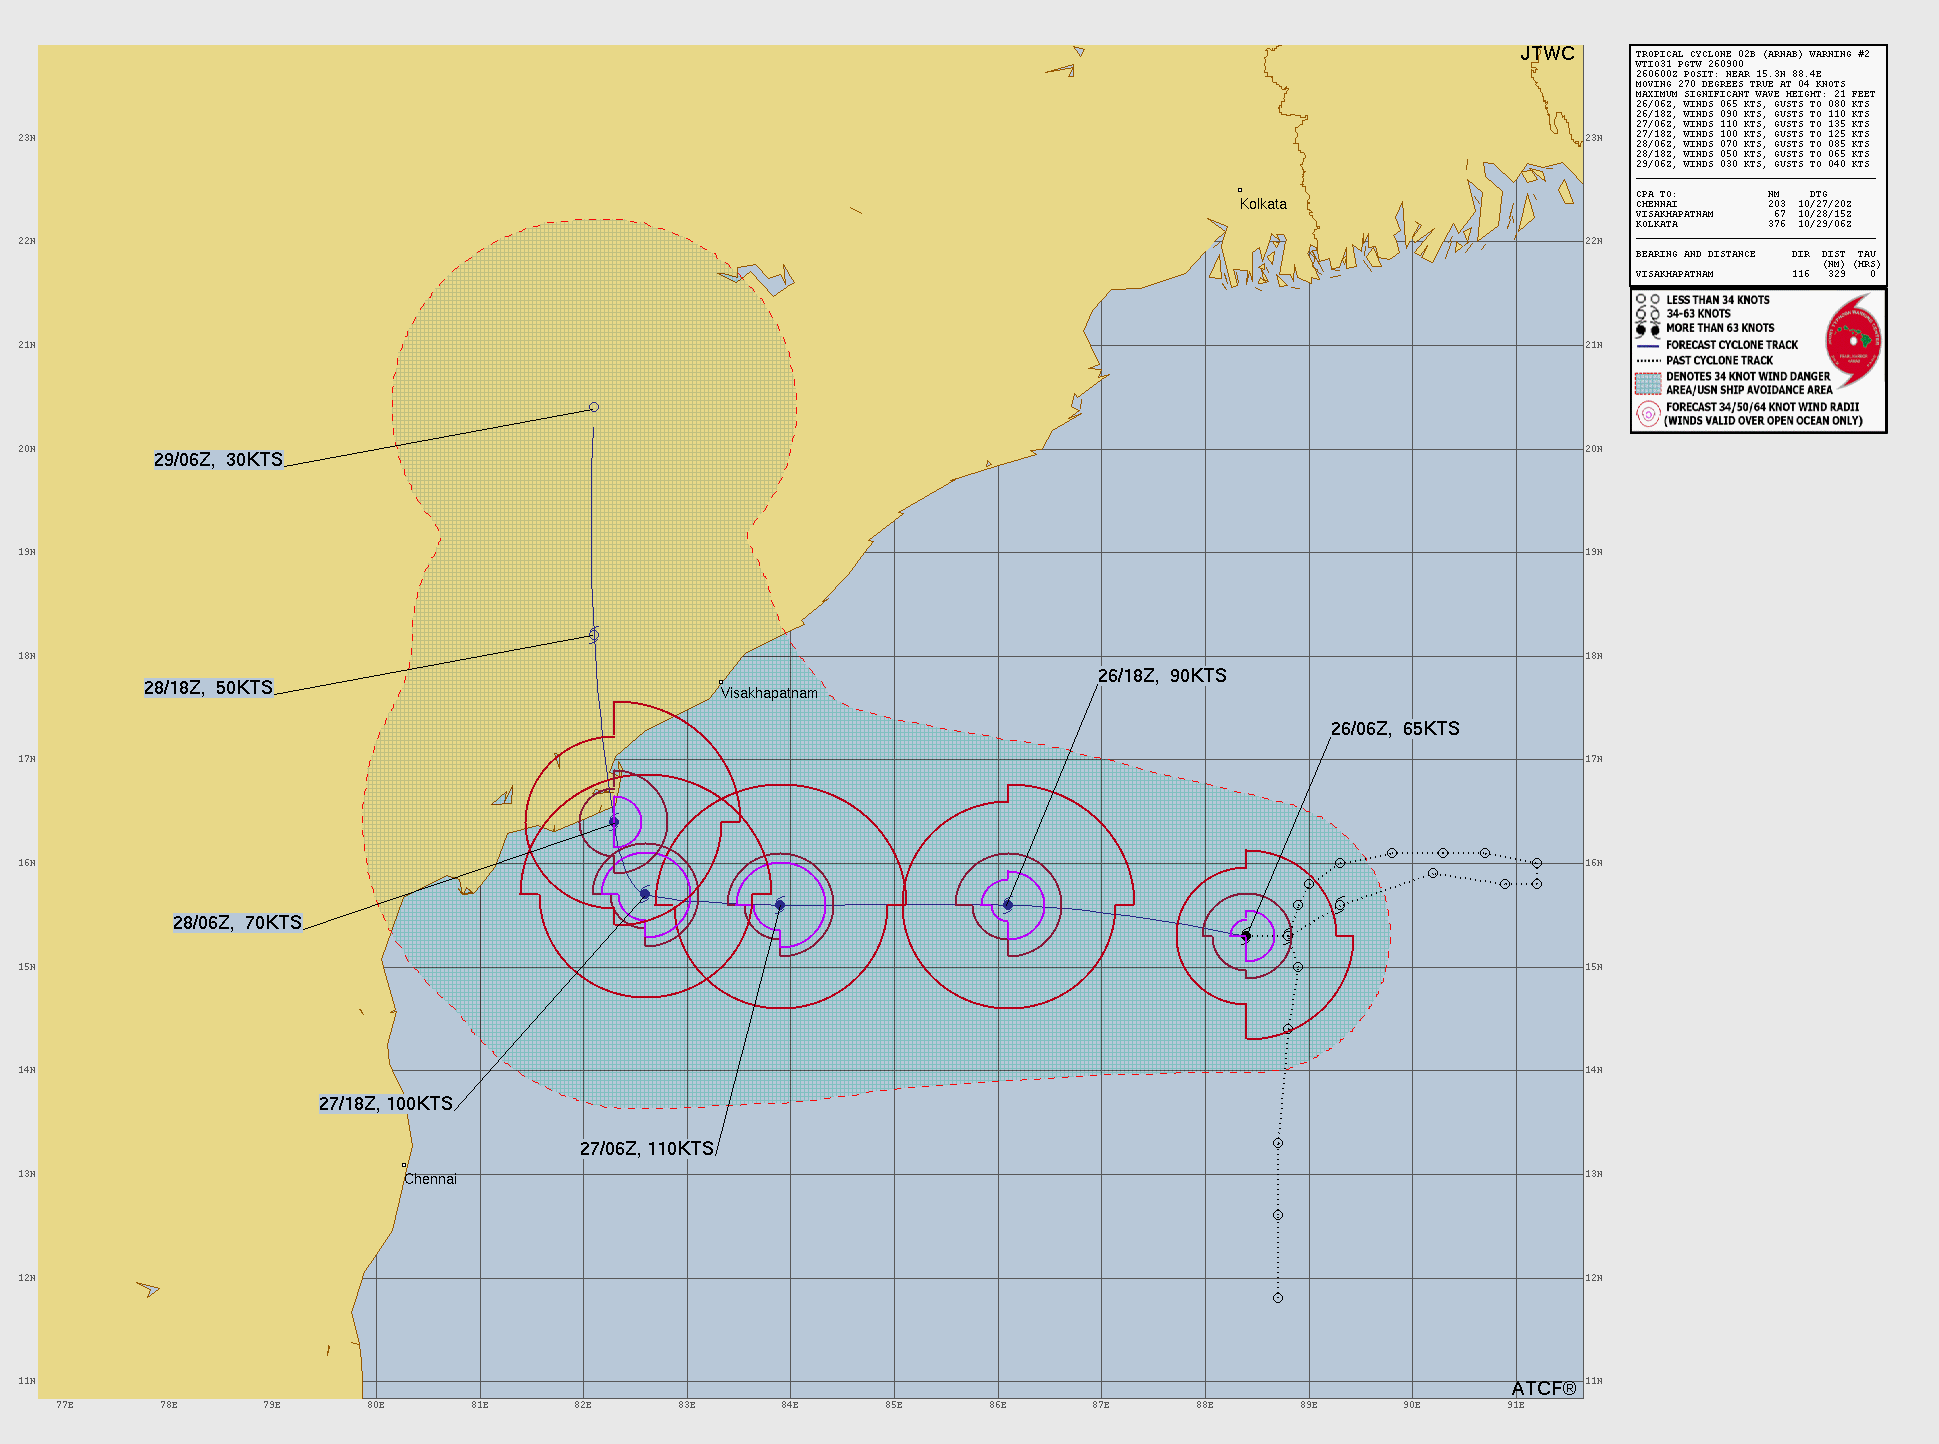
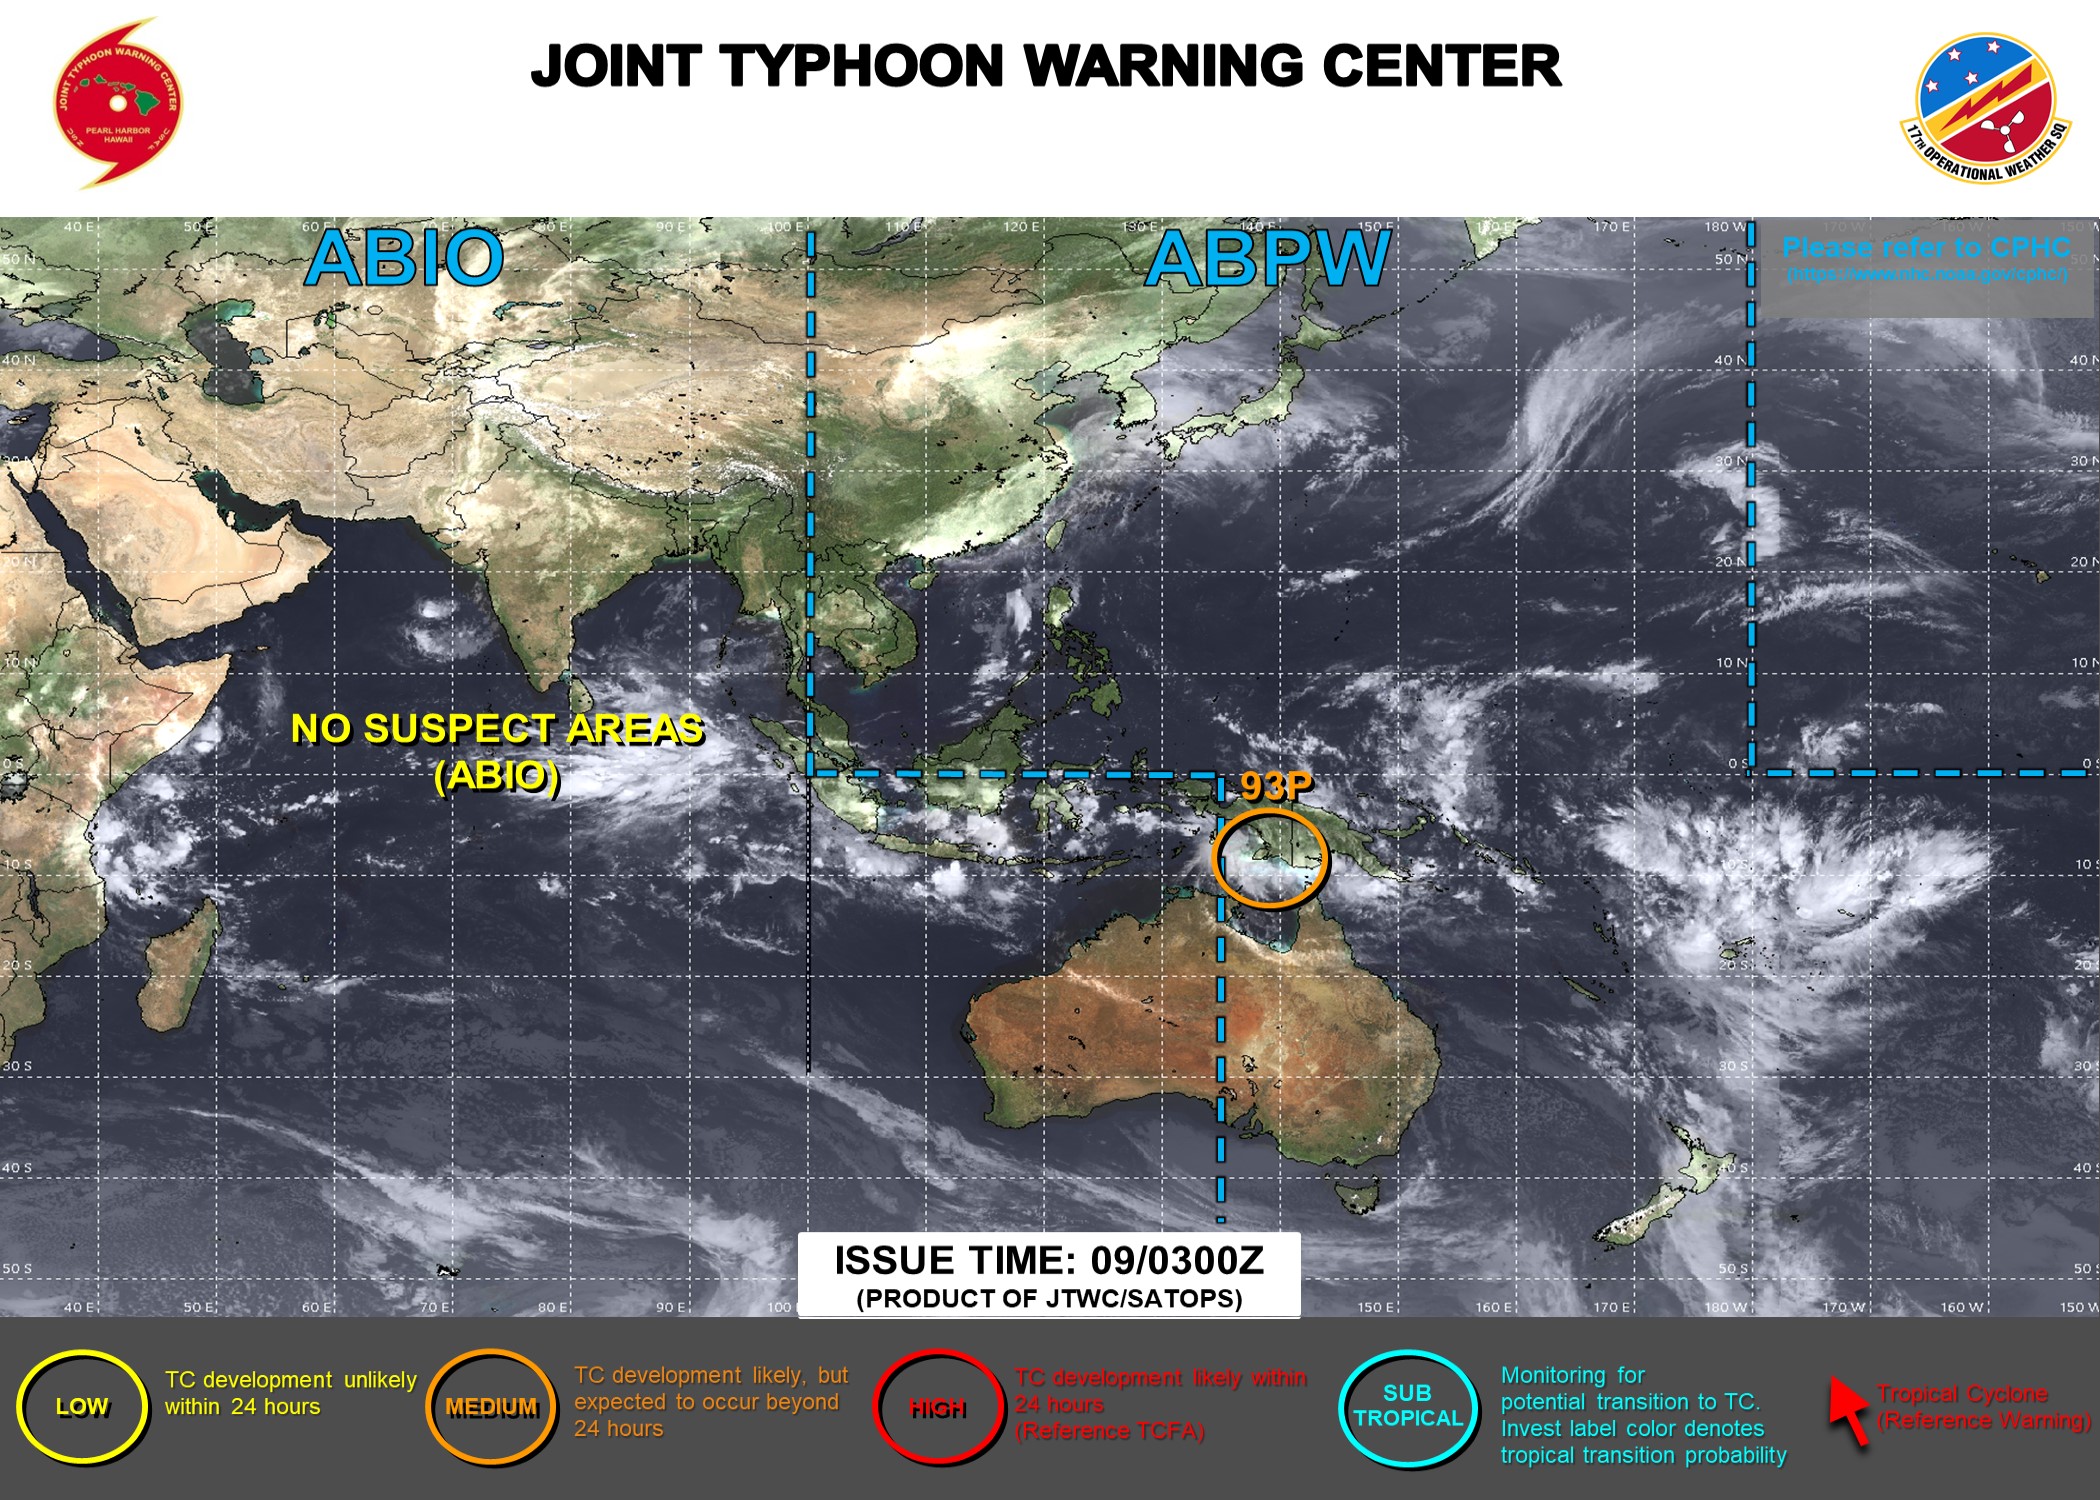
Here’s the link to the Joint Typhoon Warning Center (JTWC)
Interesting: Turning Waste Into Fuel Could Help Cut Cement’s Carbon Footprint
Waste that would otherwise end up in landfill could help low-carbon cement production by reducing the industry’s reliance on fossil fuels, according to Australian researchers.
Adelaide University PhD candidate Geethmi Thisakya, along with her supervisory team, Dr Navodana Rodrigo, Dr Chamitha Wijewickrama and Professor George Zillante, has systematically reviewed global research on using refuse-derived fuel (RDF) in cement manufacturing, examining its potential to support cleaner industrial production and more sustainable waste management.
Cement is essential for buildings, roads and infrastructure but is also responsible for an estimated 8% of global carbon dioxide emissions.
The industry relies heavily on coal and other fossil fuels to generate the extreme heat needed to produce cement. At the same time, large quantities of combustible waste, including materials that cannot be recycled, are sent to landfill.
Read More: Adelaide University
665 Responses to “Hawaiian Islands Weather Details & Aloha Paragraphs / October 26-27, 2026”
-
September 27th, 2026 at 8:51 pm
Paul V Says:Hi Glenn
Checked in with you a few days ago when my wife and I were trying to make up our mind to travel to Maui or not when Nora was wobbling around. Well, we arrived on Maui yesterday. Thrilled to be here. Weather is amazing.
Enjoy following your detailed, daily weather coverage even when we are not planning a trip to your lovely home.
Mahalo
Paul>>> Hi Paul, hey, welcome to Maui, glad you made the decision to come, as you see, it’s such a far out place! Your arrival was spot on, you did it! Very happy to know you visit this weather website, it makes me think you find the information useful or at least interesting and engaging enough.
Have a great vacation here in paradise!
Aloha, Glenn
-
September 25th, 2026 at 4:45 pm
Marge Says:Hi Glenn,
Does this storm have more than one name? Mostly I see Nolo but also Noro and Nora used for it.
Here’s hoping all of our power stays on.
Aloha, Marge
>>> Hi Marge, I hope it wasn’t me that misspelled Nolo’s name, although I could have I’m sure.I’m reading and hearing people saying that we may have missed the bullet, at least to some degree.
Me too, I really don’t like losing power!
Aloha, Glenn
-
September 25th, 2026 at 11:12 am
Nancy Says:Aloha Glenn, as a 40 year resident of Maui, I do not recall a tropical storm ever forming into a hurricane so close to the Hawaiian islands as Nolo. Do you agree?
>>> Hi Nancy, I’ve lived on Maui for over 50 years, and like you I can’t remember such an occasion, although I could be proven wrong, as lots of storms have come and gone during all these many decades.
Thanks for your good question.
Aloha, Glenn
-
September 23rd, 2026 at 1:34 pm
Paul V Says:Hi Glenn. I have reached out to you before but it has been a while since our last chat. My wife and I are scheduled to arrive on Oahu this Friday night and head to Maui (Wailea) on Saturday afternoon. I see the weather is taking another turn and I’m wondering if we should be reconsidering a trip to Maui at this time? It has been a few years since out last trip to Maui and we are very excited to be so close to being there, but I’m not sure we want to be there if the weather described hits as we’re arriving, and the potential aftermath. Mahalo Paul
>>> Hi Paul, yours of course is a very real and valid concern. I’d be hard pressed to give you advice one way or the other at this point. I guess if it was me, and if I had some time, I would try and wait to see if and when this upcoming turn to the west happens, the timing of that turn will make a difference in what you could expect. I’d hate to stick my neck out any more than that, as I don’t want to lead you astray. Best of luck!
Aloha, Glenn
-
September 21st, 2026 at 12:00 pm
Jeff Says:Hi Glenn. Thank you for the update. I will be spending a week in Holualoa, above Kona, from Oct 1 thru Oct 9. Any hurricanes on the horizon for late next week?
>>> Hi Jeff, good question, although I don’t have as good an answer…too far out for me at the moment. When I see something, if I do, you know I’ll be pointing it out right away.
Aloha, Glenn
-
September 21st, 2026 at 10:57 am
Jill Painter Says:What an interesting forecast on this Monday morning, the 21st. I really appreciate the detailed explanation of what could or could not develop south of us this week. Up here in Kula it is slowly getting cooler in the evenings, but still quite unusually warm by the afternoon. Thanks for respecting the intelligence of your readers. Hopefully we are working away from this El Nino. As always, you’re the best.
>>> Hi Jill, indeed, very interesting times now, in terms of tropical cyclone activity here in the central Pacific!
Yes, gradually cooler at night, although as you point out, still very summery in the afternoon hours.
I’m afraid that this very strong El Nino will be with us through the rest of the year plus.
Thank you so much for your positive feedback Jill!
Aloha, Glenn
-
September 11th, 2026 at 2:20 pm
Susan Says:Aloha, Glenn! Just wanted to send a note of gratitude for your daily updates and for keeping this website live and lively! I have been reading this for many years and have found your insights to be extremely helpful. Mahalo nui loa from Ka’anapali! -Susan
>>> Hi Susan, it sounds as if you are another satisfied reader of my weather website…thank you greatly for letting me know! You are very welcome, it is my pleasure to keep the information that you find useful coming out to you, and everyone else, on a daily basis…actually many times each and every day of the year.
Stay safe and happy over there on the west side of Maui.
Aloha, Glenn
-
September 8th, 2026 at 12:13 pm
Jeff King Says:Aloha Glenn, Wow! What a weather pattern. “It’s only fun until somebody gets hurt” as my Tutu would say. I’m getting closer and closer to the “enough is enough” attitude with each new forecast. I thought you might appreciate this view of (currently non-existent) Charley Young Beach.
https://www.mauirealestate.net/live/
NOT the place for a tranquil morning beach walk today. Thanks again for all you do. I’ve been a follower since the late 90s and kinda’ miss your UH show close skateboarding footage. It’s long been an honor to get to tell folks “Hey, I’ve even met the guy.” Aloha hou
>>> Hey Jeff, incredible, yet another super comment this morning! Indeed, first Hurricane Lala, and now Hurricane Lowell…back to back heavy hitters. Thanks for the link, I’ve see Charley Young that way before, and as you say, not the place for a lovely beach walk! You are so welcome Jeff, you’ve been a user of my weather stuff for so long, decades in fact. I’m honored that you think fondly of me and my weather reporting!
Aloha, Glenn
-
September 8th, 2026 at 7:56 am
Dan Holme Says:Aloha, Glenn and mahalo for keeping us informed and prepared as always. You are a legend in our family–we’ve relied on you for decades and Hawaii, its ohana and guests are so much better off for all the effort you put into your work. THANK YOU!
>>> Oh my goodness Dan, what a great comment to read early this Tuesday morning! You are so kind and generous with your positive feedback, THANK YOU!
Aloha, Glenn
-
September 7th, 2026 at 11:45 pm
Mike Lagana Says:Wind is really picking up now on Kauai. I’d guess some 60 mph gusts. It will be closest to us right around midnight. Waves of driving rain hitting the windows and garage door.
>>> Hi Mike, thanks very much for the on the spot report from stormy Kauai! Stay save my friend! In contrast, here in upper Kula, Maui, I’m dead calm with dry conditions.
Aloha, Glenn
-
September 5th, 2026 at 1:56 pm
Tina Fein Says:I loved the Mary Oliver video too, thanks for that.
I like the rainfall forecast map too.
Thanks for all you do, you are a very important part of our community.
>>> Hi Tina, thank you very much for letting me know you enjoyed the Mary Oliver video, as did I. Glad you also like the rainfall forecast map, and again, as do I.
You are very welcome, I appreciate you positive feedback Tina!
Aloha, Glenn
-
September 3rd, 2026 at 10:19 am
Graham J Smith Says:Hi Glenn. Do you know why we have two “L” storms (Lala & Lowell) in the Pacific this year? Many thanks.
>>> Hi Graham, good question…Lowell started in the eastern Pacific, and Lala took on her name because she started in the central Pacific
Aloha, Glenn
-
September 2nd, 2026 at 11:41 am
Leimomi Says:Bah-RAH!! What da HECK?! Meeeeen da akshun out dea! How you? Your weather feathers must be all tickled. No get too excited now, couple communities already caught dirty lickens from Lala. Anyway, I just popping in to day hi. HIIIII!! Take care my friend. And pray dat buggah no make dat right hook too early. YIKES! I catching meeeen flashbacks to kid-teen time. Or pray dat low presha no suck um in. YOWZA! Aloha nui, Leimomi
>>> Hi Leimomi, long time already! Looks like it’s gonna get windy, and yes, that right hook looks nasty, I’ll bet you folks on Kauai are keeping a very close eye out with your fingers crossed…what with Hurricane Iniki long ways back in the rear view mirror! Take care up there on Oahu, as we are all on edge with this Cat 5 Lowell doing his thing down to our south!
Aloha, Glenn
-
September 2nd, 2026 at 5:13 am
Kohololo Says:Mahalo Glenn. Choke activity.
>>> Hi Kohololo…dat’s for sure!
Aloha, Glenn
-
September 1st, 2026 at 10:12 am
Graham J Smith Says:Hi Glenn. FYI, the Haleakala park webcam is working again.
>>> Hi Graham, thanks for letting me know! I just added the link back to that webcam.
Aloha, Glenn
-
August 28th, 2026 at 11:56 pm
christine Says:Just watched the impactful youtube video of Mary Oliver. Thank you for including that in your narrative!!
>>> Hi Christine, oh good, you enjoyed the Mary Oliver video, thanks for letting me know! I know it’s not exactly weather related, although I love nature, and obviously she did…and I would imagine you do too!
Aloha, Glenn
-
August 28th, 2026 at 5:24 pm
Danny in Haiku Says:Aloha Glenn,
Hope this finds you well.
Love all the reporting as always.I’m finding the latest model runs for TS Llyod to be quite worrisome. I know there is no way to know for a few more days impacts to HI Islands, if any, but those spaghetti model are definitely concerning. Thoughts?
>>> Hi Danny, it’s true, those models continue to show TC Lowell coming a bit too close for comfort. The last several days have showed this storm spinning by just to the south of the islands, rather than making a direct impact. However, it looks like it could be close enough to at least give us some potential heavy rains. Time will tell, and it would be wise to stay tuned.
Aloha, Glenn
-
August 23rd, 2026 at 10:29 pm
Roberto Says:Hello Glenn How goes it bud? Long time no see.. hope you are doing well. Roberto here, frm forever… Thanks for the dedication keeping us informed on the ongoing weather.. I have a question on how to read the satellite imagery. My go to image is the second in the line of images on the site. Can yyou explaine the colors depicted? The red yellow green blue? Are they all simply density of rainfall?- like red being the heaviest amount of precipitation…? the morphing imagery is wild and cool… but this morning, as the system approached the big island, there was scattered bluish imagery, and out of nowhere, this red mass appeared and it looked so ominous- how do we read that? Hope the question is clear and not lame. Steady as she goes mate. Aloha!
>>> Hi Roberto, good questions of course. As for the colors on that satellite image you are referring to, they show the lower clouds as blue, with the highest clouds grading up through green, yellow, and red. Typically, the yellow and red colored clouds are where you find the heaviest rainfall. Actually, the light gray colored clouds are the lowest…the ones without a distinct color.
As for the ominous looking clouds when TC Moke was approaching the Big Island, there where tall thunderstorms in that area near the center.
I hope this helps some, it’s may be over simplified, although I’m sure it gives you the general picture.
Take it easy now, as for a change there’s isn’t a tropical cyclone heading more or less towards our area!
Aloha, Glenn
-
August 21st, 2026 at 12:54 pm
Aunty E Says:aloha, just wanted to say how thankful I am to have found your page!
>>> Hi Aunty E, happy that you came across my weather website!
Aloha, Glenn
-
August 20th, 2026 at 9:40 am
timothy kodysh Says:gleNN this is Southpoint speaking
I’m most concerned about this new mass of moisture southeast of us that no one’s talking about is that another hurricane coming at us
It looks to be the size of the big island or bigger
Yes I live at waiohinu, and have given weather updates before knowing how unique our location here is to the state
naalehu it’s just a disaster of a mud flow and rocks of course
I’m three properties from the new Gulch that’s been formed
by the waiohinu historical church
Our water system is destroyed in Kau and helco said yesterday 95% of the electricity will be restored by September 8
So this development of Weather to our east has me really concerned for the two brand new gulches in my property forming on either side of my house
Do you have any information on the developing whether to our southeast
Thanks again very much tim k>>> Hi Tim, so sorry to keep hearing how terrible the situation is down in your part of the Big Island! Ouch, September 8th…that’s a long time to be without power!
Indeed, this next system, TC 02C, which will take on the name Moke, will likely bring more rain your way, too much rain in fact…which you folks absolutely don’t need!
Best of luck to you, and to all the rest of the folks down your way!!!
Aloha, Glenn
-
August 19th, 2026 at 3:55 am
VibPost Says:The 4.35-inch total at Kealakekua stands out sharply against the other islands. Is that mostly elevation and orographic enhancement, or was it tied to one localized rain band? For someone driving from Kona toward South Kona on Wednesday, would the main concern be brief ponding rather than sustained heavy rain?
>>> Hi VibPost, the latest rainfall total for Kealakekua this morning is 2.22 inches. My best guess would be that that amount of heavy rain was from a previous downpour. If it was me, I’d call someone in the Transportation Dept and ask whether there was going to be any trouble driving from Kona to where you are going. I don’t expect any sustained heavy rainfall in that area today, although it’s likely that there could be some rainfall.
Best of luck!
Aloha, Glenn
-
August 18th, 2026 at 1:57 pm
Jerry D Says:Hi Glenn,
We were spared much of the damage here in Haiku with power still mostly working on my street which is unusual for us. It looks like one or two more storms may spin up in the next week or two as showing on the Windy app. What do you think?>>> Hi Jerry, there’s one area that is the minor one of two, which could swing by to the northwest and north of us, and then a somewhat more serious system that could move by us just to the south with time…this is the one that we’ll need to keep an eye on I’d say.
The NWS Weather Prediction Center is say this today:
NHC is tracking another tropical wave well southeast of the
islands, with a 50% chance of developing (which now has a 60% chance) into a tropical cyclone as of early Tuesday. This wave will track westward, with most model and ensemble solutions continuing to keep it south of the islands this weekend into early next week. Trends will continue to be monitored over the coming days, as even a pass to the south could increase moisture and rainfall across the southern portion
of the island chain.Aloha, Glenn
-
August 18th, 2026 at 12:43 pm
Kula Andrew Says:Aloha Glen, do you have any final peak rainfall or wind gust totals for Maui as a result of Lala? Thought the roof might come off more than once here in upper Kula! Mahalo
>>> Hi Andrew, I don’t have any official numbers, although here at my place we received a bit over 10 inches of rainfall over the weekend, and as for wind gusts, I’d estimate 40-50 mph…which I’d call a major storm without a doubt. I know it was much worse in some places down on the Big Island, and elsewhere too. I was out of the loop in terms of information much of the weekend, as my power was out for 54 hours.
I can understand that you thought the roof might fly off your place, the thought crossed my mind a couple of times too.
Aloha, Glenn
-
August 16th, 2026 at 7:16 pm
Butch Says:Glen, I’m in Hana, Sunday 8-16-26
I’m about a mile uphill from Hamoa Beach, it’s been raining very heavily since a bit after 11a, now it’s 3p… my gutters have been overflowing since, even though they have full discharge flow. Must be more than 2 or 3 in/hr, like the flood alert estimates. I just cleared my full rain gauge, re-sset it and in 16 minutes, one inch accumulation !
Please send life rafts !!! and peanut butter..
it’s a bit more than “liquid” sunshine
Enjoying nature at it’s finest! I know you are too!
Thanks for being there!
Aloha!
Butch>>> Hi Butch, we hear you loud and clear! Hang in there the best you can, and you know that old say: this too will pass!
Aloha, Glenn
-
August 15th, 2026 at 9:26 pm
Marge Says:Hi Glenn,
Do you know how to access Tropical Cyclone Update Product (HFOTCUCP2) for hourly updates while the storm is a hurricane? It was mentioned in the NHC Lala discussion.
Thanks again, Marge>>> Hi again Marge, nope, not sure where to find those updates.
Glenn
-
August 15th, 2026 at 8:37 pm
doc John Says:Yes Glenn…I hear the eucalyptus trees roaring too!!
Sounds like a freight train.A common sound here in Kula. It will be interesting to see what happened on my next bike recon of Crater Road! Thanks for all you are doing to keep us informed with Lala.
Doc John>>> Hey Doc John, good to hear from you. It is like a freight train, and I’ll bet its even louder up in your area on Crater Rd.
You’re very welcome, as you know, it’s been my thing to follow the weather since I was a little kid, and this natural interest of mine is still going strong.
Be well, Aloha, Glenn
-
August 15th, 2026 at 6:22 pm
Kym Krizek Says:Mahalo Glenn! We’ve been checking HI weather today for years. You’re indispensable! I’m in Kohala Estates by Kawaihae on BI & we are getting some gusts into the 60s. I’m curious …. where is Puuloa BI? 81mph! 😬
>>> Hi Kym, good question, it’s up the mountain from Hilo, right around 1,000 feet. It’s an interesting place, in that the winds can rage, like they are now, and then at other times, they are much lighter than many other areas in that general part of the Big Island.
Ah yes, the Kohala District, by Kawaihae, which gets very windy at times too…like your gusts into the 60’s!
Thank you for your readership my friend, stay dry and safe through this current inclement period.
Aloha, Glenn
-
August 15th, 2026 at 5:22 pm
Kelly Elijah Says:Stay safe, Glenn, Thank you staying up to give us the play by play. This is the least of our concern right now but I notice that your clock on when patrons post is way off.
>>> Hi Kelly, thanks for your comment! You know the truth is that I’ve never even noticed those times! I have nothing to do with that, although perhaps it’s geared towards the Pacific Coast time?
You’re very welcome, and as long as my power is on, I’ll keep providing the ongoing updates…you betcha!
Aloha, Glenn
-
August 15th, 2026 at 3:55 pm
Helen Says:We are in Olinda Glenn; stay safe everyone!
>>> Thanks Helen, you live in Olinda, Maui, which is on the upcountry side of east Maui…more or less up above Makawao town.
Aloha, Glenn
-
August 15th, 2026 at 2:50 pm
Helen Says:At least 8 inches of rain ☔️ here so far and lots of wind 💨 !!
Stay safe out there everyone!!>>> Hi Helen, wow, wet and wild…please remind us where you live
Aloha, Glenn
-
August 15th, 2026 at 2:21 pm
Marge Says:Hi Glenn,
Can we expect the winds to come out of the NE as the storm passes to our south? I am not finding any wind direction predicted for Pukalan today.
Fingers crossed the power stays on.
Thanks for keeping us so well informed.
>>> Hi Marge, north to northeast today…gradually becoming easterly going forward
Power staying on…YES!!!
You’re welcome, nothing I’d rather be doing than staying informed myself…and sharing it with you and everyone else!
Aloha, Glenn
-
August 15th, 2026 at 1:37 pm
timothy kodysh Says:Glen and for all your viewers the report at Southpoint is we had a comm salty night with a few bursts (calm) of rainfall however right after Dawn this morning the wind started and now we have 4 inches of rain accumulated at 9:30 will update tim waiohinu
>>> Hi Tim, thanks very much for the observation down there at South Point on the Big Island…you’re in the thick of it it sounds like. Always open to updates from you or anyone else here in the islands…or elsewhere for that matter!
Stay safe, Aloha,
Glenn -
August 15th, 2026 at 12:04 pm
judy eagle Says:Warm thanks for the tips, Glenn.
Reminders of things like charging devices and making ice are invaluable. Here are two: be happy, get some sleep.
Y’all come by real soon, now. Wailuku has Sunny’s, 62 on Market, plus Coffee Attic.
Mahalo.
>>> Hi Judy, good to hear from you. Thanks for your positive feedback! Stay dry and safe…Aloha, Glenn
-
August 15th, 2026 at 11:21 am
Deborah Thorne Says:Aloha Glenn, I now live in Maunaloa on the west end of Molokai. Thank you for your informative weather site in times like this with LALA. Deborah
>>> Hi Deborah! Oh, after leaving here you lived in Hana for a long time, now you are over on Molokai…you like the outer edges of society. You’re very welcome, you and your daughter stay dry and safe!
Aloha, Glenn
-
August 13th, 2026 at 10:11 pm
Lisa Says:Aloha Glenn:-) Have you gotten any info on storm surge for our friends in Kihei and in Town. Mahalo and hunker down. I’m right below your hale and am anxious about the Kamehameiki gulch. If there’s any way to let us know the levels of the gulches, my neighbors and myself would really appreciate it. Hunker down and keep the updates coming. Hopefully, our power stays on. It’s Football weekend! Come on;-) lol
>>> Hi Lisa, nice to read your thoughtful comment, as one of the major aspects of Lala’s weather elements will be locally heavy rains, which could fill gulchs and cause flooding in some low lying areas. I don’t have any means to let you know of the gulch water levels, other than getting out in the rain and looking. In terms of storm surge, I haven’t seen any information in that regard, although if I come across some news, I will immediately post it here on my narrative page. Like you, and likely all of us, we will be hunkering down when the rains arrive, staying off the roads as much as possible.
I just found this:
STORM SURGE: The combination of a dangerous storm surge and the tide will cause normally dry areas near the coast to be flooded by rising waters moving inland from the shoreline. The water could reach the following heights above ground somewhere in the indicated areas if the peak surge occurs at the time of high tide…
Hawaii…1 to 3 ft
The deepest water will occur along the immediate coast, where the surge will be accompanied by large and dangerous waves. Surge related flooding depends on the relative timing of the surge and the tidal cycle, and can vary greatly over short distances.
Best of luck Lisa, stay dry and safe.
Aloha, Glenn
p.s. and I’ll keep the daily weather updates going, as long as I have power…which hopefully won’t go out!
-
August 13th, 2026 at 1:55 pm
John Says:Hey Glenn, a wild ride coming our way. I noticed the predicted storm track is similar to Lane a few years back. The day of its arrival I was SUP paddling on the Kihei side with glassy conditions. Lane’s pinwheel storm energy wrapped around the island and smacked the North shore. There was also a destructive fire in Lahaina. Just an observation. Mahalo for keeping us posted.
>>> Hi John, good to hear from you! Thanks for sharing your experience of what happened when Lane brushed by the islands back then. We’re all hoping for the best, in terms of damage, etc, as we wait to see what Lala has in mind for us.
Take care, Glenn
-
August 12th, 2026 at 11:06 pm
Christine Richardson Says:Aloha Glenn,
Mahalo for your great weather site. I live in North Kohala on the Big Island and have followed your site for years, always so helpful and accurate. Just wondering why you have recently stopped including the link to the national hurricane center at NOAA? It is so easy to click and link to follow tropical storm/ hurricane threats.
Mahalo again for your great work,
Christine>>> Hi Christine, I’m sorry, I inadvertently deleted the link to the NHC, however, I have added it back onto the site…thank you!
Here’s a link to the National Hurricane Center in Miami:
https://www.nhc.noaa.gov/Aloha, Glenn
p.s. thanks too for your positive feedback!
-
August 12th, 2026 at 12:29 pm
Roberto Says:Aloha Sky Watchers ! Persuids Meteor Shower peak tonight and tomorrow ! KEEP LOOKING UP ! The peak is predicted** for 14:53 UTC on August 13, 2026. So the mornings of August 12 and 13 are probably your best bets. But August 11 and August 14 might be good as well. Watch your weather! And be aware that the Perseids tend to rise to a peak gradually, then fall off rapidly after their peak. When to watch: Watch in the hours before dawn. Do not watch in early evening; the radiant won’t have risen yet. The radiant – in the constellation Perseus – rises in late evening and is highest at dawn, as seen from the Northern Hemisphere. That’s why the meteors are best before dawn. No moon light to interfere with viewing this year, Peace, Starman R
>>> Thanks Roberto!!!
Aloha, Glenn
-
August 10th, 2026 at 3:54 pm
Jeff King Says:Hi Glenn, That (currently) disorganized 93E sure looks “organized” when looking at the 8-day precipitation loop. In fact, to my naked eye it looks pretty close to a bullseye from Maui through Kauai. What’s your crystal ball say this far out?
>>> Hi Jeff, good to hear from you, it’s been awhile. I agree with your assessment, or with what the models are suggesting. I’d say we need to keep a close eye on what happens this week, of course we know that the situation could change, nonetheless, we need to pay close attention, and be prepared to ride it out if this system were to impact us directly or even indirectly.
Here’s a link to the precipitation model you were referring to:
Aloha, Glenn
-
August 8th, 2026 at 12:31 pm
Roger Says:Hi Glenn,
Did I miss some big event. or is this just a typo? Molokai?
The latest update to this website was at 634am Saturday morning HST (8/8/2026)Here are the latest 24-hour precipitation totals (inches) for each of the islands Saturday morning:
0.82 Mount Waialeale, Kauai
0.26 Kamananui Stream, Oahu
0.11 Puu Kukui, Molokai
0.05 Lanai City, Lanai
0.25 West Wailuaiki, Maui
0.24 Kawainui Stream, Big Island
Aloha, Roger>>> Hi Roger, yes my error on Molokai…first mistake I’ve made in 133 years! Hahaha
Thanks, Glenn
-
August 1st, 2026 at 10:55 am
Rob G Says:Happy Belated Bday! Glenn Living in Maui for 5 years now and I love waking up and reading your comments etc. thank you for keeping us informed. Mahalo Nui Loa!
>>> Hi Rob, thank you very much! You’ve helped make my day even more pleasant than it already was! I love getting up every morning and updating this website, so you and the many others have something to read about the weather…and a few other things.
Aloha, Glenn
-
July 31st, 2026 at 7:36 am
Douglas Weigel Says:Hi Glenn, I follow your site on a regular basis and want your input into our next trip to the islands. In January my wife and I are staying on Maui for 2 weeks and are considering a 3rd week on the north side of Kauai mainly because of the beauty. What are the general weather conditions there in January (wind, rain, surf conditions)? We were at Wailea, Maui in February and experienced the huge Kona low that came through, but felt that wasn’t a regular weather event. Thanks so much. Aloha Doug.
>>>Hi Doug, thanks for following my website!
As far as the weather on the north shore of Kauai during the month of January, good question. January of course is in the heart of winter here, even here in the subtropics. Therefore, there could be rain, wind, and large surf breaking. On the other hand, you might sneak through a week with little rain and not much wind, although likely there will be surf breaking, some could be large there on the north shore. As for any specific conditions, that changes all the time, and you’ll have to wait until a week or so before you get there to have a general idea what to expect.
This may not help you much, although I don’t want to lead you astray.
I’m sure you will enjoy the beautiful island of Kauai, and even if it was rainy and windy at your rental on the north shore, you might find sunny and calm condition after taking the drive over to the south side for the day.
Aloha, Glenn
-
July 26th, 2026 at 8:37 pm
Ian Masterson Says:Aloha Glenn! A belated happy birthday to you! Hey, nice picture of my home, Hakipuʻu! You can see that sacred moʻo Moliʻi, as well as the “Crest of Waves Hill” Puʻu ʻŌhulehule! Oʻahu’s sacred peak, Kānehoalani (out of sight to the right in this pic). It is the peak of the Palikū cliffs that wraps around to the north along Hapuʻu o Hāloa, that beautiful cape that meets the sea at Kalaeoʻio and our favorite surfing site, Rainbows, off of Kanenelu Beach! In the foreground to the left is Puʻu Pueo and Kahiwa, with Waikāne behind. The Koʻolau peak in the left distance is Puʻu Kaʻaumakua, and beyond these mountains you go across to Waipiʻo and down into Waiʻanae! In the far west (right)you will see Puʻu Pauao (end of the light) Those places are behind the low gap in Hakipuʻu, where the legendary Maui lost his battle with the sun on summer solstice, the longest day of the year says the Kumulipo! Of course, his mom had asked him to slow the sun and lengthen the days so that her beautiful tapa cloth could dry, we see her tapa as those blanketing stratus and stratocirrus clouds we see in the sky. This is Hina who does her work pounding tapa in the moon! Mahalo for the hurricane update! Much aloha my friend, beautiful shot! Ian
>>> Hi my old friend Ian, thanks for liking the surf picture, and for your geographical description of what we’re seeing…Hawaii kine.
Thanks for your belated Birthday well wishes, I appreciate your kind gesture.
I trust you and your wife are well an fine, I’m sorry I can’t remember her name, and the rest of your family, including any pets that may be around.
Aloha Ian!
Glenn
-
July 15th, 2026 at 7:21 pm
Mr. Kelly Watson Says:Happy,happy belated Birthday, Glenn! My husband and I have also been devout followers of “The Glenness” since the MCC days. For reasons, windsurfing, hiking and gardening/living Haiku. We wish you all the best! And here’s to many more!
>>> Hi Mr. Watson, nice to hear from you, and thanks for your kind birthday wishes! You two have been around for a long time, the MCC days were decades ago.
Enjoy Haiku, which used to be my old stomping grounds before I moved up here to Kula.
Aloha, Glenn
-
July 14th, 2026 at 8:48 pm
Steven Says:Aloha Glenn,
Just wanted to wish you a happy birthday 🎂
I hope you are celebrating with a fine meal and a delicious glass of wine.
We are so thankful for your tireless efforts on your website!
I have been a well informed weather nut and fan for 40 years !! ( since MCC).
Have a great week and enjoy your summer months on the pickle ball court.
Best wishes,
Steve from Napili.>>> Hi Steven, thank you so much my friend, at least so far, yours is the only comment I’ve received in regards to my Birthday. In the old days I would get many, many comments…the times are changing. However, not for you and I, I keep this website going, and have been since 1991…and you keep reading for decades! Oh yes, the pickleball has become my number one recreational activity, I find it so much fun to hit the ball back and forth over the next…and the social aspect is great too!
Be well and enjoy yourself up on the upper West side Steve…thank you!
Aloha, Glenn
-
July 11th, 2026 at 1:55 pm
Eric Phillips Says:Aloha Glen! Thanks for sharing Kevin Kodama’s blog! Here in Honokaa we have had rain every day for a couple months. I was hoping for an explanation and was about to inquire about this incredibly wet period. Do you have any rainfall data for my area to share? I’m guessing the amount of rainfall is substantial. Much Aloha and Mahalo- Eric Phillips
>>> Hi Eric, good to hear from you. It was good timing, with your questioning and Kevin’s web blog coming together. As for your inquiry about Honokaa’s rainfall, here’s a NWS website that shows your rainfall data (scroll down the page until you see the Big Island…and Honokaa), which is updated 4-times each day.
https://forecast.weather.gov/product.php?issuedby=HFO&product=RRA&site=hfo
I hope this helps, and indeed, many areas around the state have had more than the ordinary rain, especially considering that May and June are typically the driest months of the year.
Aloha, Glenn
-
July 4th, 2026 at 1:55 pm
Dennis Bresnahan Says:hi glen.ijust wondered what happened to the mauna kea site. It used to have more views and a lot of good info. I still visit your great site every day and always will!
aloha den.
>>> Hi Dennis, I don’t know what has happened to the site you are referring to, when I click on the link to the summit of Mauna Kea, it looks normal to me. Thanks for visiting my site everyday!
Aloha, Glenn
-
June 23rd, 2026 at 11:10 am
Wendy Hatch Says:Aloha, Glenn! Thankful for your reporting on weather here, as always! Wondering why the high and low temperatures from the previous 24 hours are no longer reported on this site? We had such a sudden change last week from cooler spring temps to sudden heat and humidity that I was looking for confirmation on what the high temp was in Kahului, for example. Good to know wind speed and rainfall amounts, too, of course. Mahalo, Wendy Pukalani
>>> Hi Wendy, glad you are getting some value from visiting my website. The high and low temperatures from the previous 24 hours is something that the NWS office in Honolulu used to provide the public. However, they discontinued that service a while back, and haven’t begun that again, and after asking them about it, they didn’t know when or even if they would.
I enjoyed bringing that information to you and the others, and if they start giving those numbers again, I will certainly give those to you on this website!
Aloha, Glenn
-
June 21st, 2026 at 12:01 pm
Roberto Says:Greetings Sky Watchers ! The June Solstice arrived at 10:24 pm last night June 20 in Hawaii. For the Northern Hemisphere, it’s the longest day and shortest night. Jump up and down, run around the room, SUMMER time!
>>> Hi Roberto, thanks for your post! Sounds like summer is your season, for me personally, I’m preferential to Fall, Winter and early Spring. My roots go back to Wales, and so I’ve always preferred the cooler weather…heat can be a bit much for me, especially when it’s humid.
Aloha, Glenn
-
June 14th, 2026 at 10:35 pm
Selden Lewis Says:Hi Glenn, love your site, but I am sorry to see you’re calling Gulf of Mexico the Gulf of America. What’s up with that? Aloha. Maybe this was just copied and pasted from another weather forecast.
>>> Hi Selden, I totally understand your thoughts about the Gulf! I’m simply using what the National Hurricane Center uses. Just for the record, I’m with you in this matter.
Aloha, Glenn
-
June 11th, 2026 at 2:52 pm
Steve G Says:Quick non-weather question; how were you informed that pickleball was cancelled? I went to the gym today, and it was cancelled again with no sign on the door and the park office trailer was closed? Is the gym closed for the summer?
S>>> Hi Steve, A friend of mine texted me and told me the news about the Eddie Tam gym, and that folks were going to play in Haiku. No, as far as I know the gym will be available this summer…I sure hope so!
Aloha, Glenn
-
May 25th, 2026 at 10:43 am
Suzanne Villeneuve Says:Hi Glenn,
I live in Haiku and it’s been so cold, morning and night.
Is it normal for the end of May? It still feels like winter.
Thanks.
Suzanne.>>> Hi Suzanne, you know, “is this normal” is the newest question that people all over the world are asking these days! I know here in upper Kula Ive had chilly early mornings over the last couple of weeks. As for your area in Haiku, there is no official temperature readings that I have access to, so I don’t know how the early morning hours have been?
I’ll take you word for it though, I was just over at the Haiku Community pickleball courts playing this morning, and it seemed pretty typically warm…it was 81 when I left there.
I’d say don’t worry as we’re heading into our summer months soon, and I’d be surprised if you’ll be feeling too cold for very much longer. Keep your sweater handy Suzanne!
Aloha, Glenn
-
May 13th, 2026 at 8:35 pm
Kirk Boes Says:Hi Glenn, we live in West Maui and it’s ripping tradewinds today, but it looks voggy? My eyes are burning, too. Is the volcano going off? I tried googling for vog reports, but the websites were too complicated. Is there a simple one?
>>> Hi Kirk, looking down into the central valley from here in upper Kula, I see a bit of haze, although it doesn’t look all that voggy to me. At any rate, try this vog map, I have it here on my weather narrative page, just below the synoptic weather map. It does show a bit of vog around Maui County as it turns out.
http://weather.hawaii.edu/vmap/new/
Aloha, Glenn
-
May 8th, 2026 at 3:33 pm
Scott Lepor Says:Aloha Glen, Welcome back home. You are so fortunate to have your annual work-vacation-friends “out West”! A few days after your departure, a minor, inconsequential change occurred with your site and I wanted to wait til you settled back home to bring this to your attention. Of your 4 activity pages, 2 of them, *Dive and Snorkel AND *Beaches suddenly decreased in size; not in print but decreased in the page size as they appear on my large desktop. (This change in page size may not appear on the smaller screens?). If I was able to send you a screenshot, this description would be apparent. The present size of these two on my 27″ screen is perhaps 40% smaller than your other full-screen pages. Again, inconsequential, but this sudden change of those 2 pages is significant having following your most valuable and consistent site now for two decades(?). Mahalo for your fine work! Scott
>>> Hi Scott, thanks so much for letting me know! I was unaware of this, and just got off the phone with my webmaster, who said it should be an easy fix, and was going to take care of it later today. So, you should that 40% get back up to 100% soon!
Indeed, my friends are everything to me, and they know that I’ll be continuing my weather work while I visit them.
Best to you, Glenn
-
May 8th, 2026 at 8:50 am
Tim Says:Hi Glenn, I used to read the “Precipitation Summary” for Hawaii on the NOAA site but since February it has not been reporting. Do you if they are going to no longer provide that information. Is there another site that is available for the monthly and annual rain totals. Thank you! Tim
>>> Hi Tim, I believe if you access the link below, and poke around on the various links, you may find what you’re looking for.
https://www.weather.gov/hfo/hydrology
Aloha, Glenn
-
May 6th, 2026 at 11:00 pm
Jerry Says:Hi Glenn,
the cloud patterns late this afternoon seemed rather bizarre. I noticed gigantic cumulus clouds to the east and west with thick banks of fog in between. is there something different about our local weather today?>>> Hi Jerry, indeed, I noticed these very interesting cloud formations as well. First there were those large clump of clouds over Kauai and Oahu, and then that unusual counterclockwise swirl of surface clouds not far to our east, then there were those higher level clouds that were riding up from the southwest, that were clipping the Big Island and Maui at times. The winds have been light the last few days, allowing the local clouds to grow taller than when the winds are stronger. At the same time, we are now transitioning back into a trade wind weather pattern…which typically brings back a more common spring weather pattern. It seems that less and less do we find “normal” weather conditions, and I think this shift will become more and more frequent as we go forward.
Aloha, Glenn
-
May 4th, 2026 at 9:26 pm
Bill Ferguson Says:Glenn
The university of Hawaii just published an article about MJO’s and Hawaii rain fall.
I tried to send a link, but it didn’t work, but I’m sure you’ll be able to find the article.
Bill Ferguson>>> Hi Bill, thanks for the tip, I’ll find it and check it out…I appreciate your thinking of me!
Aloha, Glenn
p.s. I just found the article and read through it…again thanks!
-
April 20th, 2026 at 10:59 am
Suzanne Says:Hi Glenn,
Yes, this is the one.
Thank you so much.
Aloha.>>> Hi Suzanne, good news, glad to have your fav sat image back!
Aloha, Glenn
-
April 19th, 2026 at 4:38 pm
Paula Says:Aloha Glenn I miss.the vog map.Any chance of you bringing it back?
>>> Hi Paula, thanks for letting me know that this vog map was missing…it’s back.
Aloha, Glenn
-
April 19th, 2026 at 11:53 am
Suzanne Says:Hi Glenn,
What happened to the satellite photo, the one that used to be under the big blue?
It hasn’t been there for a few days, it’s my favorite.
Thanks.
Suzanne.>>> Hi Suzanne, I accidentally deleted that satellite image, and couldn’t find it again. Thanks to you I dug deeper and came up with it…at least I think this one is the one that was there!
Let me know if it’s not the one that was there, and is your favorite.
Aloha, Glenn
-
April 14th, 2026 at 11:57 am
robie Says:I just started looking at typhoon Sinlaku, seems like it was created in north west Micronesia just north of the equator. How unusual is that this early in the year? thanks robie
>>> Hi Robie, good to hear from you again. It looks like Typhoon Linlaku, which attained super typhoon status yesterday, begin just north of the equator like you suggest…maybe 5 degrees north of the equator. That seems very low to me. Typically, I’d expect a storm to spin up from 10 degrees north (in the northern hemisphere)…or even further north than that.
Aloha, Glenn
-
April 14th, 2026 at 10:46 am
David Says:Hi Glenn… Is the Sinaku storm you have posted threatening Guam? Could be heading our way? Thank you!
>>> Hi David, no Sinlaku didn’t hit Guam, although came close, moving by about 125 NM northeast. Winds were very strong closer to the center of the typhoon, which was a super typhoon recently. Guam had a close brush, and winds were gusting up to 70 mph with heavy duty rain…along with pounding surf!
Not sure where you are writing from, although if you are in Hawaii, there is no danger from this gradually weakening storm. However, with time, this tropical system could generate swells that could bring high surf to our island chain.
Aloha, Glenn
-
April 9th, 2026 at 6:20 pm
Dennis Says:Aloha Glenn What is your take on the up coming hurricane season for our area? It’s been a while since we had one.
>>> Hi Dennis, what with the El Nino, or Super El Nino, I’d wager that we’ll have a more active than normal hurricane season here in the central Pacific.
Aloha, Glenn
-
April 8th, 2026 at 6:37 pm
Barb Jamieson Says:Hi Glenn, I follow your posts almost daily as it provides me with a look at the west coast of BC also. We come to the islands yearly, mainly Maui, but most recently Kona. Loved the Big Island, and were there just as the First Kona Low was forming. You are now on #3! I live near Vancouver BC, Langley, actually, and we are having a period of lovely sunshine after a wet but warmer winter. You will love Vancouver and all it has to offer. Have a great time and thanks for teaching me so much about weather…Barb Jamieson Langley BC
>>> Hi Barb, great to hear from you up there in Langley, BC! Yes, I’ve been following the weather up your way, and looking at one of the Vancouver webcams. Sunny today and Thursday, and then apparently it turns wetter, although we both have our rain jackets…as we do a lot of walking each day. Indeed, when we are driving up north I’ll use my Iphone’s hotspot for connectivity (I hope), and will be able to do a few updates for this website, in regards to the heavy duty weather impacting parts of the Hawaiian Islands at different times…while we’re on the road.
I’m really looking forward to visiting Vancouver for the next week starting Thursday!
Best Regards Barb…
Aloha, Glenn
-
April 8th, 2026 at 8:02 am
marjorie m classen Says:Aloha Glenn, Glad you are having some good times with great friends. I am not seeing the panel of “Closer Look” in your report today. With another big storm on it’s way having a closer look would be helpful. Thanks for your daily report, every single day, rain or shine, home or away. Aloha, Marjorie
>>> Hi Marjorie, oops…it’s back on the narrative page, sorry about that and thanks for pointing that out! Yes Ma’am, rain or shine, home or away…365 per! I love keeping you up-to-date on the weather in Hawaii, no doubt about it!
Stay safe my friend,
Aloha, Glenn
-
April 3rd, 2026 at 9:08 pm
christine cruikshank Says:Hi Glenn, Are you by any chance staying with a Linda Varonin in Corte Madera?
>>> No Christine, actually I’m staying with Linda N. who lives in both Corte Madera, CA and Haiku, Maui.
Aloha, Glenn
-
April 1st, 2026 at 11:25 am
Jerry Says:Hi Glenn,
I just saw a report the whales decided to stay in Maui this season as it’s getting too cold in Alaska. Any credence to the scientists information?>>> Hi Jerry, I haven’t seen that report, although in these times, who knows what to believe!
Aloha, Glenn
-
April 1st, 2026 at 10:12 am
Joy Webster Says:And Happy April 1st to you too, Glenn. Stay out of trouble over there if possible.
>>> Hi Joy, I guess you’ll be getting your skies out for a slide down the mountain’s leeward side from Ulupalakua to Makena!
Aloha, Glenn
-
March 30th, 2026 at 3:22 pm
Paul Says:Love your site, Glenn, it usually is the most accurate I can find. Today I particularly loved the photo of Waikiki on to the Waianae Mountains. I live on Moku o Keawe now but grew up on Oahu where we lived for many years in the Waianae mountains. I can pick out the ridge where we lived in the photo. Incidentally as a very young guy I had a barometer and used that with visual data from the clouds to predict the weather and did pretty good — but not as good as you do. Thanks so much. Aloha.
>>> Hi Paul, well, your comment made my day! Thanks my friend, I had a barometer as a young kid and a thermometer too, as I got swept away by weather, everything about it…and remain totally into it to this day!
Aloha, Glenn
-
March 26th, 2026 at 10:35 am
Christiane Santoro Says:It’s been raining since last evening in Pukalani and we got well over an inch of rain. I don’t understand why nothing of this showed or is showing on the radar images.
>>> Hi Christiane, good to hear from you there in Pukalani. Hmmm, perhaps the area of rain was too limited to show up on radar? I see from here at my place in Kula, what looks like you’re getting showers this morning in Pukalani, and like you point out, I don’t see radar showing that. I’m sorry that I don’t have a better answer for you. I know the Molokai radar has been out lately, and apparently will be fixed today, although I doubt that that is the reason you/we aren’t seeing the showers on radar at the moment.
Aloha, Glenn
-
March 25th, 2026 at 2:48 pm
Jerry Says:Hi Glenn,
I seem to remember a satellite photo of three hurricanes lined upon a row east of Hawaii a number of years ago. Perhaps this was in 2015? Fortunately they all veered away thanks to the Big Island. Here’s hoping we don’t see that again this year!>>> Hi Jerry, you are correct, that situation was in 2015, and here’s a picture of those three hurricanes:
https://cdn.defenseone.com/media/img/cd/2024/04/08/GettyImages_486169932/860×394.jpg?1712632135
I’m with you, I certainly don’t want a repeat of the summer of 2015!
Aloha, Glenn
-
March 25th, 2026 at 10:55 am
Jill Painter Says:What a block buster day of news on your website this morning. The potential of a super El Niño year and scientific breakthroughs in the creation of materials that can pull moisture out of the air. Thank you for helping to lead us into the future. So appreciate all your Weather work. Mahalo Glenn.
>>> Hi Jill, always good to hear from you! Indeed, a couple of very interesting situations, one is not great, and the other could be very good. Of course anything that is forecast to occur in the future is up for alterations and potential changes.
Thanks for your appreciation of my weather work Jill, you’re always so kind!
Aloha, Glenn
-
March 22nd, 2026 at 3:14 am
John Henry Melancon Says:Glenn, It is 11pm Hawaii time Saturday night and, on satellite/radar, I have been watching showers training over West Maui for hours, some of them intense. With 8 inches having already fallen at Pu’u Kukui as of 9am Saturday morning I can only guess what the totals might be by now. I worry how this may be affecting the burned area above Lahaina, and hope that folks in the path of potential floodwaters have evacuated. The damage in Kihei was bad but this storm is relentless. Praying for Maui.
>>> Hi John, I’m sure that your prayers are welcomed by all the folks here in Hawaii, and particularly Maui County at the moment, that has been slammed by this onslaught of rain the last week! This weather event is unprecedented to say the least! It looks like we’ll finally get some improved weather this coming week, although the clean up efforts will take a very long time!
Thanks for sharing your thoughts John
Aloha, Glenn
-
March 20th, 2026 at 10:40 am
Pali Says:Good Morning Glenn, any reason you can determine why we are seeing so much fog during these Kona weather events? Thank you
>>> Hi Pali, a good question. I assume you live here in upcountry Maui, perhaps someplace between Ulupalakua, Keokea, and upper Kula…or some other higher elevation area on one of the other islands.
Indeed, I’ve seen periods of dense fog here at my place in upper Kula, many in fact over the last week or two. My thought is that there’s been a very humid atmosphere, thus plenty of moisture, and the south and southwest kona winds have been blowing regularly…way more often than normal in fact.
So, as these winds blow up the slopes, carrying low clouds, their bases touch the ground at around 2,500 or 3,000 feet elevation (on up). Thus, when cloud bases touch the ground they become fog. Personally, dense fog is one of my favorite weather elements.
I hope this is what you were looking for as a simple exclamation.
Aloha, Glenn
-
March 17th, 2026 at 10:31 am
Mike Ottman Says:Aloha Glenn,
Thanks so much for the valuable service that you provide to all of us ocean and sun lovers! With your power out over the weekend, you were not able to communicate the rainfall totals from the storm. Do you know the rain totals for Kula, Kihei, Lahaina and Kaupo from the storm Fri thru Sunday? Was it close to a national record in a couple of places?
Much appreciation,
Mike>>> Hi Mike, you’re very welcome my friend! I don’t have those rainfall totals, although heard on the radio that it was the wettest storm in the last 26 years, and as you know, there was serious, very serious flooding in so many places here in the islands…with apparently the worst storm damage here on Maui. I saw that there was an 81 mph gust! I recall another kona storm back in 1980 that blasted the island with 100+ mph winds…the strongest storm that I’ve experienced since moving here 50 years ago.
Aloha, Glenn
-
March 17th, 2026 at 1:27 am
Goofcat Says:Funny how you mentioned EV’s at the end. Our EV (Ioniq 5), powered our house this whole weekend. It kept the fridge on, and some other things. Starlink kept us connected. Here in Kula, we gotta be able to take care of ourselves for several days when things hit.
>>> Hi Goofcat, thanks for sharing your situation here in Kula during the storm. I’ve got to get hooked up to Starlink very soon!
Aloha, Glenn
-
March 16th, 2026 at 8:08 pm
Alex Inselberg Says:As a BEV (battery electric vehicle) owner/operator of 7+ years in western Canada, and in response to your “Here’s Why you Need to Charge your EV More Often in the Cold” article, senior researcher and battery expert Fride Vullum-Bruer did not get into some important details. First and foremost is that most, if not all BEVs now have onboard heat pumps, which among other tasks efficiently warm cold Li-ion traction batteries, and cool them during extreme heat.
Please see the following story for more on the important subject of Li-ion battery preconditioning: https://recharged.com/articles/battery-preconditioning-ev-guideThank you for your always interesting daily weather narrative website!
Alex>>> Hi Alex, good to hear from you again. Thanks for your input, whoever is interested can click on the link you provided, and dive deeper into the details.
You’re very welcome, happy to know you appreciate this humble weather website!
Aloha, Glenn
-
March 16th, 2026 at 4:38 pm
John Morey Says:Hi Glenn, Have enjoyed your site for many years. For something to keep you online…consider a Starlink Mini dish with one of their inexpensive subscriptions. Then get both a small generator but also have a couple of inexpensive lithium batteries that provide the ability to plug the Mini into them directly. In fact, depending on how nonstop you need or do not need connectivity, you may be able to get by with just one or two of the lithium batteries and skip the generator. Just a thought!
>>> Hi John, I like your thoughts, very much! Between you and Dwight, who left a comment here 2-days ago, I’m hoping to get this problem of being forced offline by power outages, handled. This website has been a labor of love for a decade, thus, if possible I’d like to keep the costs down. Thanks for proposing a solution, or a number of different ways to address this issue!
Wondering where you live, it would be great if it were Kula, or at least here on Maui.
Aloha, Glenn
-
March 16th, 2026 at 12:01 pm
Christine Says:Aloha Glenn!
So happy to see you are back with us again.>>> Hi Christine, oh thank you, it’s so good to be back with you and all the rest of the valued readers of this website!
Aloha, Glenn
-
March 16th, 2026 at 10:54 am
Neil Dwayne Swanson Says:Hi Glenn, we missed you while you were down, glad your ok and that your back!
I’m wondering if you can relay to us the precipitation and wind speed highs for the friday 3/13 to sat 3/14 time period. That was the biggest impact day from this storm and you were down, so I’m left wondering just how much rainfall did we record. I’ve never seen anything like the rain that fell during the height of this storm.I live in Kahului, and it was wild.
Aloha
NeilHi Neil, unfortunately I don’t have the rainfall totals that you’re looking for, although the NWS office in Honolulu could probably provide those if you call them. Their number is 1-808-973-5280
They may be too busy when you call, but you ask them when would be a better time to call. I got 21 inches in 2-days here in upper Kula.
It WAS wild!
Aloha, Glenn
-
March 15th, 2026 at 1:38 pm
Helen Says:Aloha Glenn!
I hope you are okay in all this weather!
Thanks for all you do!
Take care 😊>>> Hi Helen, always good to hear from you. Thanks for your well wishes, and of course you are very welcome, even though I was offline during the height of this very unusual Kona storm!
Aloha, Glenn
-
March 15th, 2026 at 12:59 am
Gary Elster Says:Glenn:
missed you today. Assuming you had power failure like a lot of Maui, except Wailuku Heights where I live. I have to tell you about the extraordinary rainfall I recorded from 1 pm yesterday until midnight (8.5 inches) and from midnight until 8:30 pm today (12.5 inches) which is a total of 21 inches in about 21 in about 31 hours. Normally, most rain storms get pulled into Iao valley which is close by but this rainfall was historic by any standardsaloha
Gary>>> Hi Gary, thanks for sharing what was going on for you there in Wailuku Heights! I got 21 inches in two days, it was incredible…and with all the blasting wind too!
Aloha, Glenn
-
March 14th, 2026 at 5:04 pm
Dwight Says:Hi Glenn,
Such a shame to see you offline during this most significant event this year. Would love to hear your comments. Gotta get yourself a fiber link or Starlink and a UPS or Gen for these events.
Aloha,
Dwight>>> Hi Dwight, indeed, the most significant storm this year…at least so far. I’m looking into getting something that will keep me online during these types of extreme events.
I’ll get in touch soon via email
Aloha, Glenn
-
March 14th, 2026 at 4:00 pm
Dan Kelly Says:Hi Glenn,
I have been looking at your site forever. Even the TV days.
I was wondering about the historical rain fall for this storm here on Oahu. How does the amount we are getting compare to previous storms, years ?
Thanks,
Dan>>> Hi Dan, good question, if I come across the numbers you are looking for, I’ll add them to this narrative page. I could go so far as to say this storm was a real humdinger…I’ll go that far. I received 21 inches here at my place in 2-days!
Aloha, Glenn
-
March 14th, 2026 at 1:55 pm
Troy Rosenbush Says:Aloha – I’ve been geeking out on technical discussion at the PRH NOAA HNL website. Interested in learning more about exotic (to the layman at least) weather terms like jet streaks, negative tilt, etc. Found your website and I’ll be following regularly. Are there other good resources for learning about the factors that drive our North Pacific weather? Mahalo sir
>>> Hi Troy, haha geeking out, good way of putting it! I’d say a good start would be to check out this website:
https://www.weather.gov/otx/Full_Weather_Glossary
Personally, being a weather geek myself, I find all of this very interesting too!
Aloha, Glenn
-
March 14th, 2026 at 3:13 am
Bill Ferguson Says:Jana and I have lived on Maui for 18 years. We have never seen a storm like this. It’s 11:00 PM and we’ve had 7.73 inches of rain since 11 o’clock this morning. We just got a warning for flash floods in Kahului. It looks like Kihei is in terrible shape. All of us need to get involved in helping folks that have been affected by this terrible Kona storm. I need to send this now because our lights are flashing. I’m praying for everyone on this island.
>>> Hi Bill, very well put, as this storm really took its toll on the state of Hawaii! I know that feeling of having the power go down, as ours here in upper Kula did just that for days! I hope your power is back on now, and mine came back on last evening. I’m sure your prayers were much appreciated!
Aloha, Glenn
-
March 13th, 2026 at 10:57 pm
Susan Says:Aloha Glen,
I was wondering if the rainy blustery weather we are having now in Hawaii will eventually make its way over to California.>>> Hi Susan, this is a good question. However, No, this kona storm won’t make it’s way over towards California. California will remain generally high and dry, and way warmer than normal for this time of year…at least for the time being!
Aloha, Glenn
-
March 13th, 2026 at 10:28 pm
Gerhard Says:Aloha Glenn,
I am currently with you and the community in this storm, 3095 Omapoio Rd. If you wish I can help you with solar, batteries, getting off-grid. No commercial interest.>>> Hi Gerhard, oh my, thank you, I will be in touch with you soon, I’d really like to take a step towards keeping my website going during these unusual weather events…really a great offer!
Aloha, Glenn
-
March 13th, 2026 at 3:13 pm
Chico Says:Glenn, mahalo for keeping the community informed and safe.
>>> Hi Chico, you’re very welcome, it’s my pleasure…it’s my life’s work.Man oh man, there are wind gusts in the mid to upper 60 mph range near noon today (Friday)!
Aloha, Glenn
-
March 12th, 2026 at 12:58 pm
Brad Smith Says:Aloha Glen from the hillside above the church in Waialua on Molokai. We measured 4.37 inches in an approved rain gauge for 24 hours ending at 6:30 Thursday AM. 4 of those inches came betwern 4 AM and 6:30, so that’s close to 2 inches per hour. The deer denuded hillsides cannot retain the mud.
Heavy flooding with mud everywhere. We hope to get out later and assess the damage and prepare for the next rounds. We received 1.7 inches the day before. Hope you are well. I bet traffic is way up on your indispensible website. All the best.>>> Hi Brad, oh boy, so sorry to hear of all the water over there on Molokai! Geez, that’s quite a deluge for sure! Then, of course as you know, we have way more rain coming!!! Sending my best wishes to you Brad, stay safe…and to all the folks on Molokai, as we make our way through this very unusual weather event!
Aloha, Glenn
-
March 11th, 2026 at 1:19 pm
RAYMOND MYERS Says:Hi Glen, Have you thought about having a Battery backup for your electrical needs? Costco has been stocking various Solar powered units. A good one is the ECO-Flow Delta Pro. No Gas or fumes and noise. Blessings Be, Ray
>>> Hi Ray, thanks for the good idea, I’ll look into this unit!
Aloha, Glenn
-
March 11th, 2026 at 1:50 am
Ian A. Masterson Says:Glenn, love you brother! After all these decades I can pop on and see you posting only 40 minutes ago to keep us informed on the latest weather updates.
Mahalo, we can give you updates on Oʻahu if it helps… for now still just dripping occasional raindrops, but we were getting cold kona gusts this afternoon and giant freezing raindrops falling sparsely while we were surfing Kūʻau, Oʻahu, just my boy Finn and I. It was a dreamy 2-3 ft on the sandbar sets, long peeling rights, deep purple Brewer Singlefin just soaring along the clear crisp water! Very intimate moment with the waves and my teenage surf grom!
Aloha nui, Ian ʻAkahi>>> Hello my old friend Ian, really nice to hear from you again! Good to hear that you’re still slicing through the wave faces on your single fin surfboard!
Thanks for the offer to provide updates on your weather there on Oahu. Sure, if something unusual happens let me know.
Best to your wife and the rest of your family…been such a long time that we’ve had the pleasure of being together.
Stay safe bro, Aloha, Glenn
-
March 9th, 2026 at 6:50 am
Jessica Says:Hi Glenn, I’ve been reading and doing my research and all the locals say they often turn to you for accurate weather forecast. The weather is looking alarming from a visitor standpoint. (Visiting Maui 3/10-3/16) There’s a big difference between being bummed that it’s going to rain on my vacation and genuinely concerned for safety. How severe is the weather alert? Some posts have me worried.
>>> Hello Jessica, thanks for your comment. It’s true, we have a dangerous storm taking aim on our islands! I think your concern is valid. Here’s the latest weather outlook:
Prolonged and Powerful Kona Storm To Bring Numerous Impacts Across Hawaii This Week into the Weekend
A high-impact and potentially life-threatening weather pattern will unfold across Hawaii this week, as a powerful and slow-moving Kona Low develops northwest of the state. This system is forecast to bring a prolonged period of torrential rainfall, areas of flash flooding, damaging “Kona” winds, and potentially severe thunderstorms with large hail. The combination of a deep upper-level trough and a plume of deep tropical moisture will result in statewide impacts beginning Tuesday across the western islands, spreading eastward and persisting through the upcoming weekend.
In terms of the guidance, the global models and their respective ensembles remain in remarkably good agreement regarding the large-scale evolution of this event. Kauai will experience the initial arrival of heavy rain and embedded thunderstorms, with the activity spreading eastward to Oahu and Maui by Wednesday. Severe thunderstorms will be possible Wednesday. Flash flooding is a primary concern as rainfall rates may exceed 2-3″ per hour within the strongest bands.
During Days 4-7 (Friday through next Monday), the concern will be with the likely additional heavy rainfall overtop already saturated soils. While the guidance suggests a potential brief lull on Thursday, a second, more vigorous trough is expected by Friday. Friday into Saturday also appears to be the window with the greatest severe weather risk, with potentially damaging southerly winds (50+ mph gusts) on northern and eastern slopes. Lastly, the latest model output continues to indicate an extreme to climatologically rare event for the month of March in Hawaii. These values suggest that the high-end potential of this Kona storm is significantly outside the realm of “normal” wet season weather.
Sorry for the bad news in regards to your vacation!
Aloha, Glenn
-
March 6th, 2026 at 8:49 pm
Thomas Says:Hi Glen! Thanks for the detailed forecast, I’ve been tuning in ahead of our visits for the past five years. My family is headed to Maui (Wailea) next week, starting Monday Mar 9. I know you can’t pinpoint anything nor offer any precise estimates of rainfall and timing, but I was wondering if you could share your general thoughts on how widespread this upcoming system could be? Across most-likely and worst-case scenarios, are we talking widespread, prolonged rain over the course of several days with steady cloud cover between rain events, or would it be more likely that rain showers are isolated and intermittent with periods of sun in between? I’m trying to get a sense of whether next week could be a complete washout or if we could see some decent weather in between periods of rain. Thanks so much!
Thomas
>>> Hi Thomas, I totally understand your concern with the upcoming inclement weather conditions next week. Here’s the latest information available:
HEAVY RAIN AND FLASH FLOODING POSSIBLE FROM LATE MONDAY INTO NEXT
WEEKEND…A strong low pressure system will develop northwest of the state
over the weekend, bringing deep moisture into the area. The
potential for heavy rains, thunderstorms, and flash flooding will
develop over Kauai County late Monday into Monday night, spreading
eastward to the entire state Tuesday and Wednesday. This potential
could easily last into next weekend, and perhaps even beyond.It is too soon to forecast rainfall totals or exact timing and
locations of maximum flash flooding potential. Stay weather aware
over the weekend as this system comes into better focus and details
become available.Now would be a good time to clean out storms drains and culverts, or
anything else that can block the flow of water.Aloha, Glenn
-
March 5th, 2026 at 4:01 pm
Joe Says:Hi Glenn. My family and I are booked to come to Disney Aulani next Tuesday until the following Thursday. Weather apps are showing significant rainfall next week up to 100mm in one day. That’s a lot where we’re from and would cause significant flooding and other issues. Should we be concerned??
>>> Hi Joe, I understand your concern, as the models are showing unsettled and sometimes wet weather later next week, and perhaps even extending into the following week. This is about as accurate as I can put it at this moment:
Clarity on timing for each island and magnitude of rainfall, including potential rain rates, will
come during the next few days as the event draws nearer and especially once it enters the hi-res model window. Worth noting that instability appears marginal-at-best at this time which should at
least mute thunderstorm potential. Regardless, a potentially long-lived flash flood threat is poised to manifest over the islands next week and possibly into early the following week.I know this doesn’t exactly calm your nerves, and doesn’t give you very long to potentially change your plans, although it’s the most recent information available at this time.
Aloha, Glenn
-
March 5th, 2026 at 2:06 pm
Ray Says:Aloha Glenn! We’ve traveled to Maui a few times over the years and your weather narrative is always the first thing I read each day. I find the weather variations around the islands fascinating.
We have been looking forward to our trip to Poipu on Kauai on Sunday for a week to get a break from the Alaskan cold, but the upcoming weather has us wondering if we should be rethinking our trip for next week?
Specifically the “long-lived flash flood threat” is somewhat unsettling, as well as the elevated winds and inches of rain I’ve seen on in reports. I’m not really sure what to make of this. Is this a rain and then maybe shine during the day? Or this extreme weather we should be avoiding?
Just a cold Alaskan searching for some sun, thanks for all you do!
-Ray
>>> Hi Ray, good to hear from you. I totally understand your concerns about inclement weather next week. It’s still a bit too early to nail down the particulars, although the following is the latest update that I have:
Clarity on timing for each island and magnitude of rainfall, including potential rain rates, will
come during the next few days as the event draws nearer and especially once it enters the hi-res model window. Worth noting that instability appears marginal-at-best at this time, which should at
least mute thunderstorm potential. Regardless, a potentially long-lived flash flood threat is poised to manifest over the islands next week and possibly into early the following week.I know this doesn’t give you very long to potentially change your plans, although it’s the most recent information available at this time.
Aloha, Glenn
-
March 1st, 2026 at 1:29 pm
Aggie Says:Aloha Glenn. Being able to access your weather outlook early in the morning is invaluable. However, your post at 3:17am today may have been somewhat beyond the call of duty! Get some sleep. We all need you to be healthy and well-rested! As always, thanks for everything you do!
>>> Hi again Maggie, good to hear from you again as always. Thanks for your positive feedback! Actually, some of the information that I use on this website was issued at 317am, although I process it a bit later in the early morning than that. I’m getting enough sleep, no worries, and I’m healthy too.
Aloha, Glenn
-
February 28th, 2026 at 12:51 pm
Robert Says:February 28 planet parade? Some light on the subject …
The internet is packed with claims that you can see a spectacular lineup of six visible planets on February 28! These claims aren’t entirely accurate. Venus, Mercury, and Saturn will be vey low in the western twilight, and have been there for a couple of weeks. Binoculars would be helpful, look for the steady glow of a planets reflected light. Jupiter is bright over head, Neptune and Uranus not at all visible, naked eye. Mars is in the morning sky and … something truly spectacular- late Monday night, early Tuesday morning – a total Lunar Eclipse visible right over head -partial eclipse beginning just before midnight, totality for 58 minutes 1:04 AM – 2:02 am. Binoculars will be helpful to see the subtle shading and color changes while the moon is in the earth’s shadow.
Roberto-Space science guy.>>> Roberto, thank you my friend for the clarification!
Aloha, Glenn
-
February 27th, 2026 at 11:51 pm
Jerry Says:I thought you and your fans would be interested in the planetary alignment tomorrow. Six planets potentially visible. Any thoughts where on Maui would be best to see them?
>>> Hi Jerry, thanks, as for the best place to see this event, I’d say anywhere on the leeward sides of the islands, from sea level on up to the top of the Haleakala Crater. Let’s hope that the afternoon clouds clear quickly around sunset, and that there aren’t too many high cirrus clouds around as well.Aloha, Glenn
p.s. I’ll add a bit of information on my Narrative Page.
-
February 23rd, 2026 at 2:23 am
Christiane Says:Mahalo, Glenn, for getting the color legends back! Appreciated!
>>> Hi Christiane, you’re welcome, it took me a while to figure out the issue, although recently I stumbled upon the problem. Aloha, Glenn -
February 21st, 2026 at 11:17 pm
Christiane Says:Is miss the color legend next to the “watches/warning” map. Any way to bring that back?
Mahalo!>>> Hi Christine, thanks for your prompting, and many other folks too, and I’m glad to report that I finally figured out what the problem was…and the color legend is now back in place!
Aloha, Glenn
-
February 17th, 2026 at 7:36 pm
George OToole Says:Dear Glenn,
Thank you for your website. I have been a fan for the past 15 years. My wife and I are planning on flying over on Thursday the 19th to the 28th. We are staying in Wailea and are concerned with forecast. We are fortunate that we can be flexible and cancel/ reschedule our trip for later next week. Do you have an opinion that you are willing to share?
Mahalo,
George
>>> Hi George, I appreciate your letting me know of your long time viewership! Good to hear from you with your valid question. The forecast doesn’t look all that bad to me for the first part of your vacation…as Wailea is one the driest places on Maui. If it was me, I think I’d stick with your current trip. However, as we all know, the weather can be changeable, even with the best forecasts into the future. If you decide to come this week, or perhaps next week, I hope you have a great vacation!
Aloha, Glenn
-
February 16th, 2026 at 1:49 pm
Doc John Says:Glen, Really love your daily weather narrative especially since we are neighbors and I’m always interested in the morning temperature! However, I have been missing the color codes as to high wind advisories, flooding, small craft warnings,efc? Is this a problem on my end?
All the best.
John>>> Hi John, no it’s not a problem on your end. I used to be able to put those color codes on my narrative page, although something happened in my editor and I’m unable to add those. I’ve tried and tried, but can’t figure out what the problem is. Perhaps there’s someone reading this that’s a technical person that knows WordPress Editors better than I. If such a person is available, could you please email me and we can try and figure out this situation. Until then John, please bear with me, I like to add those to the narrative page. I have a hunch that this is a very simple problem to solve.
Aloha, Glenn
ps enjoy your bike rides on Crater Road!
-
February 15th, 2026 at 9:39 pm
Roger Says:Aloha Glenn,
Best One Yet!
“Weather Wit of the day: Snow Removal Budget – Slush Fund”
I love reading your site daily and still miss those 7:45AM daily TV updates.
Aloha, Roger>>> Hi Roger, thanks for your positive feedback, it feels good to read your words!
Glad you like these silly weather wit’s on a daily basis!
Oh yeah, my old TV weather show I did from the college, that was very fun for me, I was sad to give it up, but I had too many things going on in my life, and I began working full time at the Pacific Disaster Center in Kihei, and I was living here in upper Kula…lots of driving!Best regards my friend, Glenn
-
February 12th, 2026 at 1:47 am
Alisha Says:Hello we are planning on arriving next Wednesday 2/17 until 2/25 do you feel we need to postpone this trip due to the recent conditions in Maui? We are staying near Lahaina for some of the trip and the rest near the Hyatt Andaz.
>>> Hello Alisha, nice that you’ll be vacationing here on Maui! At this point, I don’t see any problems, and if it was me, I wouldn’t feel the need to cancel my trip. Forecasts only go out until next Wednesday however, so to be honest, I don’t know what will be happening thereafter. You can use this link to follow what’s coming up as it gets closer to your departure date. Have a great vacation!
https://www.hawaiiweathertoday.com/maui.php?zone=HIZ018
Aloha, Glenn
-
February 11th, 2026 at 1:50 pm
Caroline Woodham Says:Hi Glenn
Have the recent rains, eased the drought in Maui County.Thanks
>>> Hi Caroline, yes, as a matter of fact these last couple of rain storms have taken the edge off the long lasting drought here in Maui County.
Aloha, Glenn
-
February 10th, 2026 at 11:38 pm
John Henry Melancon Says:Aloha Glenn, I saw on your site a day or so ago that a station on Maui recorded over 16″ of rain! Is there a site where those totals can be found? Or if not, an archive of your site where I can look at that report again? Thanks for all you do.
>>> Hi John Henry Melancon, good question. There is a site that gives rainfall totals, which is updated every hour: https://forecast.weather.gov/product.php?issuedby=HFO&product=RRA&site=hfo
I trust this will meet your needs.
I appreciate your positive feedback!
Aloha, Glenn
-
February 9th, 2026 at 3:10 pm
Patti Says:I just wanted to thank you for your incredibly informative site. When we lived on Maui, we checked it every day, and now we do that as well before and during visits to see friends on the island. As the wind howls in Ma’alaea, I feel cozy inside for now and love all the weather patterns that come through. Thanks for your diligence, kindness and knowledgeable forecasts/explanations.
>>> Hi Patti, very nice to hear from you, thank you for your positive feedback, I greatly appreciate it! We all, at least here in the Hawaiian Islands, got to ride out quite a robust winter storm! There were a few times that the winds and rains were a bit intimidating, although for the most part I enjoyed this usually strong weather system.
Be well, Aloha, Glenn
-
February 7th, 2026 at 2:43 pm
Marge Says:For those of you missing the color codes with the warnings, here is a link to the graphic with the key:
Good luck with the storm, Glenn. We depend upon you for information to keep us connected and knowledgeable. It is so helpful being able to go to one site to find out what is coming our way.
Thank you so much, Marge
>>> Hi Marge, good hearing from you again! Thanks for your positive feedback! Stay dry and safe as we move through this potent winter storm!
Aloha, Glenn
-
February 4th, 2026 at 12:42 pm
moondog Says:Thanks Glen for your forecasts. I totally forgot about them after being here 2 months with 2 months to go. Someone reminded me of them today and I’m thrilled to be on board especially with the big weather event happening this weekend!
>>> Hi Moondog, welcome back, buckle up for this big weather event that is taking shape!
Aloha, Glenn
-
January 27th, 2026 at 11:43 am
Graham J Smith Says:Hi Glenn. How concerned should we be by the proposed discontinuation of the National Weather Service Hawaii State Forecast product? Many thanks for your advice.
https://www.weather.gov/hfo/sfpcomments2026
>>> Hi Graham, this is the first I’ve run across this issue! Somehow I can’t imagine that the NWS would discontinue this important service, although in this day and age, who knows what will happen next!
Glenn
-
January 23rd, 2026 at 2:24 pm
James Campbell Says:I’m also here in Kula…wish we were getting some rain.I call it the “not rain”
>>> Hi Jim, indeed, lots of rainy looking clouds around, although as you point out, Kula has missed most of the rain lately. In contrast, the rain gauge in Wailuku is showing that they have received 2.50″ of rain, and most of the precipitation has been along the windward sides.
Aloha, Glenn
-
January 23rd, 2026 at 12:48 pm
Bill Ferguson Says:My wife and I live in Kahului and we have had 1.1 “ rain in the last 2 hrs 1.31 “ since midnight. We just got a flash flood warning for Kahului and Wailuku. The Automated Hydrologic Observation Sta Report (AHOS) is showing very little rain along with the airport showing .7” of rain. Is there an accurate place to see what the rain totals are on Maui?
>>> Hi Bill, lots of rain! Yes there is a place you can get hourly updates on the latest rainfall amounts:
https://forecast.weather.gov/product.php?issuedby=HFO&product=RRA&site=hfo
Aloha, Glenn
-
January 15th, 2026 at 9:13 am
Helen Says:Pleased to report it is raining ☔️ cats 🐈⬛ and dogs 🐕 here ! !
>>> Hi Helen, it is reported here, thanks for letting us know! The cold front recently went through my area too, and we got a good quick soaking early this morning.
Aloha, Glenn
-
January 10th, 2026 at 5:28 pm
robie Says:Hey Glenn, Thanks for the December weather Synopsis.
>>> Hi Robie, you’re welcome.
Aloha, Glenn
-
January 6th, 2026 at 11:55 am
timothy kodysh Says:glenn
south point area hawaii here reporting
9 inches in the rain gauge this am 1/6/26>>> Hi Timothy, WOW, incredible about of rain!!! Thanks for letting us know!
Aloha, Glenn
-
January 5th, 2026 at 12:42 pm
Kathy Matulewicz Says:Aloha Glenn – been viewing your website for many years and appreciate all you do. I am in Kaanapali and wonder if it is more humid than normal. I have had to put bags of “damp rid” in my closets that I do not usually have to do. Could it have something to do with the volcanic eruptions?
>>> Hi Kathy, good question! Actually, as you noted, it has been somewhat more humid than usual over the last several days. This has been caused by the winds coming out of the deeper tropics, which is carrying muggy air up over us. This isn’t particularly unusual for this time of year, as January is the month with the least number of days with the trade winds blowing.
Hang in there, Aloha, Glenn
-
January 5th, 2026 at 11:23 am
Jerry Durkan Says:I miss the referring colored list that used to match and show below the colored map with the link to watches, warnings etc. As the list grows, it always strikes me how our local weather can go from benign to malicious. The more colors, the more interesting the weather. Btw while a freshman in college (1970!), my roommate majored in meteorology and would study the charts and we would get very excited when hurricanes and other foul weather would arise.
>>> Hi Jerry, good to hear from you. I’ve begun putting your requested color maps back on the narrative page.
Oh yes, I was a freshman in college back then too, and I had a friend, we were both taking meteorology and climatology classes, and we both got all worked up when we had inclement weather conditions on the horizon!
Aloha, Glenn
-
December 29th, 2025 at 6:41 pm
John Ransford Says:Miss your Friday movie reviews from the old days. Mahalo for your timely weather reports and science links. Aloha, John
~~~ Hi John, that’s a long time ago when I regularly used to go see films on the big screen. I was working in Kihei at the time, for the Pacific Disaster Center, and on the way home I used to stop for dinner and then the films on Friday’s. I’m still working for the PDC, although now work remotely from home.
I’m happy that you utilize my weather reports and enjoy reading the Interesting science articles at the bottom of my narrative page!
Happy Holiday’s John!
Aloha, Glenn
-
December 26th, 2025 at 12:38 pm
miles valle Says:aloha glen – took an iphone picture of a double moonbow last night from haiku (north shore maui) was a first for me – am wondering if your interested in using it on you website – hopes you stay ire
~~~ Hi Miles, thanks for thinking of me and my website, as a place to show the picture of your Haiku moonbow! Unfortunately, I can’t just copy and paste an Iphone picture into my wordpress website editor…it has to have a unique URL.
Aloha, Glenn
-
December 16th, 2025 at 4:05 pm
Emanuel Says:Hi Glenn,
Great weather site! Thank you for the helpful info. For the remainder of this week, do you think it will be more sunny and dry in Maui (Wailea area) vs. Honolulu?
Looking at your reports, it seems so but want to confirm.
Thanks for your helpful site!
>>> Hi Emanuel, good to hear from you. I’d say you are right on, I’d pick Wailea, Maui over Honolulu in terms of drier and sunnier weather this week.
Thanks too for your positive feedback!
Aloha, Glenn
-
December 16th, 2025 at 2:03 pm
Brad Smith Says:Seasons Greetings Glen from Molokai. Our current weather pattern seems unusual. It got me thinking about what are the defining characteristics of a kona low or kona storm. Can you elucidate?
>>> Hi Brad, good to hear from you there on the Friendly Isle of Molokai. Good question…the truth is that they are one and same weather situation. A Kona low or storm typically forms to the southwest, west, or northwest of the island chain.
In brief: Kona storms (also called Kona lows) are a type of seasonal cyclone in the Hawaiian Islands, usually formed in the late fall into winter, from winds coming from the westerly “kona” (normally leeward) direction. They are mainly cold core cyclones, which places them in the extra-tropical cyclone rather than the subtropical cyclone category. Hawaii typically experiences two to three annually, which can affect the state for a week or more. Among their hazards are heavy rain, hailstorms, flash floods and their associated landslides, high elevation snow, high winds which result in large surf and swells, and waterspouts.
I hope this is enough to address your question.
Aloha, Glenn
-
December 13th, 2025 at 7:07 pm
Marge Kelm Says:Appreciate having the wind direction with the gusts. Thanks for adding it.
~~~ Hi Marge, good to hear from you again! Yes, when we get into the late autumn and winter season, and we finally have something other than the typical trade winds, I like to provide the wind directions…it seems more meaningful.
Happy Holiday’s my friend.
Aloha, Glenn
-
November 20th, 2025 at 10:54 am
Paululi Says:Thank you for the surf report, we used to use the weather radio before the internet days. Continue to report conditions for Honoulimaloo, which is spelled a number of ways, my old surf spot in the 70’s…Pauli
~~~ Hi Paululi, you’re welcome, and I used to use the weather radio too, it definitely filled the bill, that is until the internet came along!
Aloha, Glenn
-
November 10th, 2025 at 6:02 pm
Mike Says:Hola Glen,
We stayed at Sea Ranch too a couple of years ago at this time of year. We loved it there.
We had a few rainy days but not a storm like we had hoped for.
I especially liked the remote control fire places.
Aloha. Mike>>> Hi Mike, yes, I love it here, AND we’ve got a significant storm that’s going to arrive the last 3 days that we’ll be here. We’ve been here 4-days so far. The last several days have had essentially no wind with glassy ocean conditions, which is great…as it can be windy at times.
Aloha, Glenn
-
November 10th, 2025 at 11:01 am
Paliuli Says:Aloha kakakiaka Glenn, just read the Rutgers article, where they admit to wanting to perform SAI maneuvers to ironically cool the atmosphere to somehow “impact protein levels of the four major food crops”. How I read this is: science will cause anthropogenic global cooling to offset anthropogenic global warming, but they pose the scenario as a future intervention. We have been witnessing what appears to be SAI flights here on Maui; on Saturday, while surfing Hookipa, I watched to jets flying east to west, one after the other, releasing something into the atmosphere. These are not condensation trails which we rarely see here in Hawaii…the first such trails(con-trails) I saw as a kid in Nevada back in the 60’s along with sonic booms, from jets, such as SR-71’s, had taken off from Nellis Airforce base on the Nevada Nuclear Test Range, where my dad worked as a scientist studying the ecological effects of nuclear weapons testing on the environment around Jack Ass Flats, where they shot off 100’s of devices. I don’t think the trails we are now witnessing are “flak”, which has been used in military radar experiments. It could be experiments relative to the Maui Space Surveillance Complex, which would have national security motives, thus kept secret, those SR-71 flights my dad pointed out to us kids. Others suggest nefarious substances and compounds. Our eyes are not lying, but some one is, or just not telling the truth, concerning these overhead occurrences. Never a mention of it in Maui News to ease the concerns of the people. Most folks seem clueless about it; others automatically call them “chem-trails”. What say you? Aloha
>>> Paliuli, thanks for your long response to today’s Interesting article. You know I’m out on the north coast of northern California, not far south of Point Arena. I read your comment twice, and my most simple response is that there may be such a thing as chem-trails, although when I see those trails of condensed moisture coming out of the backs of jets at high altitudes, I think of them as con-trails personally. If anyone else has opinions, feel free to voice them here, and I’ll post them.
Aloha, Glenn
-
October 29th, 2025 at 8:43 pm
timothy kodysh Says:waiohinu s point hawaii observations
rain gauge showing 1.25 inches in 48 hours
steady rain in the last 24 hrs added .6 of that
today was wet from dawn but midday a bright sunny spell of nearly
an hour
then clouds and drizzle through this afternoon
temps hovering near 70F (altitude 1250′)
enjoy oregon….>>> Thanks four Big Island report Timothy!
Aloha, Glenn
-
October 28th, 2025 at 10:49 am
Helen Says:🙏🙏🏼🙏🏾🙏🏾🙏🏿
Prayers for 🇯🇲
I have been watching Melissa on the Wind profile on your site.
Yikes>>> Hi Helen, indeed…YIKES!
Aloha, Glenn
-
October 27th, 2025 at 11:32 am
Pali Uli Says:Aloha kakakiaka Glenn, the bee article on H2O2 was right in my bee-keeping viewfinder, very interesting! Bees evolved along with the flowering plants (angiosperms), which appeared about 65,000,000 years ago, same as the bamboo, according to the Urantia Book pg 690. My wife sells all the Haiku honey we don’t eat to our friends. You should try it! Great forecasting. Pali Uli
>>> Hi again Pali, thanks for your latest comment about bees and bamboo!
Aloha, Glenn
-
October 25th, 2025 at 7:18 am
Kula Andrew Says:Aloha Glenn, where exactly is the Na Kula weather station located? Been some pretty strong gusts recorded there as of late. Thank you as always for your tireless efforts, even when you are off island!
Mahalo from upper Kula, Andrew.>>> Hi Andrew, that’s a good question, as it’s a new gauge, and is located not far upcountry along the backside of east Maui. It’s placed in a location that picks up the strongest winds when the trade winds are blowing.
You’re very welcome, I appreciate your support!
I’m in Marin County California as you know, and we’re receiving some nice rain this morning!
Aloha, Glenn
-
October 24th, 2025 at 7:19 pm
robie Says:Interesting thanks for the dry season, wet season synopsis.
robieHi Robie, you’re welcome, I was glad to present them, which came from the NWS office in Honolulu.
-
October 24th, 2025 at 11:47 am
Pali Uli Says:My bad Glenn, I typo-ed Honouliwai on my previous post to you, that “u” is in both Honouliwai/Honoulimaloo, as it is recorded in the “Hawaiian Place Names” website. Language demands accuracy for meaning and understanding–insight for the day. Be well.
~~~ Hi again Pali, thanks again…Aloha, Glenn
-
October 24th, 2025 at 11:39 am
Pali Uli Says:Good Morning Glenn, I was in Marin county last year when it was 100 degrees for a week, I really enjoyed it…your site is one of my morning web searches, really appreciate your work…however, and I don’t mean to harp, but, according to the Hawaii Place Name site, the gulch I used to live in is spelled, Honoulimaloo. Place names mean a lot to some Hawaiians, for example. Jaws, the Nic-name for the surf spot famous for big wave surfing, has the place name where surfers enter the line up to surf the right, is the stream of East Kaupakalua, and the Point where the left of this famous wave is called, Manawaiiao. This wave has been called “whales”, “domes”, and finally “Jaws”, and Peahi is really a Nic-name too, which I can prove, cause I know who named it that, around 1994-95, but most folks are clues about these surf culture facts. “Sunset”, the other famous surf spot on Oahu, is Paumalu, for example. The surf spot between Honoliwai and Honoulimaloo is called Pohakuloa, but we just call it “Rock Point”, which is the non-place name of this not so famous wave. Now you know. After surfing Hawaii since ’73, this has significance to some of us; Waimea, is both place name and Nic-name, only a fool would call it “Waikiki”! But you are no fool, so keep up the good work, Aloha kakahiaka, Pali Uli.
~~~ Hi Pali, thanks for your long comment!
Aloha, Glenn
-
October 18th, 2025 at 1:29 pm
robie Says:Yeah, finally almost an inch of rain in Haiku. Thanks for your site. robie
>>> Hi Robie, good news, that should turn the grass green!Aloha, Glenn
-
October 13th, 2025 at 1:58 pm
robert Says:aloha Glenn
I live in Hawi and not getting any significant rain. Super dry.. Get threatening clouds ,but no rain. Watching the radar, non of moisture not dropping down to Hawaii Island..What’s up with that ?
Mahalo Robert
>>> Hi Robert, good question. I’d say that the primary reason is that the trade winds have been so light or even absent for quite a while. As we know, typically the trade winds often bring showers to the windward sides, and sometimes on up into the north Kohala District as well. Sometimes too, the remnant moisture from a retired tropical cyclone, can bring showers to the Big Island from the east…we haven’t had many of those this year. Otherwise, moisture carried your way on SW Kona winds can bring you rain at times too, however, nothing much of that either. About all I can say at this point is, hang in there, we’re now into our so called rainy season, so hopefully you get some significant rainfall one of these days!Aloha, Glenn
-
October 12th, 2025 at 12:26 pm
Capt. Lee Cutler Says:Thanks for including the Mauka Showers ,,,
Great local Info ,,,
Aloha Capt. Lee ,,,
>>> Hi Capt…
You’re welcome, and I agree
Aloha, Glenn
-
September 27th, 2025 at 12:08 pm
Maggie Says:Aloha Glenn.
We’ve seen the driest 3 month interval that I can remember here on Maui’s north shore. Long established plants and trees, including my coffee orchard, are beginning to fail. Are you seeing anything in long run forecasting models that hint at an eventual return to more typical moisture conditions?>>> Hi Maggie, it’s so true, it’s dry dry dry. Unfortunately, I don’t see anything significant in terms of wet weather for your north shore through the next week. There will be some passing showers, although not enough to take the edge off the current dry conditions.
I will say, that once we reach our so called rainy season, in some years later October, or more likely November, we hopefully will grade back into our more typical moisture conditions.
Aloha, Glenn
-
September 26th, 2025 at 9:27 am
PALI ULI Says:Glenn, sorry, but its Honoulimaloo, where I once lived. thanks
>>> Hi Pali, I’ve been using the spelling that’s on the National Weather Service website: Honolimaloo
I don’t mean to imply that yours isn’t the correct spelling however!
Glenn
-
September 25th, 2025 at 8:19 pm
watermark Says:Glenn, you absolute gem! Your weather forecasts are more like a daily dose of a good, old-fashioned Hawaiian hospitality. You make the chaotic world of meteorology seem like a warm, sunny day in Kula. Keep up the excellent work, and remember, no matter the forecast, always wear your sunscreen! Aloha!
~~~ Thanks for your kind and thoughtful message!
Aloha, Glenn
-
September 9th, 2025 at 3:13 pm
Ki Love Says:Aloha Glenn,
Please tell me that we’re going to get some good rain with this Kiko system. No rain yet! We need it so badly so I’m really hoping that it happens. Please share your thoughts on the matter. Mahalo!~~~ Hi Ki Love, unfortunately, Tropical Cyclone Kiko passed by a bit too far north for it’s associated rains to reach us directly. Kiko’s passage has curtailed the trade winds, and this may help to wring out some showers over and around the mountains in the afternoons. The air mass in general is quite moist and unstable, so when the trade winds fill in behind the departing Kiko, they should bring some showers to the windward sides as well. Otherwise, it looks like our dry weather will stick around, which as you point out, isn’t good news!
Aloha, Glenn
-
September 8th, 2025 at 12:27 pm
Jon Says:Aloha Glenn…
Do to arrive Napili 9/11-19.Seeking calm, clear water in the bay for snorkeling & SUP.
Concerned with Kiko…been there done that just a few years back…not fun. Run off was substantial.Do you recommend we push vacation to 9/20…or maintain current schedule??
Mahalo,
Jon~~~ Hi Jon, I understand your concern about silt runoff from potential rainy weather in association with tropical cyclone Kiko. You know, it’s a tough call, as it’s unclear how much rain will fall, and exactly where it will fall…before it arrives.
Showers could be locally heavy in places, and we cannot rule out a brief thunderstorm as the atmosphere destabilizes on Tuesday.
Then of course there’s the high surf that Kiko will bring our way…at least locally.
As Kiko moves off to the northwest of the state on Wednesday night and Thursday, moderate trade winds and a ridge aloft are expected to build in from the east. The resulting stable conditions will bring a drier air mass with a typical pattern of windward rainfall.
Best of luck with your decision
Aloha, Glenn
-
September 7th, 2025 at 1:28 pm
Mona Says:Aloha Glenn
what happened to the temperature readings for each island on your website? I always relied on that and looked forward to seeing the temperatures each day.>>> Hi Mona, the NWS isn’t carrying them at the moment, so I can’t display those temperatures on my site either. When they come back I will bring them back to my website.
Aloha, Glenn
-
September 6th, 2025 at 10:38 am
Bonno Says:Good morning! What happened to our temperatures?
>>> Hi Bonno, the NWS isn’t carrying them at the moment, so I can’t display those temperatures on my site either. When they come back I will bring them back to my website.Aloha, Glenn
-
September 5th, 2025 at 11:07 pm
Gary Hipp Says:Thanks for putting the radar maps back in. Much appreciated.
Gary>>> Hi Gary, you’re welcome!
Aloha, Glenn
-
September 1st, 2025 at 2:56 pm
Dan O. Says:Hi Glen,
Do you have any changes to your predictions or thoughts on Hurricane Kiko. I saw some models showing very close approach and/or possibly Hawaii Landfall.
Thanks for all your posts!
Dan O.
>>> Hi Dan, I will continue to update information about soon to be hurricane Kiko…here’s the latest:
I’m keeping a close eye on this tropical system, despite the fact that it’s still well within the eastern Pacific at this time. The Central Pacific Hurricane Center is suggesting that Kiko, which will be a hurricane then, will cross into our Central Pacific this coming weekend. I just glanced at the latest GFS model to see what it has Kiko doing going forward. Interestingly enough, it has whatever is left of Kiko arriving here in the Hawaiian Islands Wednesday, September 10th. Now as we all know, many changes in its path could occur between now and then. So, there’s no need to go off the deep end on this situation, although I will be keeping my eye on this storm each and every day going forward.
-
September 1st, 2025 at 2:44 pm
Jerry Says:Hi Glenn,
I enjoy reading your summaries every day esp the marine forecasts as I like to paddle. I also check the Windy app for a pictorial display of oncoming weather. It looks like Kiko will swing by below the Big Island and hopefully bring us some rain.>>> Hi Jerry, good to hear from you…thanks for your positive feedback!
As for Kiko, at the time of this writing it appears that Kiko could, or whatever is left of the system, may come over the islands, or perhaps move by just to the north or south. Time will tell, and I’ll continue to provide updates as we go forward.
Enjoy your paddling!
Aloha, Glenn
-
September 1st, 2025 at 2:35 pm
Marge Says:Thanks for your very thoughtful answer, Glenn. Weather is just so interesting. There are definitely some major shifts happening. Seems like the summer high used to sit further north, closer to the south of California. Mauka Showers is a welcome addition. Thanks again.
>>> Hi Marge, you are very welcome, chime in any time!
Aloha, Glenn
-
August 30th, 2025 at 2:59 pm
Marge Says:Appreciate the high pressure effect on our cloud heights limiting rain. Also wondering how much of an effect the ongoing drought in the southwest has on our rain since that’s the direction the trades are coming from.
Thanks, Glenn
~~~ Hi Marge, hmmm, I’ve read your question several times, and still don’t have a clear answer, but I wanted to say something rather than ignoring it. Let’s see, what can I say? Typically what determines our local rain is moisture being carried here on the trade winds, as you say. However, the southwest, being over 2,000 miles away, seems too far to have a direct effect on showers that fall here. Showers here, especially on the windward sides, are caused by the moisture being forced up the slopes, cooling, and ultimately falling as rain. Or of course, moisture brought up the slopes of the mountains, being carried up there on the sea breezes. Then, a cold front coming in from the north or northwest in the cooler seasons, or tropical cyclones (or their remnants) coming up from east or southeast…can bring showers. One more rainfall producer, let’s not forget those pesky upper level troughs of low pressure that can swing through any time of year. Now that I’ve written all this, which of course you know all about Marge, I wish I would have just said in the beginning…no I don’t think so…but I’m not 100% sure of that! Hehehe
Glenn
-
August 26th, 2025 at 10:48 pm
Caroline Woodham Says:Hi Glen
Why is the trade wind flow carrying so little moisture this year?Thanks
>>> Hi Caroline, that’s a good question, I wish I had a great answer for you, however, it’s a bit complex. However, the simple answer if you don’t mind, is that we’ve had a ridge of high pressure over and near the islands for quite some time, both at the lower and higher levels of the atmosphere. This causes sinking air, and limits the vertical dimension of our typical cumulus and stratocumulus clouds. These clouds are carried our way on the trade wind flow, or develop over the islands aided by daytime heating of the physical terrain. This high pressure prompts a stable atmosphere, which is a limiting factor for shower activity. Unfortunately, I don’t see much change in this relatively dry and warm to very warm pattern, with only a few showers here and there through the upcoming Labor Day holiday weekend.
Aloha, Glenn
-
August 25th, 2025 at 11:09 pm
timothy kodysh Says:nothing dry or windy at waiohinu today
got sunny till i got done painting, of vourse (epoxy sets up quick, hurrah)
meanwhile at our lunch 1:30p cloud shelf and now 1/4 inch rain since 3 pm
we re the closest to that equatorial perrenial bandof stormsmonday 7:15p
>>> Thanks Timothy
Aloha, Glenn
-
August 24th, 2025 at 6:33 pm
Bill Ferguson Says:I was looking at the national weather service and at 11:54 the humidity was 27%. I’ve never seen it that low.
>>> Hi Bill, that’s incredible, being that we’re surrounded by this huge Pacific Ocean! 27% is what I would expect in a desert for crying out loud! Hot and dry it is, although personally I prefer hot and dry over hot and muggy!
Aloha, Glenn
-
August 21st, 2025 at 7:45 pm
Clear Englebert Says:Why do you have fewer satellite pictures now than you used to?
~~~ Clear, because the ones I was using weren’t updating properly, and I didn’t want to have out of date images.
Aloha, Glenn
-
August 20th, 2025 at 12:44 pm
Gary Hipp Says:I sure do miss the radar animations especially for Maui and the Big Island. I appreciate your straight-forward forecast without sensationalizing the weather.
>>> Hi Gary, thanks for your positive feedback, and I’ve returned the radar images you were referring to.
Aloha, Glenn
-
August 18th, 2025 at 3:15 pm
timothy kodysh Says:glenn
South point weather HAWAII Island this morning 10 AM partly cloudy the cloud shelf left last night about 2 AM with stars however dropping a quarter inch of rain at 9 PM
Today wind mild ,sunny partly cloudy>>> Thanks Timothy
Aloha, Glenn
-
August 17th, 2025 at 11:28 pm
timothy kodysh Says:glenn wx for sunday at 96772 waiohino south point hawaii….
at waiohinu , one mile mauka of naalehu…
possibly due to passing ivo,
llarge cloud shelf formed early, like 10 am
cancelled my plans for exterior painting..
large shelf by 5 pm
rain finally came at sunset
5-10 minute downpour
now the typical night pattern reverse convection downdraft
that shelf will be pushed out south and east
starts are expected.
reporting, tim kodysh>>> Hey Tim, good to hear from you my friend, down there on the Big Island. We always appreciate specific reports from any place in the island chain. I’m hoping that that area of moisture from the former TC travels up here to Maui.
Aloha, Glenn
-
August 13th, 2025 at 10:31 am
Richard Says:Hi Glenn,
I don’t remember anyone commenting on why Henriette strengthened to our NE after already weakening over cool water. Seems unusual. Is there a pool of warm water up there?
>>> Hi Richard, that’s exactly right, there is a pool of warmer water that was under the track of Henriette…as he moved over it the storm’s strength increased.
Aloha, Glenn
-
August 12th, 2025 at 4:28 pm
Maleko Says:Hello, Glenn. So sorry to read about the Kula Lodge. It is a special place for my wife and I, having been there but once some years ago – but it left such an impression as to be fresh in our minds these many years later. Upcountry fires are unnerving, to say the least, and we hope that everyone is okay.
>>> Hi Mark, indeed, so many people from around the world hold the Kula Lodge as a special place! It was shocking to stand on my deck at 330am in the morning and watch from afar the flames and smoke, and the helicopter with its blue lights flying above the fire, and to hear men yelling and the crackling sounds of wood burning…and all the sirens so early in the morning! This of course after the big fire we had not so long ago, which still has the folks around my area on edge. Stuff happens as the saying goes, and Kula has been having its fair share of late. Fortunately, no one was injured, other than having to breathe the smoke.
Thanks for your well wishes!
Aloha, Glenn
-
August 12th, 2025 at 10:36 am
Rick Says:Hi Glenn, Like so many others a I am long time advocate of your weather forecast and appreciate all you do!
I am missing the 8 day precipitation model and hoping it might return. Any thoughts on that?
Mahalo, Rick>>> Hi Rick, good to hear from you! Indeed, I know what you are talking about, and somehow that model went away, although I am trying to find it…and will put it back where it belongs if I can come up with it again.
Aloha, Glenn
p.s. thanks for your very kind positive feedback!
-
August 10th, 2025 at 11:46 am
Berney Says:I miss the individual animated radar feeds showing Oahu & Maui and Maui & Hawaii. The composite radar of the State does not show enough detail to know if rain is coming locally. Are the individual feeds still available?
As always, mahalo for your work giving us the best weather info available. Have you ever thought about having a daily 5-15 podcast/video feed similar to your show on local TV in the 90s?
Berney
>>> Hi Berney, good to hear from you!
The radar images I was using weren’t updating properly, so I took them down. I have a meeting with my webmaster soon, and will work with him on seeing if we can get some radar images with greater detail. I’ll also ask him about doing a podcast as well.
Thanks for your positive feedback!
Aloha, Glenn
-
August 8th, 2025 at 11:02 am
Suzanne Says:Hi Glen,
How come there are not as many satellite pictures now
on your site?>>> Hi Suzanne, good question. The answer is that those many satellite images that I had on the Weather Narrative Page were no longer being updated by the National Weather Office. Therefore, I deleted them and am using just the images that they have, that are automatically updated. Granted, there are far fewer images, although at least they are current.
Aloha, Glenn
-
August 6th, 2025 at 9:58 am
Bonno Says:PS. 6:00 AM – NO wind and 80 degrees inside my house!
>>> Hi Bonno, calm and muggy already this morning!
Aloha, Glenn
-
August 6th, 2025 at 9:31 am
Bonno Says:Aloha Glenn! Just wanted to let you know, it’s RAINING in Kahului…Just misty now after about an hour, some heavy. Yay, my kind of weather and a nice reprieve from the heat. Enjoy your day.♡
>>> Hi Bonno, good to hear from you again, and especially with this wet report from Kahului! Thanks for letting us know, rather unusual to say the least, the good stuff after all this heat lately.
Aloha, Glenn
-
August 4th, 2025 at 4:19 pm
Marge Says:Hey Glenn,
We have lived here 46 years and much has changed.The first 3 months in 1979 we never saw Haleakala because it was covered in clouds. What a surprise the first time it popped out.
Kula & Makawao & Paia were always green. You didn’t want to live in Haiku because it rained all the time. It wasn’t uncommon for some Haiku roads to be almosr one lane because of vegetaion. We had nice steady tradewinds all summer & pleasant Kona storms in the winter. We even had lots of tradewind showers in Pukalani when we moved here in 1991 and it was not this hot.
This is the first time central Maui has had water restrictions that I recall. The tradewinds have gradually declined. Now the winds are wild & more easterly & gusty or gone. It is common to have no clouds on Hakeakala and that does not look right.
Yeah, am afraid this is our new normal.
Hang in there.
>>> Hi Marge, your description of the weather here on Maui, in the old days, is right on. One thing I remember so vividly was at one point way back when, I lived in Haiku, and recall that the usual lush green pastures, and everyone’s lawns, turned a crispy brown! Then there were other times, when I recall it rained for 30 days straight…some of the days had only a few flecks of rain, and others when it rained quite hard for many days in a row. As Bob Dylan is famous for saying, “the times, they are ah changin.”
At any rate, it’s certainly been hot and dry here in upper Kula for some time now…and it’s not my favorite weather to say the least. Actually, my absolute least favorite weather may be heading our way now, as former TC Gil is taking aim on this general area of the central Pacific. If what’s left of him does get close by Wednesday into Thursday, we are in for some very humid weather with hardly any wind…yuck!
Over an out, thanks Marge, always good to hear from you!
Aloha, Glenn
-
August 2nd, 2025 at 7:09 pm
Anna Says:Hi Glenn, I am your eager follower from Oahu. I noticed that this summer the weather been quite unstable and more than usual. It seems like it’s tight pressure gradient after gradient coming since April…Do you think it could be some el Nino effect? Thank you 🙂 as always for clarifying it all for us
~~~ Hi you eager follower! 🙂
As I recall we continue to shift between an unstable and stable environment this summer so far. Currently we’re involved in a very stable, dry and warm condition. Personally, I’m ready for some rain, and it may take until this coming Wednesday or Thursday, before whatever is left of former hurricane Gil, in the eastern Pacific, makes his way into our general area. He could cut off our trade winds, making for very muggy air, and hopefully some moisture then.
We are in a neutral phase of the ENSO cycle, which should stick around this month through October. This suggests that fairly typical weather conditions will prevail into early autumn. La Nina could get started by the winter months.
Thanks for your comment Anna
Aloha, Glenn
-
August 1st, 2025 at 12:48 pm
Marge Kelm Says:Hi Glenn,
Where is Kealaloloa Rg? What does Rg mean?
Thanks for keeping us informed, Marge
>>> Hi Marge,
The Kealaloloa Ridge (Rg) gauge is up along the flank of the West Maui Mountains, quite near Maalaea Bay…over where those wind turbines are.
It’s a windy place, like the Puuloa gauge…which is on the back side of the Haleakala Crater, upslope from the Piilani Highway.
Aloha, Glenn
-
July 29th, 2025 at 8:40 pm
Nancy Lorenz Says:This tsunami warning is pretty scary! Watching for updates in the news. Hope you stay safe!
Nancy~~~ Hi Nancy, incredible, magnitude 8.7 earthquake! I live upcountry so I’m not concerned about the Tsunami…although pretty scary for a lot of people!
Be well my friend, Glenn
-
July 27th, 2025 at 7:10 pm
lopaka Says:where is Gulf of America? I know a Gulf of Mexico
>>> Hello Lopaka, I guess you haven’t heard, the Gulf of Mexico has become the Gulf of America. There are many folks who would have kept the GOM title, although the current governing body changed the name to the GOA.
Aloha, Glenn
-
July 26th, 2025 at 8:55 pm
Richard Says:Hi Glen, I know you love pickle ball and most that try it do. However…there are four wonderful tennis courts in Kula that you drive by on your way to Haiku. Great group that plays there too. Give it a try sometime.
~~~ Hi Richard, I do love Pickleball, and play three mornings a week typically. I would love to play tennis, although aren’t sure where these tennis courts are? I’d love to casually hit it back and forth sometime!
Aloha, Glenn
-
July 24th, 2025 at 11:07 am
Caroline Woodham Says:Please please please find a way to restore the surface analysis map. It was so useful to me.
Thanks
~~~ Hi Caroline, I totally understand, I feel the same way about it! I called the NWS forecast office in Honolulu just yesterday, asking about it, they don’t know when the issue will be fixed…darn it!
Aloha, Glenn
-
July 9th, 2025 at 2:59 pm
Brett Says:Glenn, aloha! I love your website. One question that I have never seen a good answer to…my wife and I love hiking the Waihee Ridge Trail, but gosh darn it it always seems to rain on us. What’s the best way to predict in advance how it will be up there? Or, what’s the best time of day to do that hike, typically? Mahalo!
>>> Hi Brett, good to hear from you. Thank you very much for your positive feedback!
As for your good question, the Waihee Ridge Trail is a good one, one that I’ve hiked many times. When the trade winds are blowing, it’s typical for passing showers to be blown up along the trail. It’s tough to predict very far in advance, whether you would need a rain jacket…or not. I would look at the latest radar loops, and see if there are any obvious clouds/showers taking aim on that area of the west Maui Mountains. As for the best times to hike, with the idea of staying dry, hmmm…maybe 1030am until 3 or 4 in the afternoon.
Best of luck Brett!
Aloha, Glenn
-
June 26th, 2025 at 2:41 pm
Richard Thompson Says:A little late, I found Na Kula Glenn. I was looking in the wrong place. Thanks.
>>> Hi Richard, glad you found Na Kula, over on the backside of east Maui…windy place that it is.
Aloha, Glenn
-
June 24th, 2025 at 12:31 am
LKD Says:Hi Glenn!
Your reliable and expert reporting and commentary are something I truly prize in my “online life”. I hope that you are aware of just how cherished you are. There exists no equal in the realm of thought provoking, accurate, and comprehensive meteorological analysis. I, too, am experiencing a heavy heart and sincere worry over the poorly executed and misguided actions of our government with regards to Iran. On a brighter note, it still fills me with hope to have seen the monumental turnout last weekend at the protests against fascism. Perhaps there is hope for us yet! Thank you for all that you do!
~~ Luke
>>> Hi Luke, well I must say, your comments have blown me away, so to speak. Your praise of what I do in my “online life” is generous to say the least. I quite often get a thank you note, although not so often do I receive such a heart felt acknowledgement, not to mention how well written it is.
Thank you for making my day Luke, you truly have! I sincerely love keeping this website going for all these years, decades in fact…and have no plans to stop!
Indeed, the state of the world saddens me as well.
Aloha, Glenn
-
June 21st, 2025 at 4:19 pm
Rege Says:Thank you Mary Oliver for my first “Summer Day” of 2025!!
Thank you Glenn for sharing all you do with us!
Happy Summer to All!!!>>> Hi Rege, you are very welcome my friend!
Aloha, Glenn
-
June 18th, 2025 at 10:17 am
Jill Says:Really like the new highest and lowest temperature feature. And I’ve got to look at these new maps! Mahalo for your site… a guiding star in my daily life!
~~~ Hi Jill, good to hear from you again! I glad that you like the highest and lowest temperatures, I enjoy keeping up on those numbers too!
A guiding star in your daily life…oh my, what a great thing to say!
Aloha, Glenn
-
June 16th, 2025 at 11:16 am
Richard Thompson Says:Hi Glenn,
I love maps; thanks for the wind and rain gauge map. Now to nit-pick: you report the highest wind gusts on Maui today at Na Kula, 56 mph. I can’t find Na Kula on the map. Does it masquerade as one of the other Kulas?
Richard
~~~ Hi Richard, good question, click on this link:
https://noaa.maps.arcgis.com/apps/instant/basic/index.html?appid=ac392f8764834b628ba4eed1805e411d
and then keep zooming into Maui until you see Na Kula to the south of the Haleakala Crater (on the back side of Maui).
Please let me know if you find it.
Aloha, Glenn
-
June 13th, 2025 at 12:49 pm
David Whatmore Says:Aloha Glenn,
Here is the link for the restored North Pacific Surface Analysis:
https://www.weather.gov/images/hfo/graphics/npac.gif
It includes ridges and latitude numbers and shows the Pacific all the way to the equator, which the version currently on your website does not. It’s odd that there are now
two different graphics versions available.I appreciate you,__Farmer_Dave
~~~ Hi Farmer Dave, good to hear from you again. Thanks for sending the new weather map, I’ve added it to my narrative page, rather than the one that I had been using temporarily.
Aloha, Glenn
-
June 13th, 2025 at 1:22 am
Kristina Says:I’d love to send you a couple of my Surf art paintings to use for one of your post.
~~~ Hi Kristina, sure I’d show a couple of your art pieces, however they need to have a URL, I can’t just copy and paste them into my editor.
Thanks for the offer!
Aloha, Glenn
-
June 9th, 2025 at 1:43 pm
David Whatmore Says:Aloha Glenn,
I noticed that the North Pacific Surface Analysis chart is now up and available again but with a new look. Same web address as you had before.
I also have noticed that the % chance of rainfall is no longer included in the NWS 7-Day Forecast for Kauai. It’s great that you still provide these predictions for us, and yours have been consistently more accurate.
Thanks for the good work that you do.__Farmer_Dave
>>> Hi Farmer Dave,Good to hear from you. Indeed, we found a new weather map, which like you point out, is a bit different than the last one I had. Nonetheless, it lets us know where things are here in the Pacific.
You are very welcome, I’m happy to keep the updates coming out many times each day!
Aloha, Glenn
-
June 4th, 2025 at 1:54 pm
Judie Vivian Says:Aloha Glen:
Hereʻs a great link for the isobar map for your consideration – it is easier to read and has the numbers on the H pressures:
https://ocean.weather.govMahalo for your great reports!
Judie
>>> Hi Judie, great find, thanks for pointing it out, I’ve added it to the Narrative page straight away.
Aloha, Glenn
-
June 4th, 2025 at 10:08 am
marjorie classen Says:Aloha Glenn,
the ‘closer view’ is not showing up today. I you can
adjust that, please do.
Sending aloha,
Marjorie>>> Hi Marjorie, it’s showing up again now…Aloha back to you!
Glenn
-
May 22nd, 2025 at 8:17 pm
al Layer Says:Glenn, Thanks for all the great weather forecasts over the years. You are my #1 site to get the info to plan my day. Glad to see the increase in observation stations for rain and wind we know only a short distance can make a big difference in wind speed or rain totals. How can we access the data from all these stations? Thanks, Al
~~~ Hi Al, really happy to know you utilize my website for your weather information needs!
As for your question, use this site for rainfall:
https://forecast.weather.gov/product.php?issuedby=HFO&product=RRA&site=hfoand for wind use this site:
https://forecast.weather.gov/product.php?issuedby=HFO&product=OSO&site=hfoAloha, Glenn
-
May 20th, 2025 at 10:59 am
Ron Marks Says:Glenn
Been following for years. Thanks for getting me prepared for upcoming weather on the islands.
How many years?
Ron~~~ Hi Mark, good to hear from you. You’re very welcome! I began this website back in 1996, and have kept it going ever since, almost 30 years now! I enjoy having the schedule that it provides me, and of course I love staying in touch with the weather!
Aloha, Glenn
-
May 19th, 2025 at 5:47 pm
Kabba Says:Torrential rain in Pukalani for the past hour!
>>> Hi my long time friend Kabba, thanks for letting me know! Here in upper Kula it’s been very cloudy, and we had a very brief period of sprinkles…nothing like what you received! Another friend mentioned that it was wet in Makawao too.
Aloha, Glenn
-
May 16th, 2025 at 2:23 pm
David Whatmore Says:Aloha Glenn,
Many thanks for what you do.
Your percent chance of rain predictions have been consistently more accurate than the NWS predictions were. Now it seems that the NWS is no longer making these predictions here.
Any new info on when or if the Weather Map will be available?
Mahalo,___Farmer_Dave
>>> Hi Farmer Dave, good to hear from you! You are very welcome, I have always stayed in touch with the weather (since I was a little kid), and enjoy sharing it with you and everyone else who wants to know about what’s happening…and what will be happening.
The weather map I had on this website has been taken down, because it was outdated. The NWS office in Honolulu is responsible for keeping that updated, and when I’ve asked them many times when it will be back in service, they don’t know. However, when it comes back, and I check everyday, I will bring it back here immediately.
Take care my friend…
Glenn
-
May 13th, 2025 at 3:36 pm
Erel Says:Hi Glenn,
Daughter of my close friend is going to swim Kaiwi channel on Saturday and I am wondering what your thoughts about the predicted weather conditions on May 17thWill appreciate your input ! Thanks !
>>> Hi Erel, that’s an impressively long swim between Oahu and Molokai!
It’s now Tuesday, and the swim is Saturday, so there could be some changes between now and then, although here’s the forecast for now:
Saturday
East winds 9 to 11 kt (11-13 mph). Isolated showers. Mixed swell…north-northwest 1 foot and South 1 foot. Waves 4 to 6 feet.
Aloha, Glenn
-
May 12th, 2025 at 9:53 pm
Colleen DeLima Says:Aloha Glenn!!
It’s Colleen from Ulupalakua ~ mahalo for your excellent weather updates.
I’m struggling with some major asthma, as a result of the frequent eruptions at Kilauea this year. I seem to be in the crosshairs of the relentless vog, here on Maui, and wonder if you have any suggestions and if there is hope of returning trade winds any time soon?Mahalo!
>>> Hi Colleen, I’m so sorry to hear about your asthma condition, I know of that feeling, as I had it when I was a young child.
You are very welcome, I love providing you and everyone else who visits this website with daily updated weather data!
As for the trade winds, actually they are blowing now, and have been for several days, with no interruption expected through the rest of the week.
Wishing you clear breathing soon my friend there in Ulupalakua!
Aloha, Glenn
-
May 3rd, 2025 at 1:27 pm
Judie Vivian Says:Aloha Glenn:
Any updates on the “Weather Map” links as itʻs still not updating
Mahalo
Judie 🙂>>> Hi Judie, I’ve called the NWS office in Honolulu office twice in the last week, and both times they said “it should be back” in a couple of days. The last day of the last couple of days would have been 2-days ago!
We’ll have to hang in there I guess.
Aloha, Glenn
-
April 29th, 2025 at 12:02 pm
Kathy Blackman Says:Hi James,
How will we get by without satellite info?
We’ve spent decades and billions of dollars to build and launch satellites to predict the weather, help grow crops, plan transportation, and prevent trillion-dollar disasters, etc., but now (*shrug*) we’re going to stop using them.———
Date: Friday, April 25, 2025 at 2:05 PM
To: espc.notification@noaa.gov
Subject: Administrative: Update# 1 – Suspension of POES data to Users after June 16, 2025 – Issued April 25, 2025 1905 UTCTopic: Suspension of POES data to Users after June 16, 2025
Date/Time Issued: April 25, 2025 1905 UTC
Product(s) or Data Impacted: All POES data products
Date/Time of Initial Impact: June 16, 2025 18:00 UTC
Date/Time of Expected End: NA
Length of Outage: See Details.Details/Specifics of Change: NOAA will end delivery of all data from the POES constellation (NOAA-15, NOAA-18, and NOAA-19) on June 16, 2025 at 18:00 UTC.
AMSU-A1/A2/B – data will no longer be available after Jun 16, 2025 after 1800 UTC
APT/LRPT – service will be left enabled, but do not use this service for operational use
HRPT – service will be left enabled for diagnostic flight use only (no operational use)
AVHRR – data will no longer be available after Jun 16, 2025 after 1800 UTC
DCS/ADCS (Argos) – service will be left enabled as best effort only
HIRS – data will no longer be available after Jun 16, 2025 after 1800 UTC
SARR (SARSAT) – service will be left enabled as best effort only
SEM – data will no longer be available after Jun 16, 2025 after 1800 UTC
MHS – data will no longer be available after Jun 16, 2025 after 1800 HTC
SBUV – data will no longer be available after Jun 16, 2025 after 1800 UTCIn the interim, all users should make plans to discontinue use of POES data from NOAA-15, NOAA-18 and NOAA-19 as these data and services will no longer be made available after Jun 16, 2025 1800 UTC.
Further updates regarding POES will be provided as the June 16, 2025 date approaches.
Contact Information for Further Information: Please email User Services at spsd.userservices@noaa.gov
>>> Hi Kathy, this is the first time I’ve seen this. Fortunately, here in Central Pacific, we largely utilize the GOES satellites…rather than the POES satellites.
Aloha, Glenn
-
April 27th, 2025 at 7:44 pm
Judie Vivian Says:Aloha Glenn:
Why is the “Weather map” not updating?
Mahalo
Judie
>>> Hi Judie, I just called the NWS in Honolulu and posed your good question to them, and their reply was that the map should be updating properly tomorrow or on Tuesday.
Aloha, Glenn
-
April 27th, 2025 at 2:25 pm
Mike Mociun Says:Aloha Glenn,
I’ve been living on the North Shore, Oahu for some 25 years. I used to watch your show on TV religiously as did many of my friends. I just recently learned about this website and I’m stoked that you’re continuing to provide quality weather information and forecasts.
Maybe you remember me from when I worked on Matson ships and occasionally sent you email when I was at sea. Keep up the good work my friend!BTW I’m retired now and still surfing but just smaller waves.
Mike Mociun>>> Hi Mike, of course I remember you! I thought it was fun to stay in touch with you when you were way out to Sea between here and the west coast!
Glad you found me online, it’s been many years since I was doing live TV weathercasting!
I’m retired from surfing, although I did ride a million small to medium sized waves in my day…mostly small 3 foot and under.
Take care my long term friend!
Aloha, Glenn
-
April 23rd, 2025 at 3:24 pm
Cheryl Says:Hi Glen, I’m also very sad about the cuts to Federal agencies, I’ve followed you since the Maui TV days.
>>> Hi Cheryl, indeed, there seems to be lots sadness going around these days…let’s not give up! You’ve been following the weather for a very long time…as have I.
Aloha,
Glenn
-
April 22nd, 2025 at 7:02 pm
Nancy Lorenz Says:Aloha Glenn,
So sorry to hear about cuts at the NWS. Iʻve been wondering how it would affect you and this treasure chest of info you provide every day. It would sure be disappointing to lose your daily updates.
Hoping for the best scenario because we would sure miss you.
Nancy>>> Hi Nancy, Always good to hear from you there in Sebastopol! Indeed, the times are ah changing! I was hoping that the local NWS office would stay above the fray, although that’s not going to happen!
I’ll keep my website going as long as I can, although might have to pare it back some over time.
I really appreciate your support, now, and over the many many years you’ve been a valued reader!
Aloha, Glenn
-
April 22nd, 2025 at 10:16 am
Ian ʻAkahi Masterson Says:Hey Glenn! Ian here, I just wanted to send my aloha to you my old friend! I love MARIN COUNTY, it is so beautiful! I have family there that my dad would take us to visit! Enjoy your time there.
I just want to say, our friendship has spanned 30 years and in that time you have taught us all (Kaleo says aloha too!) sooooo much about weather and surf in Hawaiʻi!~ Thank you for your continued reports and consistent updates, they mean the world to all of us who used to watch your daily weather narrative on ʻŌlelo!
Perhaps its time to start up a daily or weekly weather show on YouTube! Technology has changed, but Glenn James remains the same! We love you brother, much aloha! Ian
>>> Oh Ian, I just played several rousing games of Pickleball, and I thought that was going to be making my day. However, now your priceless comment on my website has made my day for the second time!
Thank you, thank you, thank you my old friend! I love you and Kaleo, my brothers there on Oahu, and everyone else, wherever you happen to live on this big blue marble of ours!
Just looked through your Surfing Professor website…you’ve become a famous guy…congratulations!
Aloha, Glenn
-
April 21st, 2025 at 1:12 pm
Kabba Anand Says:Are there rain gauges in Makawao?
We got seriously dumped on yesterday.>>> Hi Kabba, I don’t exactly know where the rain gauge is located in Makawao. A friend sent me a video of the heavy downpour you got yesterday!
Aloha, Glenn
-
April 18th, 2025 at 11:06 am
Nicole Says:Hi Glen traveling today to stay in Wailea like others I have been stressing with the weather, we will be there through Tuesday any hopes of a drier weekend???
>>> Hi Nicole, nice to hear from you, and yes, I think you will be fine in Wailea this weekend! Have fun and enjoy the sunnshine…don’t get sunburned though.
Aloha, Glenn
-
April 17th, 2025 at 11:28 pm
Jerry durkan Says:Hi Glen,
you gotta love a full-blown thunderstorm on Maui. We had a lightning strike that seemed to be right on top of us in Haiku. It reminds me of Pennsylvania storms I enjoyed as a kid. Keep up the good work and keep those batteries and candles handy.>>> Hi Jerry, good to hear from you there in Haiku! Incredible thunderstorm activity, pretty unusual! You stay safe today, as we could see yet another round of thunder claps…and more next week!
Aloha, Glenn
-
April 17th, 2025 at 11:04 pm
Kabba Anand Says:Three hours of rolling thunder. Makawao
>>> Hi Kabba, good to hear from you my friend, wow, 3 hours of the good stuff (rolling thunder)!
Take care, Aloha, Glenn
-
April 15th, 2025 at 7:28 pm
Morgan Says:Hi Glenn!
Thanks so much for this weather forecast. I am visiting Maui from the US mainland tomorrow through next Monday. I am feeling discouraged by the incoming weather. What are the chances we see some sun? Staying in Wailea. I am hoping the storm changes path or lightens up. Hoping for a sunny weekend!Thanks!
>>> Hi Morgan, good to hear from you! Indeed, the weather, even on the leeward side will be unsettled through Friday…although the weekend looks much more favorable!
I’m wishing you the best luck that Wednesday-Friday won’t be as bad as advertised by the models…and that the weekend will be terrific!
Aloha, Glenn
-
March 23rd, 2025 at 12:25 am
Capt. Lee ,,, Says:Thanks Glenn ,,,
I have been checking your site every morning for the last 4 decades ,,, Great ………
Do I recall the NWS stating it was going to be a Wetter than normal Winter back in this Fall ,,,
And it turned out to be ,,, one of the Driest Winters ever …………………….
>>> Hi Capt. Lee,
There was no lack of cold fronts this past winter, although almost all of them were weak, and stalled either northwest of Kauai, or brought showers to Kauai and Oahu, and very little if any rainfall down here over Maui County and the Big Island. I was disappointed on how dry it was, after the models suggested it would be otherwise! Oh well, welcome to a changing climate, with more extremes, in all areas of the weather.
Aloha, Glenn
-
March 22nd, 2025 at 2:04 pm
dennis bresnahan Says:just saying hi and thanks for still being here every day. you would be so very much missed!!! thanks again.
aloha den
>>> Hi Den, you are very welcome, I greatly appreciate your candid feedback!
Aloha, Glenn
-
March 20th, 2025 at 11:25 pm
Zena Wetzel Says:Aloha Glenn James,
What can we do to support your website . You weather synopsis is incredibly valuable .
How can we help .. especially since NOAA is getting some cuts in funding.
Thanks for all of your hard work .
Mahalo
>>> Hi Zena, thanks for your positive feedback! Actually, I don’t need any support, other than your readership! Ever since I was a little boy, I’ve loved staying in touch with the weather wherever I was. So, it’s with pleasure I keep this website going! It’s truly a labor of love that I share this weather information with you (and everyone else) each day!
You are very welcome!
Aloha, Glenn
Z Wetzel
-
March 8th, 2025 at 12:04 pm
Cameron Says:Hi Glen,
Having a party in Makawao on evening of Saturday the 15th. Wondering if we should plan on rain? Seems like windward showers are the pattern lately.Thank you for your reports!
>>> Hi Cameron, well, as for a party in Makawao next Saturday, I’d say go ahead and have it, although have someplace that’s under cover, like in the house, or under a tent, as the current forecast calls for partly to mostly cloudy with occasional showers…80% chance in fact. The trade winds will continue to bring off and on showers our way well into the future.
Good luck and have fun!
Aloha, Glenn
p.s. this could change of course, given that it’s still a week out.
-
March 2nd, 2025 at 6:28 pm
Rege Says:Aloha Mr. James,
Really enjoy the weather by activity photos! Todays surfing pic is actually rather frightful for me. I spy at least 18 surfers moments away from something horrific. They are all just having fun and okay, right? WOW, takes a lot of courage to be them!
Best to you,
rege
p.s. For some reason I am not seeing “voluminous” comments, should I be looking elsewhere? Also, sorry for the vog the islands are experiencing.>>> Hi Rege, I totally agree, that surf picture yesterday was scary! Those surfers definitely know what they are doing though, they actually are fine, and enjoy those kinds of close calls! I’m happy that you are enjoying the pictures that I find to share with you and everyone else!
Indeed, the vog has been very thick lately, so that I’m relieved that the increasing trade winds will help to get rid of it!
Rege, thanks for your comments, I appreciate your ongoing interest in my website!
Aloha, Glenn
-
March 2nd, 2025 at 9:19 am
Steven Arentz Says:Aloha Glenn,Please comment on the vog Sunday March 2 and what the dynamics of it has/will be next week. Also, will the NOAA Doge cuts affect Hawaii?? Best to you in Kula,
from Kakaako, Steve
P.S. Could the comments be limited to the current month? They get pretty voluminous!>>> Hi Steve, good to hear from you. Yes, the vog is still with us here on Maui today, as it has been for too long! The trades are trying to get a toe hold back on the state, although they are still east-southeast, which has carried the volcanic emissions up over us from the volcanic vents on the Big Island. As the trade winds become stronger, and they will get strong as we get into the upcoming week, the vog should be ventilated away from the overlying atmosphere.
Yes, the Doge cuts will affect Hawaii, both with NOAA and the Navy’s Joint Typhoon Warning Center. How much I don’t know however.
Thanks for your well wishes Steve!
Aloha, Glenn
-
February 14th, 2025 at 10:13 pm
David Bunnell Says:Aloha Glenn. 30% humidity in Kamuela. Lived here 33 years. Never saw anything close to it. What’s going on? Mahalo for the best weather report in the state!
Dave Bunnell.
~~~ Hi Dave, first of all thank you so much for your kind and generous praise for my website! Looking at the Big Island on satellite imagery, I found a distinct lack of clouds in your area at the time I was looking. That, in addition to your more or less landlocked area, away from the ocean, would help to bring your humidity down. 30% is SO LOW though, very remarkable! I see an area of clouds moving towards your island from the southeast…at least they were. Those, if they make it to Kamuela, should add some moisture into your area I’d say.
With all that dry air, and the lack of clouds, should bring your low temperature Saturday into the chilly realms.
Thanks for your report my friend!
Aloha, Glenn
-
February 9th, 2025 at 7:44 pm
Eggie Says:Dear Brad Smith,
Your possible theory of global weather intricacies has put me into quite a tizzy!
Never have I ever considered, or for that matter, even heard of the details you’ve presented. Thank you for your excellent professional insight. Have you ever researched the “Patagonia” effect on global weather?
Thanks again for the informative post.
Eggie~~~ Here you go Brad, some feedback from Eggie.
Glenn
-
February 9th, 2025 at 12:19 pm
Brad Smith Says:Aloha Glenn, As I look at the “Developing Hurricane Force” Low pressure system in the Western Pacific, I am wondering if the atmospheric conditions over Siberia interacting with the Western Pacific Ocean is indeed the major contributor to the making of the weather systems for the Northern Hemisphere? Of course the often mentioned El Nino/La Nina phenomenon together with the currents in North Pacific would play in to this gathering of energy which inturn is affected by the topography of North American continent, currents of the Atlantic Ocean which the Gulf Stream plays a big role in, on in to the Western Europe topography, no doubt affected hugely by North Africa and the Mediterranean Sea, and on to that huge landmass which includes Eastern Europe, “the Stans”, Mongolia, China and Russia. I am sure it all contributes, but it seems to me that the margin of the Eurasian Continent interacting with the Western Pacific is the genesis of North American weather. Fun to contemplate the PNA, NAO, AO-NAM, especially during JFM on a Sunday morning on Molokai. Probably missed a couple acronyms for the weather nerds. Interested in your thoughts. Aloha, Brad
~~~ Hi Brad, good to hear from you again. You seem to have covered pretty much the entire planet in your proposal of what causes weather systems to form in the northern hemisphere! I guess the only thing you didn’t cover was the so called “Butterfly effect”. In other words, where a small change in one place, such as a butterfly flapping its wings, creates large, unexpected changes somewhere else. I suppose we could use as an example, that a live animal market could lead to a global pandemic, leading in turn to a rapid drop in emissions, as the world went into lock down.
At any rate, thanks for your interesting comment from the friendly island of Molokai Brad!
Aloha, Glenn
-
February 8th, 2025 at 12:00 pm
moondog Says:Thanks for your great weather reports. I’m curious what the elevation of your house is in Kula for your temp reports every morning?
~~~ Hi Moondog, you’re very welcome! My house sits at approximately 3,200 feet…not far the edge of a gulch.
Aloha, Glenn
-
February 6th, 2025 at 5:47 am
larry maka Says:aloha glenn, stoked all the years and your commitment to our island weather, the hula pic you shared was a photo promo with a photographer friend and my wife and 2 hula sisters at cut mountain beach, about 15 yrs ago, mahalo for using the pic…be well, alohas, larry
~~~ Hi Larry, good to hear from you! I love providing updated weather information to you, and the rest of the faithful visitors to long lasting website…thanks for your acknowledgment!
Thanks too for letting me know who the Hula picture dancers where, and who took the photo too…it was a great shot!
You take care…
Aloha, Glenn
-
February 3rd, 2025 at 10:28 am
marjorie classen Says:Aloha Glenn,
Enjoying the weather wit you have included.
Perhaps you can check the temperatures today, I am near
Honoka’a and it is not 17 degrees!
Gave me a chuckle.
Aloha,
Marjorie~~~ Hi Marjorie, good to hear from you. I’m glad you are enjoying those little weather wits each day.
Haha, 17 degrees in Honokaa, that’s a laugh, as even atop 13,800 foot Mauna Kea it wasn’t near that cold!
Be well my friend!Aloha, Glenn
-
February 1st, 2025 at 6:13 pm
Bonno Says:Thanks Glenn. Would you consider that past Keokea and before Kanio?
~~~ Yes, although down the mountain some…and as it turns out Kula 1 receives lots of rain and winds when we have gusty southwest kona winds blowing!
Aloha, Glenn
-
February 1st, 2025 at 2:12 pm
Marada Decker Says:Aloha Glenn, we seem to be gradually losing our rain gauges on Maui. Any chance some will be brought back into service?
~~~ Hi Marada, I’m looking at all the Maui RG’s, and I’m not really seeing the ones you are referring to. I count 19 here on Maui, although I know that Maalaea and the Lahaina Portable have been missing for quite some time…the rest seem to be providing measurements. Please correct me if I’m missing something.
Aloha, Glenn
-
February 1st, 2025 at 12:23 pm
Bonno Says:Aloha. What part of Kula is Kula 1?
~~~ Hi Bonno, good question! It’s upcountry from more or less the Makena area, and about half way up the mountain towards Ulupalakua.
Aloha, Glenn
-
January 31st, 2025 at 1:36 am
Patti Hackney Says:Hi Glenn-
I’m staying in Ma’alaea and it feels wild out there. It seems like the winds keep changing and the winds and surf are roaring. I lived here for 10 years, but I’m back as a visitor. I’ve followed your weather information for years and tonight I’m especially thankful for your informative updates as we all ride the storm out. Thank you so much.~~~ Hi Patti, indeed quite a winter storm we’ve had! You are so welcome, I’m glad you’ve found some comfort in my website updates! Glad you continue to be a visitor as well, as Maui welcomes you back home during your vacation in Maalaea! Be well my friend!
Aloha, Glenn
-
January 30th, 2025 at 7:50 pm
Dwight Says:Hi Glenn,
Just an FYI, I’ve been able to ride through outages and maintain internet with Hawaiian Tel fiber and a UPS for all the end devices and router.
Plenty mahalos for the terrific storm coverage!Aloha,
Dwight~~~ Hi Dwight, good news, many aren’t so fortunate, and have been without power for most of the day, at least over on the windward side of east Maui.
You’re very welcome, and I’ll keep it up as long as I have power!
Aloha, Glenn
-
January 30th, 2025 at 2:11 pm
Kari Says:Mahalo for keeping us updated Glen. Weather in Ka‘elekū, East Maui has a hint of blue skies. Dry and calm as of now.
~~~ Hi Kari, glad to hear that you are ok, and you’re very welcome, trying my best to keep up with all that’s going on, between power outages!
Windy and wet here in upper Kula…in contrast to over there on the windward side of east Maui.
Aloha, Glenn
-
January 30th, 2025 at 1:39 pm
Mike Oros Says:Hi Glen. Think I saw a standing lenticular over Haleakala this morning. First ever here. Are they common here?Thanks for all the good work for all these years,on
Mike Oros~~~ Hi Mike, yes Lenticular clouds are unusual, and are indicators of windy weather! We sure are having that today, at least here in upper Kula!
Be well my friend!
Aloha, Glenn
-
January 29th, 2025 at 12:16 am
dennis hanna Says:Aloha, Glen
Thank you.
Thank you so much for very useful and practical information.
dennis hanna~~~ Hi Dennis, you’re very welcome! I’m happy you appreciate my time and energy keeping this website updated for you and everyone else that visits!
Aloha, Glenn
-
January 25th, 2025 at 11:16 am
moondog Says:I love and depend on your weather forecast for an active lifestyle. They are very in-depth and professional. 8.39 inches of rain in Wailuaiki,Maui caught my eye for last night. Is that an unusually high amount?
~~~ Hi Moondog, good to hear from you, thanks for your positive feedback! Indeed, the West Wailuaiki RG has had way more rain than anywhere in the state during the last 24 hours! It seems like an unusually high reading, although that area is often very wet. Is it accurate, I can’t swear by it, although the rain gauge is typically working just fine.
Aloha, Glenn
-
January 12th, 2025 at 12:33 pm
Bonno Says:Aloha…where is west wailuaiki? Call me.
~~~ Hi Bonno, good question, it’s out along the Hana Hwy, just past and upcountry from the Keanae Peninsula…going towards Hana.
Aloha, Glenn
-
January 9th, 2025 at 3:25 pm
Douglas MacDougal Says:Aloha Glen
“open palms” indeed. It took me a while.
Hope your year goes well for you.
Mahalo
Douglas~~~ Hi, Douglas, good to hear from you again! Haha, glad you got the little joke! I hope 2025 goes well for you too!
Aloha, Glenn
-
January 5th, 2025 at 11:41 am
Athena Says:Good morning Glenn,
We are thinking of going up to the crater tonight for sunset. I am wondering how all this vog will affect the view. Any insight you have will be appreciated.
Love checking your website when we are on island.
Athena~~~ Hi Athena, good to hear from you! As for the vog at sunset, well, it’s a tough call, although already this morning there seems to be some improvement in visibility here on Maui. If it was me, I think I’d go for it. Best of luck!
Enjoy the rest of your vacation!
Aloha, Glenn
-
January 4th, 2025 at 10:57 pm
Nancy Swartz Says:Aloha Glen,
There is a very strong burning smell on Molokai south shore. Do you know if VOG is what I’m smelling?
Mahalo,
Nancy~~~ Hi Nancy, there is a thick layer of vog over the state! Here on Maui I can see it, although I don’t smell it personally…so I’m not sure what you are smelling?
Aloha, Glenn
-
January 1st, 2025 at 5:22 pm
rege Says:Aloha Mr. James,
Happy New Year to You!
Hope you have health and happiness in all the years to come!
Boom, “Shaka” laka, laka. Boom “Shaka” laka, laka!!!
I forget the artist but did enjoy the tune years ago.
Keep doin what you do, we LOVE and need it.
Your old pen pal,
rege>>> Hi Rege!
Thanks so much for your positive feedback my friend, I greatly appreciate your kind and generous words of praise!
Happy New Year!
Aloha, Glenn
-
December 29th, 2024 at 1:05 am
Rickie Considine Says:Hi hawaiiweathertoday.com webmaster, Thanks for the informative post!
~~~ Hi Rickie, thanks for your positive feedback!
Aloha, Glenn
-
December 24th, 2024 at 10:44 pm
Nancy Lorenz Says:Aloha and Happy Holidays to you!
Like Walter, I also was a fan of your weather TV show back in the day — at least while we were on Maui. We would plan our day according to your early-morning reports, which would tell us about the wind and the swell. That show was really precious, and I have fond memories of it. I looked for it recently on You Tube hoping to see it again to no avail.
Aloha, Nancy~~~ Hi Nancy, so good to hear from you again, there in Sebastopol, CA, one of my favorite places away from Maui!
It was so fun to do those TV weather shows, it’s hard to believe I did those for so many years…way back when!
I did a search and found some examples of that TV show, here’s the URL for one: https://archive.org/details/MauiWeatherToday14February2008
Happy Holiday’s my friend!
Aloha, Glenn -
December 24th, 2024 at 8:57 am
Jerry Says:Merry Christmas Glenn- Thanks for all you do. Aloha,Jerry.
~~~ Hi Jerry, thanks, and a very Merry Christmas to you as well!
Aloha, Glenn
-
December 16th, 2024 at 8:09 pm
Walter Weigel Says:Hi Glenn,
I am back to Maui for Dec/Jan and would like to thank you for your excellent forecasts for the water sport enthusiasts!
I like your website very much but remember very well your 7.45am live weather show on the community TV.
Is there no chance to restart this at least for the working days? It was so much fun and personalized, a great start into the day!
All the best
Walter~~~ Hello Walter, very good to hear from you! I appreciate your long term viewership, and your positive feedback on my work! Ah yes, my TV weather show, I loved providing that fun show statewide…way back when! I’d love to do that show again, although it would be a long drive down to the college to do the show, especially since I’m not teaching there anymore, and I live in upper Kula now.
At any rate, I wish you well, and please enjoy your time here on Maui through January 2025!
Best to you as well my friend…
Aloha Glenn
-
December 2nd, 2024 at 10:05 am
Catherine Says:Hiya Glenn,
I live Keokea and it’s been very windy here since I woke up at 4am! Don’t see anything about it on the weather page…
Thanks for all you do!~~~ Hi Catherine, good to hear from you there in Keokea! I know, it’s been breezy here in upper Kula this morning too, at least off and on. The reason is that there’s south to southeasterly winds blowing, rather than our usual trade winds. A high pressure ridge is located to the south of Hawaii, rather than to the north, which is prompting these locally gusty winds.
Aloha, Glenn
-
November 28th, 2024 at 11:35 am
Joanne Vasquez Says:Happy Thanksgiving. Glenn. Hope you know how much we all appreciate you. Checking your website everyday is a welcome part of our lives. We are grateful for you.
~~~ Hi Joanne, thank you very much for your kind words! Happy Thanksgiving to you too! I really appreciate your taking a few moments to let me know you read my website everyday…it makes this special day even better!
Aloha, Glenn
-
November 22nd, 2024 at 12:10 pm
Roberto Says:Aloha Glen … from chilly Makawao ! Hit 52 last night/early morning here on the mountain. Brrrr, winter is coming, beautiful clear skies, looks like another magical Maui day!
A Hui Hou, R~~~ Roberto, man oh man, that IS chilly! Thanks for sharing your low temp there in Makawao, upcountry Maui! My low here in northern CA (Marin County) was a relatively warm 58.5 degrees…under rainy skies.
Aloha, Glenn
-
November 13th, 2024 at 2:29 pm
Mark Mason Says:Nice to see you in our neck of the woods. Bend is a great place. If Bob doesn’t take you down to the incredible assortment of restaurants in and around Bond Street, by golly we will! Or try the Yacht Club (Bob will know) if the weather is nice. And Mt. Bachelor is opening for skiing this weekend, Glenn! What about a report from the slopes? (or X-country) On the serious side, we appreciate the most accurate Hawaii weather available anywhere. It seems as if you give us our own personal forecasts when we visit the islands (where we are heading now). Thanks and enjoy your stay in Oregon.
~~~ Hi Mark, good to hear from you! Indeed, Bend is a great place, I enjoy everything about this area, including the cold weather that has set in since I’ve arrived…although it will get colder as you edge towards winter.
Yesterday Bob took me up into the Cascades, and there was lots of snow on the route up towards Mount Bachelor. I got out of the car and hiked around some, with my feet sinking several feet into the drifts! The wind was blowing and the snow was falling nicely too, it was very fun for this weatherman from Maui!
Thanks for your kind and generous praise for this website, I think more of it as our website than mine alone!
I’ve got several more days here in Bend, before I fly down to Marin County to rejoin my friend Linda. I plan on doing more hiking, regardless of rain or snow.
Thanks for your very supportive note Mark.
Aloha, Glenn
-
November 11th, 2024 at 6:32 pm
rege Says:Take two, ten minutes of typing disappears!
Aloha Mr. James,
I’ll try again. Don’t know how you feel about the “Viet Nam War”, but I want to say thank you for your service! In 67 and 69 I was a young teenage “hippie”. I hated the war and wanted it ended. I am so happy you survived it and seem to have made a happy and productive life going forward! I had some friends and local boys who did not. PTSD was not a thing yet. (Alcoholism and drug addiction were.) Sorry to bring forth any bad memories, but they are there for me and others.
Segue!!!
Please enjoy the rain, chill, and approach of winter for the remainder of your California vacation. (Are you getting some crazy traffic too!)
I am sorry for dropping in as I do now and then to “Hawaii Weather Today”, the best weather blog in the world: But it just feels good, cathartic; Look that word up rege,!
Best to you and all your fans! We love you lots!!!
regie~~~ Hi Regie, good to hear from you as always, and this time especially with your kind and compassionate note above! Indeed, I was very fortunate to make it back from Vietnam alive and well, more or less that is. BTW, I did not join the army, but got drafted into service against my will. I’m sorry that you lost some friends!
I’m very much enjoying being in Bend, Oregon now, after spending some time in the SF Bay area before flying north. My friend Bob and I are hiking all over the place, and I’ve still got some time left up here, before flying back down to the north Bay area of SF, to stay for another 10 days with my friend Linda…before flying back home to Maui. I love seeing the changes brought on by the autumn season, as we head towards our winter season.
Best to you my friend!
Aloha, Glenn
p.s. oh yeah, thanks for your wonderful acknowledgment of this website that I’ve maintained since 1996!
-
October 31st, 2024 at 9:10 am
Helen Says:Happy Halloween 🎃 Glenn !! It has been raining nicely here since yesterday afternoon!
>>> Hi Helen, thanks…I hope the tricker treaters don’t get wet!
Aloha, Glenn
-
October 21st, 2024 at 4:42 pm
Dwight Says:Hi Glenn,
Just wanted to let you know again how much your work is appreciated maintaining this website for us here in Hawaii and Maui. I know it must largely be a labor of love.
I appreciated the update for the upcoming, hopefully “rainy” season. It now seems like whether it’s an El Niño or La Niña forecast, it’s going to be dryer. Let’s see how it works out.Aloha,
Dwight~~~ Hi Dwight, always good to hear from you my friend! Keeping this website going is totally a labor of love, has been for many years. I really appreciate your positive comments, you are very kind.
Indeed, lets hope we get not too little rain and not too much rain! We want to stay out of the drought category, and also the flooding stages of rainfall as well.
Have a great rest of your autumn Dwight!
Aloha, Glenn
-
September 28th, 2024 at 10:41 pm
Jill Painter Says:Not sure when it happened , but t is so wonderful that the camera was fixed atop Haleakala! What a clear image this evening.
~~~ Hi Jill, yes, it’s so good to have the Haleakala Crater cam back up and working again!
Aloha, Glenn
-
September 24th, 2024 at 12:42 am
Bill Ferguson Says:Do you know why the the rain guages at Puu Kukui, Pukalani and Maalaea aren’t working?
There are water restrictions that no one in my neighborhood are complying with so how does Maui County justify water restrictions if they don’t know how much rain is happening at these rain guages?>>> Hi Bill, I don’t know why those rain gauges aren’t working, or at least why the numbers aren’t showing up on the NWS website.
Hopefully they will come back online soon.
Glenn
-
September 17th, 2024 at 10:36 pm
David Hume Says:Aloha Glenn from the soggy slopes of Hualalai on the Big island. I had to chuckle this morning with your comment about our typical dry season weather. Last night we had over two inches of rain and all the streams were running and then this afternoon we had another half an inch in an hour and the streams are overflowing their banks, roads are closed and chaos everywhere! And yet, we have a spectacular sunset, Happy Days Lucky we live Hawaii.
~~~ Hi David! Geez, can you PLEASE send me some of your excess rain!? We are so dry here in Kula, so dry!
It WAS a great sunset, nice high cirrus clouds lighting up…and then as it got dark, we have this bright Harvest full moon beaming down on us!
Indeed, lucky we live Hawaii!!
Thanks for checking in from the Big Island David!
Aloha, Glenn
-
September 16th, 2024 at 8:25 pm
Lopaka Says:97 degrees in Kahului today! Is that a new record high temperature for town?
Thanks for keeping us up to date with all things weather.
Aloha,
Lopaka
~~~ Hi Lopaka, the high in Kahului was 90 degrees today, I just noted the record high for today…which was 97.
Aloha, Glenn
-
September 16th, 2024 at 10:33 am
Helen Says:Aloha Glenn,
Happy Monday to you ! I just read your post that it is warm in Kula.
Same here !
However we did get some nice rain last night.
Have a good day!~~~ Hi Helen, Good news, rain is always a good thing during our dry summer months here in Hawaii. It’s mid-morning at the time of this writing, on this Monday, and we’re having a light shower…after a few lighter sprinkles earlier this morning.
Aloha, Glenn
Aloha, Glenn
-
September 3rd, 2024 at 5:55 pm
Marge Kelm Says:Hi Glenn,
You recently featured an excellent article about the Gulf Stream/Atlantic Meridional Overturning Circulation/ocean salinity. I would like to re-read it but of course can’t find it. Could you give me the reference?
Thanks, Marge>>> Hi Marge, here’s a link to that recent article I had on my website:
Aloha, Glenn
-
August 31st, 2024 at 11:09 am
David Sutton Says:Aloha Glenn, thank you so much for your great Weather coverage of the islands and especially during hurricane season. It’s wonderful to be able to read all the detail that you provide!
I’m wondering if hurricane Gilma dissipated largely because of wind shear? And is it the tradewinds that provide the wind shear ?
Thanks… David on Kauai
~~~ Hi David, you’re very welcome!
It happened to be a combination of vertical wind shear and slightly cooler sea water temperatures near the Hawaiian Islands…and a bit of luck too!
Aloha, Glenn
-
August 30th, 2024 at 11:29 am
Ken Smith Says:Thanks for all the great information. Tomorrow, I am scheduled to play in a Pickleball tournament in Kapalua starting at 8 AM. What do you think the weather will look like tomorrow morning in Kapalua?
Mahalo,
Ken
>> You’re welcome Ken. You know, I’m not going to be able to make a forecast for your tournament tomorrow morning. The reason is because it would be nothing more than a guess. And if you want a guess, I’d say that there’s at least a 50% chance of showers over in Kapalua around 8am. At any rate, good luck with Pickleball if you end up playing!
I’d typically be playing tomorrow in Haiku myself, although instead I’ll be flying to Portland, Oregon, where a friend is picking me up, and we’re driving over the Cascade mountains to Bend…where I’ll be for a week, enjoying a short vacation.
Aloha, Glenn
-
August 30th, 2024 at 9:00 am
Helen Says:Happy Aloha Friday Glenn!
It is raining cats and dogs up here !
Mahalo again for your website.>>> Hi Helen, thanks for your report…it has been raining the same way here, a little earlier this morning, although at the moment it has backed off. A good solid rain!
Have a good day Helen!
Aloha, Glenn
-
August 29th, 2024 at 2:39 pm
rege Says:Aloha Mr. Glenn James,
Sorry for the poor capitalization and punctuation errors last time around. So many of your posts are scaring me. Micro- plastics, just one of them! Any advice for a seventy something person moving forward? Stay strong, keep living, greet every day with gratitude and awe! I’m not sure of anything these days : Guess I never was.
As always. thank you for your remarkable time an effort you display daily on “Hawaii Weather Today” A great place to be when we are “stuck” elsewhere.
Hoping to relocate to the island soon. {and maybe build a weather tower like yours!}
Again, thank you for many years of , whats that darn word, you know, living through another persons life, Is it , vicariously? You’ve brought me many days of warmth, smiles and happiness. Keep up the great work as long as you can!rege
>>> Hi Rege, wow, what a great long and very positive piece of writing you’ve shared with me, and others will read it too! You’ve been a long time supporter my friend, and you always send such positive praise!
As for what to do when you’re in your 70’s, I’d say walk plenty, keep your weight up or down, depending upon your body, sleep deep for 6-7.5 hours per night, eat healthy food with lots of fruit and veggies, limit your sunshine, unless you’re from a sunny country, keep your brain active, communicate with friends often, and perhaps have a few times of quiet through the day, to just be with yourself and concentrate on your breathing.
You’re welcome, part of keeping you and everyone else up-to-date on the weather and other things on this website, helps keep my brain active…so thank you for coming back over and over, and keeping me company so to speak.
If I bring you warmth, smiles and happiness, then it brings me those same attributes, again thank you!
Be well, Aloha, Glenn
-
August 28th, 2024 at 5:14 pm
Debbie Koenig Says:Aloha Glenn,
We come to the islands once a year…I want to thank you for all your information. I always trust your reports over the national weather service reports! They get me all freaked out…I look at yours to calm me down!Thank you
Debbie in California
>>> Hi Debbie, you are so kind and generous with your positive feedback, thank you!I’m so happy to hear that you trust what I write, this makes my day!
Aloha, Glenn
-
August 28th, 2024 at 10:37 am
Chris Says:Hi Glenn, Why are there two “H” named storms this year?
Hone dose not appear in the official list of 2024 Pacific storm names. Did someone make a storm naming mistake?
ALoha,
Chris>>> Hi Chris, good question. The reason is that Hector began his life (became a named storm) in the eastern Pacific, which has its own naming list…and Hone became a name storm here in the central Pacific, which has it’s own naming list.
Aloha, Glenn
-
August 27th, 2024 at 12:57 pm
John Henry Melancon Says:Aloha Glenn,
I have enjoyed your weather page since it went live so many years ago. If it is not a false memory, weren’t you also on television early in the morning from Maui Community College? That was long ago for sure, when I started coming over to Maui on an annual basis beginning in 1990.
Today I noticed for the first time that you have absolutely no advertisements on your webpage. While this is rare and refreshing, it made me wonder how you are able to pay for the costs associated with such a comprehensive website.
If you have a Venmo or PayPal account, I would like to make a donation to your work. I’m not a wealthy person but I do contribute to worthy causes.
Mahalo for all you do.
>>> Hi John, good to hear from you! Yes, I did have a live broadcast TV weather show for many, many years, which led into this website, through a NASA grant that I got through the University of Hawaii.
Indeed, I don’t have any advertising on my site, which I prefer, as it’s become simply a labor of love of weather, and my enjoyment of sharing my weather interest with you, and the rest of the large reading community around the world.
I appreciate your generous offer of funding, although the truth is that I want to keep it as a free gift to all of you…no charge just take what you want and leave the rest.
Take care my friend
Aloha, Glenn
-
August 27th, 2024 at 12:13 pm
David Sutton Says:Aloha Glenn… Thank you very much for your wonderful coverage of the weather and especially hurricanes! I’m wondering if it is tradewinds that create windshear, and that is why Gilma is weakening? Have a great day!
>>> Hi David, good to hear from you again! You are very welcome, thank you for your generous praise! Good question, actually trade winds are surface level winds, while vertical wind shear occurs at higher levels of the atmosphere. Shear is often what protects us from tropical cyclones that are taking aim on Hawaii. Shear can lop the tops off of these intense storms, or at least decouple them at times…diminishing their strength. Relatively cooler water near the islands can diminish these storms at times too.
-
August 27th, 2024 at 3:57 am
DAVID Hume Says:Ahloa Glenn, still wet and soggy on the Kona side of the Big island. Thank you so much for all that you do, we all rely on your forecasts , on and off the ocean.
>>> Hi David, good to hear from you again down there on the Big Island! Still wet and soggy, geez, you folks on the Big Island really got wet thanks to Hone! I’d say it’s about time to dry out, right!?
At any rate, you are very welcome, thanks for your positive remarks, they mean a lot to me!
Aloha, Glenn
-
August 26th, 2024 at 4:33 pm
Douglas MacDougal Says:Aloha glenn,
Superb Art Deco mural of the Wahine surfing in today’s post.
Thanks for all you constantly and energetically do.
Douglas>>> Hi Douglas, as always, good to hear from you. Indeed, I like that mural as well, with Diamond Head in the background. You’re very welcome, it’s a lot of work, although fortunately I enjoy keeping this website up-to-date on a daily basis!
Aloha, Glenn
-
August 26th, 2024 at 10:03 am
Helen Says:Mahalo nui Glenn for your tireless support keeping us safe and informed about the weather! One of our neighbors said his rain gauge hit 5 inches from Hone!
>>> Hello Helen, very nice to hear from you again! You are very welcome, I really appreciate your positive comments, you are so kind! Indeed, Hone sure brought lots of tropical moisture our way!
Aloha my friend, Glenn
-
August 24th, 2024 at 9:04 pm
Kula Lou Says:Hi Glenn,
Uncomfortably windy up here in Kula, reminds me of last year I hate to say. Although I hate the musk I would suggest that you get a power wall and Starlink. We did after the fires and we feel much more self sufficient with them. Cheers, Lou>>> Hi Kula Lou, indeed, I’ve had some pile driver gusts at times too!
Thanks for the tip on your internet connection, stay safe and dry my friend.
Aloha, Glenn
-
August 16th, 2024 at 4:21 pm
rege Says:hi glen,
just trying to say aloha!~~~ Hi Rege, I’ve received your Aloha, thank you…and sending your well wishes right back your way!
Aloha, Glenn
-
August 13th, 2024 at 4:13 pm
Robert Says:Aloha Glen, first of all thank you for the kilo (weather) updates on the KWCA meetings.
I have been riding up to 6500 ft 3 x a week for many years, and now up at the burn zone the winds are very “ fitful “, turbulent, and quite unpredictable. I also see a lot of dust devils and debris still rising from the heat midday.
Respectfully,
Robert~~~ Hi Robert, good to hear from you! Thanks for the report about up Crater Road into the burn zone. I’m sure that without the trees, which were burned down, the overlying weather conditions are different. I’m noticing a difference here in my area of upper Kula, with fewer clouds in the afternoons many days, as less vegetation is left growing after the wild fire.
I’d be interested in your take on the situation in regards to differences in weather up there, before and after.
You’re very welcome, I enjoy sharing weather information with the Kula Alliance Group.
Aloha, Glenn
-
July 24th, 2024 at 11:00 am
Linda Says:Glenn,
The Haleakala National Park website has up-to-date info. The summit area is still closed.
~~~ Thank you Linda…it’s been closed quite a long time now.
Park Closures
Summit District Closed
Due to emergency conditions, the Summit District is closed until further notice. This includes Haleakalā Visitor Cener, Headquarters Visitor Center, Hosmer Grove and the Haleakalā Crater. The Kīpahulu District and Kīpahulu Visitor Center are open as usual
Aloha, Glenn
-
July 19th, 2024 at 12:30 pm
Robert Says:Aloha Glenn, hoping you might shed some light and/or info on what’s happening with the Crater road closure. We had a cabin hike planned and the “official updates” are now non existent ??? There has been no visible smoke for days, seems odd. Any thoughts ?
Thanks, Roberto~~~ Hi Robert, good to hear from you. I don’t have any official information on when Crater Road might open. I drove by there yesterday (July 18th), and there was a sign saying the Park was closed. Perhaps you could call the Haleakala Park Ranger Station and inquire. Sorry you had to cancel your cabin hike!
Aloha, Glenn
-
July 11th, 2024 at 9:55 am
Mike Says:Thinking of you. Stay safe. We have appreciated your forecasts and comments since the old college TV broadcast days. Mike
~~~ Hi Mike, thanks so much for your well wishes, what with the wild fire we had going on last evening!
I don’t have any news about the condition of the fire this morning, although I’m hoping it’s been put out completely, what with the strong trade winds expected today.
Aloha, Glenn
-
July 11th, 2024 at 9:43 am
Keith Says:Good morning, Glenn, not sure if I sent this earlier email to your correct address so copying here:
Glenn, can you possibly do a kind of localized wind report/wind forecast for the area of the fire and upper Kula? Although winds approaching the islands are from the NE, winds at the fire location around milepost 8 on Crater Road are said to be moving SE, which would be away from homes. And how are YOU doing? Let us know – you live up here somewhere, I know!
Keith
~~~ Hi Keith, thanks so much for your well wishes! Indeed, I do live in the upper Kula area, although from here I couldn’t see any flames, as the wild fire was further up the mountain from my location. Indeed, the gusty trade winds were blowing the fire away from homes, unlike the last big wild fire we had last year…thank goodness!
I’m doing fine, thanks for asking, and will post any news that I get about this recent wild fire on my Narrative Page.
Thanks so much for checking in with me!
Aloha, Glenn
-
July 5th, 2024 at 10:31 am
Helen Says:Yay ! Thank you so much for your website Glenn.
So glad to see the statewide temps are back !!~~~ Hi Helen, and a very good morning to you! Like you, I’m very glad those temperatures are available again! Always good to hear from you my friend!
Aloha
-
July 5th, 2024 at 9:44 am
Shane Says:Hi Glenn, very happy to see the return of the daily temps! Love this website, I enjoy it daily. Keep up the great work!
~~~ Hi Shane, good to hear from you again! Indeed, me too, it was a long wait, although the NWS finally was able to fix the problem! So happy to know you are still an avid reader, thank you my friend!
Aloha, Glenn
-
June 20th, 2024 at 7:50 am
Shane Says:Hi Glenn, love your website, I’m a daily visitor and fellow weather watcher. I’ve noticed the daily max/min temperatures from each island have been removed, is that a permanent change?
~~~ Hi Shane, good to hear from you, and thanks for your positive comment about my site! No, I hope it’s not going to be a permanent change. The information for that data comes from the NWS forecast office in Honolulu. That info hasn’t been available on their site for almost a month! So, I just took it off my site until the info becomes available. I check their site several times each day, and will put it back on my site as soon as it becomes available again.
Aloha, Glenn
-
June 19th, 2024 at 11:10 am
Roberto Says:Hi Glenn, Mr Astronomy here … pretty sure Solstice is Thursday, gotta plan those “pagan” celebrations ! Ha ha 🙂
~~~ Hi Roberto, indeed, you are absolutely correct, I’ve changed the day to Thursday…thanks my friend!
Aloha, Glenn
-
June 10th, 2024 at 10:02 pm
Ricky Says:Hi Glenn, a long time fan, Rick with Maui car rentals. Retired a couple years ago. live 2 miles past ulupalakua. Had a freak wind today around 1030. Ripped 2 solar panels off our roof, yet 20 feet away, cloths over our deck rail didn’t move! Is it just our spot on the mountain? Aloha, Rick
~~~ Hi Rick, good to hear from you, yes of course I remember you! Wow, that certainly was a freak wind event! As for why, I honestly don’t have a good answer to why that happened! At any rate, I’m sorry to hear that your solar panels got ripped off your roof! Geez, good luck with getting those panels back in place, and lets hope that was just a random gust of wind…and it won’t ever happen again!
Aloha, Glenn
-
June 5th, 2024 at 5:41 pm
Jen Says:Hi Glenn! The Vog forecast dashboard is finally back up and running, I sure missed being able to watch that! Vog is really pumping this week with Kilauea venting and suspect that’s a lot of our haze. Yesterday in Kihei it was so thick we couldn’t even see upcountry at all.
~~~ Hi Jen, thanks for letting me know about the return of the vog animation map! I just put a link to it on my Narrative page. Indeed, it has been very hazy the last several days, largely due to the unusually low inversion layer over the state of late.
Aloha, Glenn
-
June 3rd, 2024 at 3:06 pm
Suzanne Albers Says:Aloha Glenn
I have been a big fan of your weather site over the years! So complete and accurate.
I’ve noticed that you have beautiful or unusual photos of Maui attached to your Webpage. Having lived on the west side for over 12 years, I have a beautiful Collection of photos
Some are exceptional and you could pick out what you like. If yes, do I send them to your email…which is??
Mahalo, Suzanne
~~~ Hi Suzanne, thanks so much for your very kind and positive comments about my website!
As for your pictures that you’d like to share, I would gladly take them and share them, however, they each have to have their own URL, I can’t just copy and paste out of an email.
Please let me know…
Aloha, Glenn
-
May 28th, 2024 at 7:00 pm
Dwight Says:Hi Glenn,
Thank you highlighting the 2024 NOAA Hurricane Forecast, I pray for a safe passage through the Hurricane Season.
I noted in your response to me below regarding the dry effects following on an El Niño cycle I’m wondering if the quick transition to a La Niña cycle will negate some of those concerns? Also do we have a forecast for our summer/fall rainfall yet?
Aloha,
DwightDry season (May through September 2024) outlook
– Probabilities favor La Niña development during the summer.
o La Niña expected to persist into 2025.– NOAA Climate Prediction Center’s forecast probabilities and climate model consensus favor below average precipitation through the rest of the dry season and into the start of the 2024 – 2025 wet season.
o Note: Dry season totals will be skewed by the unusual May kona low.
o May rainfall at Honolulu AP (4.90” as of May 20) already exceeded its dry season average (3.56”).
– Below average dry season precipitation typical for the summer months of a La Niña onset year.– For many areas of the state, April and May rainfall will help delay onset of significant drought, possibly until mid- to late-summer.
o Exceptions are the leeward slopes of Haleakalā on Maui, and the Humuʻula Saddle region of the Big Island. These areas have not been able to recover due to less rainfall than other areas.– Impacts, once they start to occur, are expected to be the worst for non-irrigated agriculture, water systems dependent on surface water diversions, and residents relying on rainfall catchment.
– Due to late wet season rainfall, significant wildfire risk is expected to develop later than the normal late-July to early-August time frame.
o Similar to significant drought potential, exceptions are the leeward slopes of Haleakalā on Maui, and the Humuʻula Saddle region of the Big Island. -
May 19th, 2024 at 5:18 pm
Marge Says:Hey Glenn,
Is there a reasonable explanation for NOAA combining south maui and upcountry in the Zone Area Forcast? Unless it is strong Kona these two areas could not have different weather.
Thanks, Marge
~~~ Hi Marge, you know, I tend to agree with you, as often Kihei and Kula have completely different weather conditions, especially when it comes to clouds and temperatures, and often rainfall as well. The mornings can be much more similar, at least in terms of cloud cover, although often clouds stack up along the leeward slopes of the Haleakala Crater during the afternoons…with the leeward beaches remaining sunny. In terms of winds, the leeward coastal areas are often more windy too, compared to Kula or Ulupalakua. I’ve often wondered what the answer to this questions was, although still haven’t heard a good reason.
Aloha, Glenn
-
May 14th, 2024 at 9:44 am
marjorie classen Says:Aloha Glenn,
I haven’t seen the “Closer Look” feature in your report for the last three days.
Are you dropping that map? Hope not, I enjoy going around the world and seeing
the weather.
Aloha,
Marjorie~~~ Hi Majorie, oops, I accidentally missed that section of my website, although have put it back where it was…sorry about that. Thanks for pointing that out to me.
Aloha, Glenn
Aloha, Glenn
-
May 13th, 2024 at 11:10 am
Roberto Says:Aloha Glen, question ? What do the red and blue signify on the lows/cold fronts on weather maps and the half circles and triangles ? Inquiring minds want to know :). Thanks, RL
~~~ Hi Roberto, those alternating red and blue symbols along a cold front signify that it’s stationary:
A blue line with blue triangles and red half circles, the stationary front symbols
A stationary front happens when a cold front and a warm front meet up, but neither moves out of the way. On a weather map, a stationary front is usually drawn using alternating cold front and warm front symbols. Stationary fronts bring long rainy periods that stay in one spot.
I hope this helps your inquiring mind…
Aloha, Glenn
-
May 10th, 2024 at 10:45 am
Robert Says:As always Thank you for being a great reliable source of information. You are much appreciated!
Mahalo Nui Loa 🙂~~~ Thank you Robert, I really appreciate your positive comment!
Aloha, Glenn
-
May 2nd, 2024 at 4:38 pm
Dwight Says:Hi Glenn,
Welcome home! I Always feel better when you’re back on the rock with us.
Just kind of curious about the El Niño, La Niña forecasts. As I recall it has been that La niña would indicate dryer weather and El Niño would be wetter. However El Niño is also now forecast as dryer.
Do I have that mixed up or has climate change wrought this?
Aloha,
Dwight~~~ Hi Dwight,
El Nino:
— Rainfall tends to be above average for most of the El Niño year. Dry conditions tend to start by the end of the El Niño year and are at their worst during the first half of the Year After El Niño. In some cases dry conditions can persist for the entire year after El Niño.
— Water supply will decrease
— Farming & crops will be damaged
— Habitats for terrestrial and marine plants and animals will be stressed
— Health problems – bacteria in water and food, lack of food, and
dehydration
— Wild fires risk will increaseLa Nina:
La Niña is defined as cooler than normal sea-surface temperatures in the central and eastern tropical Pacific Ocean that impact global weather patterns. La Niña has the opposite effect of its hotter cousin, El Niño. The atmosphere cools in response to the cold ocean surface, and less water evaporates. The cooler, dry air is dense. It doesn’t rise or generally form extreme storms. As a result, less rain falls over the eastern and central Pacific.
During a La Niña cycle, such winter storms tend to be less frequent.
Historically, Hawaii could expect more consistent rainfall during a La Niña cycle, but that may changing.
I hope this abbreviated information helps…
Aloha, Glenn
-
April 27th, 2024 at 12:34 pm
louise rockett Says:The weather in Napili this spring has been windy and cool most of the season. When will the weather turn to more springlike days?
~~~ Hi Louise, I’d say that the upcoming new work week will likely be quite nice, with the wild card being Thursday into next weekend…when it could turn more cloudy and potentially wet. I’d suggest staying tuned in, to see which way it goes as we get closer to the second half of the new week ahead.
Aloha, Glenn
-
April 20th, 2024 at 8:40 pm
Kelly Says:Aloha,Glenn,
Thank you, as always, for being our weatherman bar none.
I may have missed this but I don’t recall hearing what you think the prognosis is for this Spring and Summer may be.
I’ve heard it could start out hotter and dry, that El Nino is waning. Thoughts?~~~ Hi Kelly, good to hear from you, and thanks too for you positive comments!
Here’s the official information from the Climate Prediction Center as of April 18th, 2024:
Enhanced probabilities for above normal temperatures are forecast for Kauai, Oahu and Maui and Equal Chances (EC) for above, near or below normal temperatures are forecast for the Big Island in (May-June-July) 2024, consistent with most dynamical model forecasts. Enhanced probabilities for above normal temperatures are forecast for the Big Island, Kauai, Oahu and Maui in (June-July-August) 2024 through (August-September-October). The forecast signal weakens at longer leads, therefore EC is indicated for Hawaii beginning (September-October-November) 2024 and extending through all longer leads thereafter.
Enhanced probabilities for below normal precipitation are forecast over the Hawaiian Islands (Kauai, Oahu, Maui and the Big Island) from May-June-July 2024 to September-October-November 2024, consistent with most dynamical and statistical model forecasts. Due to considerable uncertainty in the precipitation forecasts from dynamical and statistical models, EC is indicated over the Hawaiian Islands beginning in (October-November-December) 2024 through longer leads.
I hope this helps Kelly!
Aloha, Glenn
-
April 3rd, 2024 at 11:44 am
Rick Says:Good morning, the wind is real. it looks like the area down south on Maui, Big Beach, does not have the same wind issues today, in the forecast. Is that correct?
Appreciate as always.
~~~ Hi Rick, indeed the gusty trade winds are buffeting the islands, at least in those exposed areas. It appears that the Makena area may be just outside of the strongrest winds, although it wouldn’t surprise me to see some robust gusts coming through on occasion.
Aloha, Glenn
-
March 8th, 2024 at 11:18 am
Mauri Says:Glenn, always very appreciative of the amazing work you do! Living on lower Omaopio, always curious as to what to expect weather-wise and your info is invaluable for me to my plan my days, mahalo nui!
~~~ Hi Mauri, good to hear from you down there on Lower Omaopio, that drier and warmer part of upcountry Maui. Thank you very much for your very positive and support comments…they are greatly appreciated my friend!
Aloha, Glenn
-
February 17th, 2024 at 11:50 am
robert defazio Says:aloha Glenn
your website is so detailed, you don’t leave out a thing. I appreciate the time you put in to it.
a really true forecast. Still longboarding?
Aloha Robert~~~ Hi Robert, good to hear from you! Thanks very much for your positive feedback on my website, it’s greatly appreciated my friend!
Nope, I stopped longboarding, due to the sun and the crowds, have a tough time dealing with either of those. Although, surfing most of my life was a great sport, I must have ridden a million waves!
Aloha, Glenn
-
February 10th, 2024 at 10:59 am
Butch Says:Good morning Glen!
Thanks for your weather wisdom and continuous gifts of info you bestow on we Maui Beagles, making the complications of weather predictions digestible, even so a beagle can understand!
I was interested in yesterdays “INTERESTING” article about blueberries, will you please send me a link to that info!
Thanks for your community support, we appreciate you Glen!
Aloha, Butch~~~ Hi Butch, good to hear from you. You’re very welcome, I love making complex weather information understandable to the lay person.
The interesting article on blueberries can be found here:
https://www.enn.com/articles/74087-scientists-reveal-why-blueberries-are-blueI really appreciate your positive feedback my friend!
Aloha, Glenn
-
February 9th, 2024 at 2:14 pm
mary buchheim Says:Glenn
Just felt an earthquake here in Kihei.
did you feel it up in Kula?mary
~~~ Hi Mary, absolutely, the USGS is calling it a 5.7 earthquake, which is pretty darn strong. It occurred down in Pahala on the Big Island.
Aloha, Glenn
-
February 2nd, 2024 at 8:57 pm
Martin Frye Says:Aloha Glenn
Re: the Jan 17th question from Lannuy Daise, there is an initiative called Hawaii Mesonet that would be worth a look for anyone interested in statewide climate and weather data.
https://www.hawaii.edu/climate-data-portal/hawaii-mesonet/#
Thanks for all the great information on HWT–it is much appreciated by myself and my crew, who use the site on a weekly basis.
Sincerely
Martin~~~ Hi Martin, what a great weather site, thank you for sharing this, I was unaware of it!
You are so welcome, I’m so pleased that you use my weather site on a weekly basis…truly!
Aloha, Glenn
-
January 28th, 2024 at 2:23 pm
Jeff McConnel Says:Aloha Glenn,
Was looking at the surface analysis this morning. I cannot recall ever seeing the greater North Pacific with ten “lows” and no “highs”. That seems remarkable. Hope you are well.
Aloha Jeff
~~~ Hey Jeff, indeed, that is a remarkable array of low pressure system straddling the 35N to 43N latitudes of the north Pacific! Also interesting that they each have their own cold fronts dangling down from their centers! It’s winter!
I’m well, thanks, and I trust you are too…
Aloha, Glenn
p.s. it’s getting very windy up here in upper Kula early this Sunday afternoon!
-
January 26th, 2024 at 12:24 pm
robert defazio Says:aloha Glenn, been following you since you for were on t.v for 15 minutes. Love the website, very thorough. Don’t remember getting so much SW winds in the winter, especial with front coming from the NW. Aloha Robert Defazio
~~~ Hi Robert, Thank you very much for your positive feedback on my website!’
It’s true, I can’t remember a recent winter that’s had so many days with kona winds, and back-to-back cold fronts sweeping down towards our islands, or even through the state…leading to a distinct lack of trade wind days!
I personally don’t mind, as I enjoy approaching cold fronts very much, and the rains that they can bring with them. As long as the winds from the south and southwest don’t get too strong, I don’t mind them either.
Thanks for your good observation Robert!
Aloha, Glenn
-
January 21st, 2024 at 12:52 pm
john A Matthews Says:Aloha Glen. I’m curious why …why or rather when will Haleakala camera get fixed?
Johnny in Pukalani.~~~ Hi Johnny, I’m curious about that too! I have no idea when they will fix that camera? Fixing it soon would be my wish!
Aloha, Glenn
-
January 17th, 2024 at 3:55 pm
Lanny Daise Says:Aloha Glenn:
As a boat owner out in Mala Wharf mooring field, I’m always grateful for your great forecasting and easy to understand narrative!
I’m anxious to build my own weather station and wonder if you’d like data from the Kapalua area? Also, would there possibly be any grants I can apply for you may know of to help with setting up a station?
Mahalo,
Lanny~~~ Lanny, good to hear from you.
Thanks for letting me know you appreciate my website!
I’m always interested in accessing weather information from anywhere around the islands. Unfortunately, I know of no available grants to help you purchase your weather station for Kapalua.
Let me know if you do in fact set up a station, good luck!
Aloha, Glenn
-
January 17th, 2024 at 10:54 am
Matt Valentine Says:Glenn, where can I find accurate rainfall totals for Kihei Maui?
~~~ Hi Matt, nice to hear from you.
As for keeping track of rainfall data online, I’d recommend using the information from the NWS forecast office in Honolulu. Here’s a link to the best page, and you’ll find a listing for Kihei by scrolling down on the page to the Island of Maui header:
https://forecast.weather.gov/product.php?issuedby=HFO&product=RRA&site=hfo
Interesting that the Kihei #2 gauge received 2.66″ of rain during the last 24 hours!
I hope this properly addresses your question…
Aloha, Glenn
-
January 16th, 2024 at 11:44 am
mary Says:Glenn
Raining cats and dogs here in Kihei. The gulch behind my house is roaring. Never seen it this full in 15 years~~~ Hi Mary, indeed, we have a rain band moving through Maui, which has brought heavy rains with it! There are very gusty kona winds blowing too! Stay dry my friend, and looking at radar, the heaviest rains should pass us by soon, as it moves out into the Alenuihaha Channel between Maui and the Big Island.
Aloha, Glenn
-
January 16th, 2024 at 11:11 am
Bill Ferguson Says:Aloha Glenn
The hourly rain at my weather station this morning was .81″ per hour and 1.2 total. I looked at a PWS in Wailea and it was raining 3.56″ per hour. That is the hardest rain I’ve ever seen on Maui.
Mahalo, Bill.~~~ Hi Bill, yes, incredibly heavy rains! Thanks for letting us know! Here in upper Kula, it has been raining, although nothing like what you and Mary have reported. Stay dry Bill, and it should be over soon, as the heaviest rains ease up.
Aloha, Glenn
-
January 13th, 2024 at 12:59 pm
Nancy Lorenz Says:48.5 degrees? Brrr! At least itʻs not 48!
Hi Nancy there in Sebastopol…hahahah…it was 44.5 yesterday morning!
Aloha, Glenn
-
January 12th, 2024 at 7:41 pm
RIck Says:Glenn, we have been visiting Maui regularly for a while but are thinking about Kauai in April. With only a week to visit that island after a bit on Oahu, have the rain risks diminished by then? Or have I overstated the rain in the Poipu beach area?
My yearly question. Thanks.
~~~ Hi Rick, yours is a good question. As for rain in the Poipu area on Kauai in April…April is just past the rainy season here in the islands. In addition, this year we have El Nino conditions, which are suppose to make our weather drier than normal. Plus, Poipu is on the leeward side of the island, the drier south side of Kauai.
I’d say you have all these things working for you, that is if you’re looking for warm sunny weather…like most folks are while on vacation.
So, I’d say come ahead, and have a fabulous vacation on this beautiful island!
Aloha, Glenn
-
January 11th, 2024 at 2:44 pm
Bonno Says:What area is Kula 1?
~~~ Hi Bonno, Kula 1 is about half way down the mountain from the Haleakala Crater summit…down towards Makena Beach. The elevation is about 6,620 feet about.
Aloha, Glenn
-
January 5th, 2024 at 1:09 am
Helen Says:It has been raining here in Olinda for about 5 minutes or so.
Yay!~~~ Hi Helen, yes, yay is right! The afternoon clouds got rather thick and even shower prone as we pushed into the early evening hours. It lightly rained here in Kula as well, and the Kula Branch Station gauge, down around Morihara Store, ended up having the largest rainfall total anywhere in Maui County over the last 24 hours (0.14″).
Early Friday morning has dawned clear here in Kula, as the recent high level cirrus clouds have finally departed. However, I would expect that clouds will increase again this afternoon, and we could see some more showers in the upcountry areas from Olinda around the mountain to Kula, Keokea, and Ulupalakua.
Thanks for letting us know about your rain there in Olinda Helen!
Aloha, Glenn
-
January 1st, 2024 at 11:59 am
Cheryl Says:Happy New Year, Glenn! Thanks for your weather reporting all these years!
~~~ Hi Cheryl, Happy New Year to you as well, very kind of you to think of me! Indeed, I’m still putting out these daily weather updates…and have been since 1996! You’re very welcome!
Aloha, Glenn
-
December 28th, 2023 at 5:29 pm
Caitlin Says:Aloha Glenn
Just wondering if you have ever thought about creating an app for your weather reports…? My family and I follow your reports religiously, and find your reports the most accurate here in Maui/ Hawaii overall!
Have a great day 😀
~~~ Hi Caitlin, I appreciate your comment, and I would certainly create an app if I knew how to do that. If you can help me do this please get in touch via my email…at the bottom of any page on my website. Or, if you know of someone who could help me, I’d be very open to that as well.
Please let me know one way or another, and I’d look into this right away.
Aloha, Glenn
-
December 25th, 2023 at 9:15 am
Jerry Says:Merry Christmas Glenn- Thanks for all the great weather reports through the years….and happy new year as well.
~~~ Hi Jerry, thanks so much, and a Merry Christmas to you as well…and a most happy new year to you too!
You’re very welcome, I love keeping this website going each day, which I’ve been doing since way back in 1996.
Aloha, Glenn
-
December 18th, 2023 at 11:14 am
Suzanne Says:When is the cold front going to end?
When is it going to warm up, it’s freezing?
Thanks.~~~ Hi Suzanne, that is a very valid question! Well, the problem has been a couple of things, first of all we’re at the very tail-end of autumn and almost entering the winter season, our cooler season of the year…even here in the tropics.
The other issue has been the north to northeasterly winds, which funneled in over us in the wake of the last cold front. The combination of these two factors has had us feeling chilly in the nights and early mornings, and even during the afternoon hours. The high temperatures haven’t been able to reach 80 degrees, even in most sea level locations. The low temperatures have dipped into the 60’s at night, and even bottomed-out at a very chilly 58 degrees in a couple of places a few days ago.
What we need for some warming is to have our winds shift to the east or even southerly directions, which would do some good in moderating the tropical chill. As for the season, well, winter is our cooler season obviously, so I’d recommend you keep an extra blanket handy for your bed, and to keep that warm sweater within easy reach too!
We’re getting easterly winds now, although we’ll have lots of sun blocking high clouds over the next several days, and off and on wet weather too, at least along the windward coasts and slopes. I don’t know where specifically you live here in Hawaii, but the leeward sides will be a bit better…although showers may spill over into those areas at times too. This coming weekend should find better weather with less cloudiness and showers.
Happy Holiday’s Suzanne!
Aloha, Glenn
-
December 13th, 2023 at 12:21 pm
Roberto Says:Aloha, Glenn and Seasons Greetings. Thought you and sky watchers might be interested, the Geminid peak a bit later this year. Tonight! Hoping for some breaks in the predicted cloudy/wet weather). Some activity last night (watched at about 2:30 AM for 20 minutes) – peace, Starman R 🙂
What potentially will be the best meteor display of the year is just around the corner, scheduled to reach its peak on late Wednesday night/early Thursday morning, Dec. 13-14: The Geminid meteor shower.
The Geminid meteors are usually the most satisfying of all the annual showers, even surpassing the famous Perseids of August. Studies of past displays show that this shower has a reputation for being rich both in slow, bright, graceful meteors and fireballs as well as faint meteors, with relatively fewer objects of medium brightness. Geminids typically encounter Earth at 22 miles (35 km) per second; roughly half the speed of a Leonid meteor. Many appear yellowish in hue. Some have even been seen to form jagged or divided paths.
~~~ Hi Roberto, good to hear from you! Seasons greeting to you as well. Thanks so much for sharing this Meteor Shower information! I’ll check it out tonight!
Aloha, Glenn
-
December 1st, 2023 at 10:47 am
Tim Says:Aloha Glenn
Thank you so much. Will wait to hear.
Tim~~~ You bet!
Aloha, Glenn
-
December 1st, 2023 at 6:14 am
Tim Smulian Says:Can anyone please tell me if there are outages in Hana and vicinity today, Friday 1st December 2023? I checked Hawaiian Electric and their Maui map does not populate. Thank you
~~~ Hi Tim, I’ll post this here, and if anyone has information about your question they can email you at this address:
Plutoman46@gmail.comBest of luck finding out Tim…
Aloha, Glenn
-
November 29th, 2023 at 11:51 pm
Eric Phillips Says:Aloha,
Really cool lenticular clouds here on the big island!~~~ Hi Eric, I love lenticular clouds, they are rather unusual here in the islands, although they grace our skies at times. Thanks for letting us know of their presence down your way on the BI!
Aloha, Glenn
-
November 13th, 2023 at 2:47 am
Ann Says:Looking forward to your return and boots-on-the-ground weather reports.
~~~ Hi Ann, thanks! Yes, I’ll be home this coming Thursday…looking forward to it.
Aloha, Glenn
-
November 10th, 2023 at 3:13 pm
Gregg Seiler Says:Aloha Glenn!
It seems we’re all having water shortages here in Maui–even over here on the “wet side” in Huelo. Our spring-fed stream is running lower than any of the long-timers around here remember!My question is: from a historical perspective, how unusual is the current drought in East Maui? And, is there a web site that shows average vs. actual rainfall for East Maui in the past? We’re getting nervous out here!
Mahalo!
~~~ Hi Gregg, good to hear from you with your good question. I’d say it is very unusual, although certainly not unheard of before. As a matter of fact, way back when, dozens and dozens of year ago, when I lived in Haiku, I recall a period when all the typical green grasses in the fields and everywhere, went totally dry and turned brown! It felt very weird then, and as I’m not yet back on Maui, (I come home next Thursday) I don’t know the state of the grasses at this time.
I don’t know of a website that gives the information that you’re looking for, in regards to average vs. actual rainfall data. I totally understand your being nervous, especially with the unusually strong trades that are on the horizon ahead. Not sure you know, but I was evacuated from my home in upper Kula from the wild fires. My house didn’t burn, but many in my general area burned right to the ground!
Bottom line is that the rains will return, although NOAA is suggesting that this winter’s rainy season will be much drier than normal…which isn’t a comforting thought at all!
Aloha, Glenn
-
November 9th, 2023 at 1:07 pm
Maggie Stumpp Says:Aloha Glenn. As you know, we’ve experienced nothing but blue skies for weeks – even here in normally soggy Haiku. The water situation, however, is becoming quite serious and I’m forced to cut back irrigation of my coffee trees. Is there any rain in sight? Is there any relief in the long-range forecast??
~~~ Hi Maggie, indeed, dry conditions prevail, with limited showers expected today through Monday. However, there’s a better chance of showers, at least along the windward sides Monday night or Tuesday…lets keep our fingers crossed!
Aloha, Glenn
-
September 21st, 2023 at 11:41 am
akal Says:Aloha GLenn,
Interesting story on “dark earth”, was it an early form of composting?
Is composting a viable option with the volcanic soils in Hawaii? I am interested because I plan to relocate soon and “work and live off the land.”
Best Wishes,
Akal~~~ Hi Akal, yes, I would assume that this rich dark soil was a result of composting, although who knows what else they dug into the earth as well?
Oh yes, you can compost here in Hawaii, we do at my house in upper Kula, although we use a classic compost bin.
Sounds interesting, that you’ll soon be living off the land! Best of luck in your new endeavors!
Aloha, Glenn
-
September 20th, 2023 at 7:01 pm
David Hume Says:David Hume here,
Regarding currents around the Lahaina region. Water is sucked North past Lahaina, Kaanapali, and on past Kapalua. The reason for this is that the trade winds push surface water through the channel with wave action etc. Just below the surface a counter current, north/northeast is trying to keep the water upwind level with the water downwind.
If there are no trade winds then no counter current. I hope this makes sense. It does not look good for the water quality fronting the resorts of West Maui.
~~~ Hi David, thanks so much! Aloha, Glenn
-
September 19th, 2023 at 5:32 pm
Suzanne Says:Aloha Glenn…we live in Launiupoko, which is about 2 miles south of Lahaina town. I’ve been hearing a lot of information about how polluted the water is in Lahaina Harbor and beyond, after the fire catastrophe.
So much gasoline, oil, fiberglass, etc. And other toxic debris blown out to sea. Divers investigated the harbor and found a lot of boats just stacked on top of each other. They scooped up the sludge at the bottom and of course it was highly toxic. They said 100 boats caught fire and sank.
Question…How can people find out about the water quality along the beaches of west Maui and beyond? Which way do the currents go and does the direction of currents vary a lot?
When tourists return they will not be aware of the dangers of swimming in polluted waters, especially if they have a cut or sore.This applies to beaches anywhere along the western coastline.
Thanks for your reply…God Bless Lahaina and its people. We will never forget!~~~ Hi Suzanne, in looking for information relating to your question, I found these articles, which also points out the sources that will be informing the public going forward:
https://spectrumlocalnews.com/hi/hawaii/news/2023/09/15/water-quality-lahaina-harbor-horrible
https://mauinow.com/2023/08/30/ocean-water-testing-off-lahaina-begins/
As for the currents in and around Lahaina, I’m not knowledgeable about that, perhaps someone else could chime in with information in that regard.
Aloha, Glenn
-
September 3rd, 2023 at 4:06 pm
rege Says:Aloha Glenn,
Sorry to hear about the delay to get back home. I pray you will be in the comfort of your life long environs soon!
Hang in there my friend, “It’s a beautiful life if we do not weaken!”Aloha,
rege
~~~ Hi Rege, good to hear from you again…
Thanks for your encouraging words, I greatly appreciate your concern!
I’ll hang in there for sure…
Aloha, Glenn
-
September 3rd, 2023 at 3:15 pm
Steven M Arentz Says:Aloha Glenn,
Is the power and water still unavailable in Kula? What’s the plan for your house? Also, a bonfire was reported up near the Lavender farms near you last night…is that allowed during the summer?~~~ Hi Steven, power is back on, although despite the water running out of the tap, we’ve been told not to shower in it, much less drink it! I’m waiting on word, supposedly this coming week, whether my house is habitable yet. Then, if it is, we’ll have professional cleaners come in and do their thing, very thoroughly thereafter. As for the bonfire, I have no news about it, or if it’s allowed…makes me nervous to hear about it though. Everyone here on Maui is still very much on edge about flames.
Thanks for your comment Steven!
Aloha, Glenn
-
August 27th, 2023 at 6:42 pm
Bill Alpenfels Says:We’ve been getting some very welcome light rain here in Kula at Kulamanu for the past hour.
~~~ Hi Bill, that is good news, as I know how dry it’s been of late. Thanks for letting me know…as I’m over here in Haiku for the time being.
Aloha, Glenn
-
August 10th, 2023 at 10:32 am
Steve Kovaleski Says:Prayers and well wishes for you and for ALL on Maui. I can’t believe how much of Lahaina is gone. People around the world are now learning just how dry the leeward sides of the Hawaiian islands truly are. Stay safe and be blessed from Steve & Rachel in Michigan.
~~~ Hi Steve, very nice of you to send your well wishes from Michigan! It’s true, Lahaina really took a big hit, as did parts of the area that I live in…Kula. I see that the news is really focusing on the Hawaiian Islands, and especially Maui, due to the very high winds and out of control fires that took control of the island recently.
Aloha, Glenn
Fortunately my house didn’t burn, and I have a place to stay with friends who have taken me in until the power and water return at my place.
Aloha, Glenn
-
August 10th, 2023 at 9:23 am
Sandra Johnson Says:I’m just horrified watching what has happened in Maui. I’m thankful you are safe and your home has been spared. I think that life on Maui will not be the same for many years to come. I hope you are able to manage and pray that people are able to come together and support those that have suffered unimaginable losses. Be safe Glenn.
~~~ Hi Sandra, horrified is the right word, so many areas have burned, and many folks are suffering the loss of their homes and businesses! It’s such a disaster, and as you state, it will take a long time to get back to some semblance of normal.
We appreciate all the love and supportive energy that folks, like yourself Sandra…are sending to our island home!
Aloha, Glenn
-
August 9th, 2023 at 8:04 pm
Peggy Reeve Says:So good to hear that your home was spared, Glenn.
~~~ Hi Peggy, oh yes, we feel blessed to still have a home to go back to, that is when the power and water come back on.
Aloha, Glenn
-
August 9th, 2023 at 3:16 pm
Cheryl Says:Glen, oh no! I hope your home escapes damage from the fire!
~~~ Hi Cheryl, thanks for your well wishes…so far so good. There is no power and no water though, so I’m staying with friends in Haiku.
Aloha, Glenn
-
August 9th, 2023 at 2:12 pm
robie Says:good luck with your house Glenn. hope all is ok. also, thanks for your website. robie
~~~ Hi Robie, thanks, I’m safe and have a roof over my head with friends…until the power and water come back at my own house.
Aloha, Glenn
-
August 9th, 2023 at 12:06 pm
Susan Wilson Kottom Says:Dear Glenn, we are watching these wildfires from here in Minnesota. Please stay safe and may God be watching over Maui and the Big Island. Aloha to you Glenn
~~~ Hi Susan, thanks very much for your well wishes, it’s a crazy time here in the islands, and especially here on Maui!
The wild winds of yesterday have calmed down considerably, although there are still fires burning here and there!
Aloha, Glenn
-
August 9th, 2023 at 11:45 am
Barry Reder Says:Fingers crossed for you, Glenn.
Barry~~~ Thanks Barry, I appreciate your well wishes…and your crossed fingers!
Aloha, Glenn
-
August 9th, 2023 at 11:31 am
mary buchheim Says:Glenn
stay safe. i hope your house did not burn.~~~ Hi Mary, no thank goodness, my house didn’t burn, although houses very nearby did burn right to the ground!
Staying safe…
Aloha, Glenn
-
August 8th, 2023 at 10:15 pm
margaret stumpp Says:Aloha Glenn. I hope you are able to avoid the fires and smoke. The satellite loops show a very unusual pattern of thin, drawn out clouds sweeping in from the east. They almost appear like fish scales. I have never seen such an expanse of such clouds before. Do they have any meteorological significance and are they related to the strong winds we are experiencing?
~~~ Hi Margaret, good to hear from you on this very unusual day. I’ve been evacuated from my home by the fires in the area. I’ve relocated to friends in Haiku, over on the windward side of Maui, well out of the range of the many fires that are burning tonight. As for those strange looking clouds, they are indicative of very dry air, and the strong winds that are blowing between the high pressure to the north…and Hurricane Dora passing by well to the south.
Aloha, Glenn
-
August 7th, 2023 at 11:56 pm
David Hume Says:Aloha Glenn, what an awesome day today on the Kona side of the Big island! The best I have seen in over five years, hardly a cloud anywhere, a puff here and there, clear and sunny and warm, blue and blue! Now it’s getting dark and the stars are coming out, no sign of the incessant rain we have been suffering for so long. Thank you Glenn, for all you do for us, David.
~~~ Hi David, good to hear from you down there on the Kona side! It was the same here in Maui County, almost totally cloud free all day, although it was the warmest day of the year so far here in Kula! Glad you are having a break from the wet weather…should be about the same Tuesday.
You are very welcome, I love keeping you abreast of all the weather changes here in the state!
Aloha, Glenn
-
July 30th, 2023 at 7:36 pm
Douglas MacDougal Says:Aloha Glen,
National Geographic has an interesting article on the Veery Thrush and its ability to predict the intensity of the Atlantic hurricane season. I commend it to you.
As always thank you for your daily insights on all things.
Douglas~~~ Hi Douglas, good to hear from you again! I don’t subscribe to the National Geographic magazine, although perhaps we can access it online? It sounds like an interesting article, I’ve never heard of a Veery Thrush until now.
You are very welcome, I love keeping this website updated on a daily basis!
Aloha, Glenn
-
July 30th, 2023 at 5:34 pm
Lopaka Says:Aloha Glenn, thank you for all the information you provide through this site. I was just wondering; what is the highest recorded temperature for Kahului?
~~~ Hi Lopaka, excellent question! 97 degrees is the answer…
97 July 29, 2023
97 July 29, 2019
97 August 22, 2015
97 August 31, 1994
97 September 16, 2019Aloha, Glenn
-
July 30th, 2023 at 11:34 am
Jeremy Burns Says:Aloha Glenn, what is the sea level anomaly? Predictable?
Jeremy
~~~ Hi Jeremy, please see the answer I gave to Joanne below, in terms of a definition. Here’s a response to the second question you posed:
Coastal high water level events are increasing in frequency and severity as global sea-levels rise, and are exposing coastlines to risks of flooding. Yet, seasonal forecasts of sea-level anomalies are not made for most coastal regions. Advancements in forecasting climate variability using ocean-atmosphere models provide the opportunity to predict the likelihood of future high water events several months in advance. However, the skill of these models to forecast seasonal sea-level anomalies has not been fully assessed.
I hope this helps,
Aloha, Glenn
-
July 30th, 2023 at 11:00 am
Joanne Says:Aloha Glenn, have enjoyed your website for years but don’t remember you mentioning “sea level anomaly”. Could you elaborate?
mahalo
Joanne~~~ Hi Joanne, always good to hear that someone, in this case you, have enjoyed my website for years…thanks for letting me know!
As for your good question, a sea level anomaly in its simplest definition, is an inconsistency or deviation from the normal state of the sea level, and in this case…around the Hawaiian Islands.
Aloha, Glenn
-
July 27th, 2023 at 11:17 pm
Bill Ferguson Says:logging into your site is working again.
~~~ Bill, thanks, it was a hassle getting the site back up, although as you point out, we’re back in business again!
Aloha, Glenn
Glenn
-
July 27th, 2023 at 11:06 pm
Bill Ferguson Says:I had trouble logging into your website. The message indicated that your website might be compromised. I had to jump through a bunch of hoops to get to your site to send this message.
~~~ Hi Bill, yes, apparently a certificate of security lapsed today, so my website went away, unless someone, like you, jumped through those hoops! I was given no warning that this was going to happen! I’m pretty sure that things will be back to normal at some point Friday.Thank you for being a loyal reader Bill!
Aloha, Glenn
-
July 27th, 2023 at 4:36 pm
Patti Ballerini Says:Aloha Glenn! It certainly has been quite a year,weatherwise, and personally for a lot of us, as well. I was so sorry to hear of your mom’s passing. I lost my own mother, too, to dementia and it’s never easy to watch. All we can do is be kind and be close and I know that’s what you did. Happily , I’ll arrive with my family in Wailea this Sunday morning after a flight from very hot Folsom CA. It will be my 65th trip over and something that nourishes me all year till I can do it again next summer. Though I’ve told you before..your devotion to putting this website up every day no matter what is a blessing to so many— travelers and locals alike. Thanks for everything.
~~~ Hello Patti, how very nice of you, actually the right word is sweet of you…to write such a touching comment. It’s so true, this year has been a challenge in terms of the weather of course, and in many other ways too. I’m sorry that we both lost our dear Mothers!
Good news, you’re coming to Maui this weekend, AND for your 65th time!!! I truly hope this time is yet another excellent vacation for you. I know Folsom, CA is a hot place during the summer. I’m sure you will enjoy the trade wind breezes here, which is a blessing that we islanders and visitors share alike!
You are so welcome, and thank you for your very generous praise, on my keeping this website going for all these many, many years. It’s such a pleasure for me to provide all the new information on a daily basis, with you…and everyone else too!
Be Well Patti…
Aloha, Glenn
-
July 27th, 2023 at 1:45 pm
David Hume Says:Aloha Glenn…Weather Forecaster. The only profession where you can be wrong every day and not loose your job. Thank you for all you do.
~~~ Hi David down on the Big Island, right! Being in the weather forecasting business is a dream job, as you rightly point out!
Aloha, Glenn
-
July 27th, 2023 at 12:26 pm
Mike Says:Thanks Glen,
It will be interesting to see what happens.You’re welcome Mike, indeed, it will be interesting!
Aloha, Glenn
-
July 27th, 2023 at 12:35 am
Helen Says:Aloha Glenn,
I wanted to share with you I saw a fog bow today looking towards East Maui!
What a gift!
Aloha,
Helen~~~ Hi Helen, how cool, what a great sighting! A true weather gift!
Here’s a link to a picture of such a fog bow, some place else in the world:
Thanks!
Aloha, Glenn
-
July 26th, 2023 at 10:10 pm
Mike Says:Aloha Glen,
I’m just curious what possible weather impacts could happen to Hawaii if the gulf stream
Starts slowing?
It sounds like it’s happening quicker than anticipated?
Mike~~~ Hi Mike, what a good question! I don’t have a good answer, although it sounds like the Western United States could get drier…which certainly isn’t a good thing! This doesn’t necessarily translate to Hawaii getting drier, as we of course are over 2,000 miles west. However, I will keep my eyes and ears open for what the possible response would be here in Hawaii! Yes, everything seems to be happening way quicker than it was “suppose to”.
Hi again, I’ve been thinking about your question a bit more an hour or so later than when I gave you an answer, or actually I didn’t give an answer. I would imagine that if the Western U.S. becomes much drier, that we would have a large nearly stationary high pressure system to the west of the coast, perhaps elongated from north to south. This in turn would likely shield the coast and inland areas from having rain bearing lows and cold fronts impacting this large western region…especially in the fall and winter months, into the early spring season.
If this large blocking area of high pressure were to remain nearly stationary for a long time, it would spin out steady trade winds into the Hawaiian Islands. This in turn could perhaps keep the windward sides off and on wet, as clouds and showers would be carried into these areas on the trades. It’s hard to say what the leeward sides of the islands would experience, although on some of the smaller islands, these showers could spill over into those areas. So, this is just my best guess, although I’ll continue to see if there’s any verification from other sources on this.
Aloha, Glenn
-
July 25th, 2023 at 4:09 pm
rege Says:Aloha H.W.T Readers,
I was hesitant to inquire about the Haleakala camera, thought my old Mac was the problem. Thank you Karl for noticing what I have: Starry sky all of the time? It would be nice if some of the Mauna Kea cameras were dispersed to the other islands. There are so many of them I get tired trying to scroll through them all! Perhaps changes for the better are coming.
rege
p.s. For sure need one of the cams at Glenn’s weather tower!~~~ Hi Rege, good hearing from you again. I know, that hit and miss camera up on the summit of the Crater…grrr.
You know that’s a good idea, to get a camera for my weather tower, I’ll look into it, thanks for the idea.
I especially like the Mauna Kea cam during the winter months…when it’s snowing…or there’s lots of snow on the ground!
Aloha, Glenn
-
July 25th, 2023 at 12:50 pm
Karl Rohlfing Says:Aloha Glen, just curious as to why the Haleakala Cam is so unreliable? The Mauna Kea cam is always available, does nobody care?
~~~ Hi Karl, that’s a very good question! I notice it being on the blink quite often too, while the Mauna Kea cam never misses a beat! I’m not sure who cares about the Haleakala cam, but at least we do!
Aloha, Glenn
-
July 20th, 2023 at 11:57 am
Liz C Says:Aloha Glenn,
Just wondering where is the weather chart/map? I grew up reading those things (Dad was a weatherman, too!) and miss seeing “the bigger picture”. Haven’t seen it for a few days now…
Mahalo nui from Kaimu/Kalapana.~~~ Hi Liz, good to hear from you down on the Big Island. Oh, your Dad was a man of the weather too! I put it back up on the Narrative page, you will see it…if not let me know.
Aloha, Glenn
-
July 19th, 2023 at 12:20 pm
Lou Says:Aloha Glenn,
Mid Kula, near Morihara Store got absolutely zero wind or rain last night/this morning, perfectly Calm and quiet all night.
Cheers,
Lou~~~ Hi Lou, interesting, you were well protected by the Haleakala Crater! Thanks for letting me know!
Aloha, Glenn
-
July 18th, 2023 at 10:38 pm
Chico Says:Glenn. Mahalo for the updates. Will keep checking in over the upcoming hours. Be safe.
~~~ Thanks Chico, you’re very welcome! You and yours stay safe too! Aloha, Glenn
-
July 17th, 2023 at 10:41 am
Rebecca Says:Hi Glenn,
With the approaching tropical storm, historically how has the airport done with these storms? We are set to travel to Maui on Wednesday. Not sure if what is expected to hit Maui is out of norm for the airport operations.
Fingers crossed Calvin moves to the south!~~~ Hi Rebecca, very reasonable question you pose. The Kahului AP is likely to get some weather from the passage of Calvin to the south. However, planes would not land here if it was dangerous, they would fly instead to another AP in the state! So, if they do land, you wouldn’t have to worry, they are very responsible, and wouldn’t take any chances. I know you will have a great time here on Maui, as Calvin will be gone by Thursday on…with good weather returning right away!
Aloha, Glenn
-
July 15th, 2023 at 10:05 am
Bett Bidleman Says:Happy Birthday, Glenn!
Is it common for the air to be very dry, hot and still as a hurricane approaches? No wind and very warm and dry here in Honoka’a yesterday in the northeast corner of the Big Island, as it continues to be this morning. The same thing happened when we lived years ago on the southeast corner of the island and a hurricane approached.
~~~ Hi Bett, thank you!
It is quite common for the subsiding air outside of the tropical cyclones active center area, to bring dry and warm air down to the surface. Calvin is still too far away to bring that type of dry air. Granted the air was very dry and shower free for the most part yesterday, although today we’re seeing more moisture arriving on the trade winds. This same dry air situation on the outskirts of a tropical cyclone, perhaps with Calvin, could clear out skies, before the clouds and showers directly associated with TC Calvin, likely arrive into the state around the middle of the upcoming work week.
Good question!
Aloha, Glenn
-
July 14th, 2023 at 5:07 pm
Lyle & Norine Says:Happy Birthday You Man of the Weather! Glenn, We Pray that You will have a nice Birthday! We are So Thankful for You! You are a Daily (important) part of Our lives! Thank You Very Much!!!
~~~ Hi Lyle and Norine, very nice to hear from you!! I very much appreciate your Happy Birthday well wishes, truly. I’m very happy as well, that you utilize my weather information, and that it’s an important part of your day…how kind of you to let me know!
Best Aloha, Glenn Weatherman James 🙂
-
July 5th, 2023 at 1:58 pm
Maggie Says:Aloha Glenn. Dumb question: i’ve noticed a distinct correlation between high cirrus drifting over Maui from the SW and the persistence of showers over the north shore. It seems as though the filtered sunlight permits trade wind showers to drift just a little further inland. It has gotten to the point that whenever i see high cirrus approaching Maui on your satellite feeds, that I can expect a damp day here in west Haiku – even if it remains dry elsewhere on the island. It almost feels like winter conditions here today, even though I see bright blue skies over the central valley. Could there be such a localized correlation, or is it spurious?
~~~ Hi Maggie, your question is a perfectly good one, as there’s no dumb questions on this website! Does the appearance of high cirrus clouds, or even middle level altocumulus or altostratus clouds, have some direct correlation to the showery conditions along the windward side of east Maui?
These higher level clouds are carried in our direction from the more southern latitudes, in the deeper tropics…by the subtropical jet stream winds. In contrast, the lower level clouds, the cumulus and stratus clouds arrive, thanks to the trade wind flow from the northeast and east of Hawaii. So they’re actually arriving from completely different directions and locations.
So, I’d say no, the high level clouds are at a completely different layer of the atmosphere, than the lower level clouds. What I see having more to do with your windward shower activity, is the off and on arrival of low level clusters of clouds, impacting the windward coasts and slopes. In addition, when there are upper level low pressure systems in the general area, they can enhance any of this shower activity.
I’m glad you’re watching the satellite imagery, as they will foretell the arrival of these showery clouds, much more than the sight of high cirrus clouds, or middle level clouds. BTW, these icy or partly icy higher level clouds often give us those beautiful sunset colors…like we’ve been seeing lately.
Maggie, I hope this helps, I’ve always enjoyed your comments over the years, keep em’ coming!
Aloha, Glenn
-
June 28th, 2023 at 5:30 pm
John Hoover Says:Hi Glenn, I first moved to Honolulu in 1978 and in those days I seem to recall that hearing thunder was quite uncommon. Rare, even. But now we hear thunder quite frequently. Of course, I live in Volcano, now. So that might make a difference. But do you recall thunder being uncommon on Maui back in the day? Is it more common now? Or Is my memory just poor? — Thanks, John
~~~ Hi John, good to hear from you. Yes, I moved to Hawaii in 1975, so we’ve both been here quite a long time. During those many years I’ve heard thunder quite few times. However, I’d say that it is far from common, although I always enjoy seeing a flash, and then hearing rumblings of thunder afterwards.
Thunderstorms stand out to me, and are actually one of my favorite weather elements! Of course down on the Big Island, those common afternoon Kona showers, can sometimes become heavier…with an occasional thunder clap as well.
The thing that limits thunderstorms for the most part, despite the fact that Hawaii is in the tropics, is that we often have trade winds blowing, with moderate to strong levels pretty regularly. The trades limit the vertical growth of cloud development, thus, limiting the amount of cumulonimbus clouds from forming.
The trade winds are often blocked by the height of the big mountains down your way, so that the clouds can reach higher in many cases…prompting that thunder you hear more often than elsewhere around the state. I personally wish that we could have more thunderstorms, say at least a couple of times per month, rather than only a few times per year! Aloha, Glenn
-
June 14th, 2023 at 4:53 pm
rege Says:Hi Glenn,
How tall is your weather tower? Does it have full electric, water lines and plumbing?
Can any homeowner erect one or are special permits required? { Is there a hot tub!}
Just kidding! Often try to visualize what it looks like. Suppose a picture is out of the question?
Thanks for many years of “Hawaii Weather Today” updates!
rege~~~ Hi Rege, I’d like to respond to your valid questions, tongue in cheek if you don’t mind. The height of my “tower” is about 60 feet…give or take 35 feet or so. Yes, it has full electricity, although no plumbing, and no water. In fact this tower of my mine is where I sleep too, with windows looking out in all directions. It’s built with a mostly surrounding weather deck, where I keep a couple of chairs and my ping pong table. No, I’m afraid there’s no hot tub, although that would be very nice indeed!
You’re welcome, those many years you speak of…actually turn out to be 27 years!Aloha, Glenn
-
June 10th, 2023 at 5:16 pm
Gregg Seiler Says:Aloha Glenn!
I see this kind of phrase often in your forecast for us out here in Huelo: “ East winds 10 to 25 mph decreasing to up to 25 mph”. This confuses me, since anything under 25mph isn’t a decrease. Can you explain, please?
Mahalo!~~~ Hi Gregg, I totally understand what you are pointing out. Actually, the forecasts on those island pages come from the NWS office in Honolulu. I just called them and asked about it, and the gentleman said that the text comes from a graphic, and it is monitored by a human, and sometimes there’s a slip…like the one you point out. He said he would pass it up the line.
Good call Gregg, thanks
Aloha, Glenn
-
June 10th, 2023 at 12:03 am
Jerry durkan Says:Hi Glenn! I see the El Niño has begun since May. Any thoughts on what effects we will see on Maui?
Great job on the website and welcome back.~~~ Hi Jerry, thanks for your welcome back to Maui!
As for the returning El Nino here in Hawaii:
Rainfall tends to be above average for most of the El Niño year. Dry conditions tend to start by the end of the El Niño year and are at their worst during the first half of the Year After El Niño. In some cases dry conditions can persist for the entire year after El Niño.
• Water supply will decrease
• Farming & crops will be damaged
• Habitats for terrestrial and marine
plants and animals will be stressed
• Health problems – bacteria in water
and food, lack of food, and
dehydration
• Wild fires risk will increaseThe 2023 hurricane season outlook from NOAA is, “There is a 50% chance of above-normal tropical cyclone activity during the central Pacific hurricane season this year, according to the outlook from NOAA’s Central Pacific Hurricane Center and NOAA’s Climate Prediction Center, divisions of the National Weather Service. The outlook also indicates a 35% chance for near-normal activity, and only a 15% chance of a below-normal hurricane season.
I hope this helps…
Aloha, Glenn
-
June 9th, 2023 at 3:31 pm
Lloyd Shiraki Says:Aloha again Weather man James,
Surf finally came up @ Ho’okipa along with the wind & it actually rained this morning. Didn’t last long though due to the winds but it was an Aloha Friday blessing.
Aloha & have a great Friday,
Lloyd Shiraki 🤙🏾~~~ Hi again Lloyd, good weather and wave news!
Aloha, Glenn
-
June 8th, 2023 at 6:23 pm
Lloyd Shiraki Says:Aloha Weatherman James,
It’s been weeks without rain or Surf.
Praying for both. Hopefully @ least rain. My grass in Ha’iku is dried up.🤣
Aloha have a nice day,
Lloyd Shiraki~~~ Hi Lloyd, good to hear from you over there on the windward side of east Maui.
Weeks? Well, I’ll admit it has been rather dry, and not much more than some wind swell wrap at Hookipa, although…slim pickin’s indeed. Passing showers have been pretty spare too, although perhaps we may have some help during the start of the upcoming new work week. I hope so! In the old days, I mean way back there, I’ve seen all the grass in Haiku a crisp brown color…THAT was super dry!
Aloha, Glenn
-
June 7th, 2023 at 11:10 am
john A Matthews Says:Please put the vog emissions link up. Kilauea is pumping out ash again. Thanks.
~~~ Hi John, I just put the Vog map back on the Narrative page…same place it was before.
Aloha, Glenn
-
June 3rd, 2023 at 7:57 pm
Lori Parnell Says:Aloha! I’m on north shore Oahu I envy your weather in Kula I used to live in haiku. 🙂 just curious if you know a good site for vog forecasting? I cannot find one the interagency one always seems wrong or no info? I’m very sensitive to vog!
Mahalo!~~~ Hi Lori, sorry to hear of your sensitivity to volcanic haze (VOG). As for a forecast, are you familiar with this website:
http://weather.hawaii.edu/vmap/new/
I hope you find it useful!
Aloha, Glenn
-
June 1st, 2023 at 1:41 pm
douglas Says:Good day Glenn! I coսld have sworn I’ve Ƅeen to this website before bսt after looking at some of the posts I realized it’s new to me. Anyways, I’m certainly happy I found it and I’ll boоkmark it ɑnd check back frequently!
~~~ Hi Douglas, thanks for your comment, and I’m glad you found my website!
Aloha, Glenn
-
May 30th, 2023 at 3:22 pm
Wayne Kuzek Says:Hello Glen, I know how you are feeling with the passing of your mother. I too left my parents to live a distance away and when my father passed and then 3 years later my mother passed, it was very hard to go back to the house where I grew up knowing that the house will be sold and will never step foot in it again. I do miss my parents but I know this, we are brought into this world to make the lives of those around us better. Our parents did that for us and now that they are gone, we do that for our family and friends.
~~~ Hello Wayne, very good to hear from you, thanks for your sincere comments about losing people in our lives, really some of the most important people…our parents!
Indeed, I’m on the same page as you, to support the lives of those around us! I am doing that, and I’ll continue doing that.
Best of luck to you my virtual friend, be well!
Aloha, Glenn
-
May 21st, 2023 at 5:18 pm
Larry Jones Says:What are your thoughts and predictions about hurricane season in Hawaii after June 1st as El Niño arrives
~~~ Hi Larry, I’d say an active tropical cyclone season, although lets wait for the official forecast by the Central Pacific Hurricane Center…a bit later this month.
Aloha, Glenn
-
May 15th, 2023 at 12:40 pm
Suzanne Says:Aloha Glenn…..What is your opinion about El Niño that’s predicted for this summer?
How could it affect HAWAI’I, as well as the islands of Fiji, where we may plan a trip for August or September…basically could there be more rain or less?
Thank you! Suzanne~~~ Hi Suzanne,
Rainfall tends to be above average for most of the El Niño year. Dry conditions tend to start by the end of the El Niño year and are at their worst during the first half of the Year After El Niño. In some cases
dry conditions can persist for the entire year after El Niño.Aloha, Glenn
-
May 4th, 2023 at 1:31 pm
Jim Hestand Says:Glenn, My deepest condolences on the loss of your mother. You’ve done as well as you could over the past few years and I’m sure she was well proud of you and your sisters giving her the care you did. Thanks also for your work with the weather prognostications over the years. Aloha, Jim
~~~ Hi Jim, good to hear from you my friend. I greatly appreciate your very kind words about the loss of my beloved Mom recently. I did give my Mom the best of everything that I could all my life, as she did for me and all my siblings.
You’re very welcome, I love bringing you the daily weather and updates year after year, always have and always will.
Sending the very best wishes back your way Jim!
Aloha, Glenn
-
May 3rd, 2023 at 10:32 pm
jjo Says:Hi Glenn,
Hope you continue to care for yourself; it will take time and my wishes are that you experience the blessing I have – in that, I feel very close to my Mom still after about 20 years of her leaving our planet.
Best, Jo~~~ Hi Jo, thank you for your kind words, and thank you also for the encouraging words of feeling close to our Mom’s going forward…I’m sure through the rest of our lives! I really appreciate you taking the time to write me such a sincere comment.
Aloha, Glenn
-
May 3rd, 2023 at 10:03 pm
Nancy Says:Hi Glenn, I love getting your local NorCal weather forecasts while you are here! Especially since I love this kind of weather!
Nancy~~~ Hi Nancy, yes, we both love these cool, cloudy, and off and on rainy days! It appears that this chilly spring weather will continue through the next week, both here in Marin and up in Sonoma County too…with even the chance for a couple more wet days along the way!
Aloha, Glenn
-
May 1st, 2023 at 9:11 pm
Vicki Senter Lane Says:Dearest Glenn, You have been such an amazing son. Following you here with the weather and your mom reports for so many many years, you’ve brought us all into your family circle. I hope you’re able to take in all the love and support as you navigate this immeasurable loss. May you be filled with tenderness and grace. Though we have never met you are part of my Maui ohana. Our hearts are with you. Vicki
~~~ Vicki, such kind and loving words, I so much appreciate your openness. You’ve been following my words on the internet for a long time, I’m flattered! I have been filled with tenderness and grace from all quarters, I’ve been so supported by so many people, most of whom I’ve never met, although I’m finding out that it doesn’t really matter if one has met another, face to face, there can be a connection and a friendship across the internet ether!
Thank you from the bottom of my heart Vicki!
Aloha, Glenn
-
May 1st, 2023 at 4:09 pm
rege Says:so sorry to hear of your moms passing.
~~~ Hi Rege, thank you my friend, I appreciate your caring thoughts.
Aloha, Glenn
-
April 30th, 2023 at 10:11 pm
Bunt Biurkhalter Says:Something like 20 years ago I met your Mom on an inbound flight. She asked if I lived on Maui and I said yes…she stated then she said you must know my son. After a bit of explaining I said yes. She was so proud of you and exuded it and LOVE.
Hang in there Glen.~~~ Bunt, how wonderful to know this, oh my, this helps to make my day absolutely! My Mother bragged about me to everyone she saw my whole life, she loved me so much…which is why I have loved her dearly right to the end! I so much appreciate your sharing this story, it brings tears to my eyes. Thank you so much Bunt, I GREATLY enjoyed reading your words, they sent me to Heaven so to speak.
Aloha, Glenn
-
April 29th, 2023 at 7:17 pm
Helen Says:Aloha Glenn,
Deepest sympathies to you and your family on the loss of your dear mother.
Our hearts go out to you. Please take good care of yourself during this difficult time.
Thoughts and prayers to you & and yours.🕯️~~~ Hi Helen, very nice to hear from you again, for sure! I, we gratefully accept your deepest sympathies…you are so kind to offer them to us! I’m taking good care of myself, as I know how important that is now. Thank you my friend…
Aloha, Glenn
-
April 29th, 2023 at 3:22 pm
suusann henderson Says:So very sorry, Glen, my heart goes out to you and to your mother who is flying free and looking down on you with such love.
~~~ Hi Suusann, very good to hear from you in Marin County! Thanks so much for your heartfelt words of comfort towards my Mom and I, that’s really appreciated! Flying free and showering me with love, such love…what a nice image to share with me!
Aloha, Glenn
-
April 29th, 2023 at 12:08 pm
mary Says:Glenn you and your ohana have my deepest sympathies for the loss of your Mom. Keep your memories of her close to you. She will never be far from you.
Mary
~~~ Oh Mary, such kind and generous words of comfort! I love reading your words…She will never be far from you! Thank you kindlyAloha, Glenn
-
April 29th, 2023 at 10:40 am
Kabba Anand Says:Sending you love in this most tender moment. My mother died less than two years ago. It has been a powerful experience. Loss and gratitude, love and grief. Wishing you and your family support and a sweet sendoff.
~~~ Hi my friend Kabba, very nice to hear from you! Indeed, as you know, and now I know, losing our Mom is a powerful experience! I like the way you put it…loss and gratitude, love and grief. We are receiving your kind support…thank you kindly!
Aloha, Glenn
-
April 29th, 2023 at 10:37 am
marjorie Classen Says:Aloha Glenn,You were the best son you could be, Dorothy Rae was the best mother she knew how to be. A successful life, know your sweet mother will still be with you in spirit, always.
Love and comfort to you brother, and sisters.
Marjorie~~~ Hi Marjorie, good to hear from you again as well! I did my level best to support my Mom through her long long life. My Mom was so generous with me in every way that she could, I feel blessed to have been on the receiving end of your Motherly love! We are receiving your love and comfort Marjorie.
Aloha, Glenn
-
April 29th, 2023 at 10:33 am
Phil benoit Says:Aloha Glen,
Your mother was fortunate to have such a loving son.
Peace and love to you and your family from mine.Phil
~~~ Hi Phil, good to hear from you again! Your kind words are like music to my ears on this eventful morning in our lives. Having my Mother pass away is likely the biggest lose of my life. Thank you for your well wishes to my family from yours!
Aloha, Glenn
-
April 29th, 2023 at 10:11 am
Colleen Lisowski Says:Aloha Glen,
Blessings on your journey with your mother’s passing. Thank you for sharing and acknowledging the profoundness when parents pass, no matter how prepared we are. Prayers for your mom and for your family. Thank you for your weather insights as it is always so formative. Be well~~~ Hello Colleen, I appreciate your kind blessings over my Mom’s passing this morning! We openly accept your prayers for my Mom and for our James Family as well…thank you kindly.
You are very welcome, providing your weather insights each day is largely what helps me to stay on the straight and narrow. I was a very young weather boy, and now I’m a senior citizen…still on the weather path.
Aloha, Glenn
-
April 29th, 2023 at 10:08 am
Jeff McConnel Says:Aloha Glenn,
Sorry to hear of your mom passing away this morning. May she be in a better space. To live a century is an incredible gift. My thoughts are with you. Take care. Aloha
~~~ Hi Jeff, thank you so much, indeed, to have lived over 100 years was an incredible gift for my Mom…and to her children as well! I feel your kind thoughts Jeff!
Aloha, Glenn
-
April 29th, 2023 at 9:53 am
Joy Says:May God bless you and your family during this difficult time, Glenn. As the grief turns to sorrow and the sorrow turns to loving memories, my heart is with you.
~~~ Hello Joy, thank you so much, we greatly appreciate your touching words!
“As the grief turns to sorrow and the sorrow turns to loving memories”. I feel your heart being with us…it’s comforting!
Aloha, Glenn
-
April 27th, 2023 at 1:07 pm
Susan Says:Dear Glen,
I have been a long time fan of your web site and appreciate you continuing to post despite this difficult time. Sending aloha to you and your mom from Maui.
-Susan~~~ Hi Susan, so happy that you’ve been a long time reader of this website! Indeed, this is a most difficult time, as my Mom is ready to pass on. However, the truth is that updating this website through this ordeal, continues to give me a temporary release from the emotions that I have for my Mom. I really appreciate your kind words, and for sending Aloha to my Mom and I…you’re a kind person!
Aloha, Glenn
-
April 26th, 2023 at 5:14 pm
Shane Says:Hi Glenn, longtime fan of your site and daily narrative, wanted to relay that I am thinking of you and your Family at this difficult time, and hoping for a peaceful transition for your Mom. Take Care
~~~ Hi Shane, anyone who is a long time fan of this website is a good friend of mine!
Happy to know that you are thinking of my Family, and hoping for a peaceful transition for my Mom!
She is in a good place now, and I’m both happy and very sad that I will be losing her on so many levels, although I’ll be carrying her forward in no uncertain terms, in my memories of she and I together through all these years together!
Best wishes and Aloha,
Glenn
-
April 26th, 2023 at 1:31 pm
Otter Says:Glenn,
Wishing you the best in this difficult transition and wishing your mom a peaceful departure as well. May she live on in your daily thoughts and memories…
With aloha,
Otter~~~ Hello Otter, very good to hear from you during this difficult transition! Thank you for wishing my great Mom a peaceful departure, which is exactly what’s happening now. Absolutely, my Mom will live on in my memories of her through the rest of my life, my Sister’s lives, and my Brothers too.
Very kind of you to leave this caring comment Otto, thank you!
Aloha, Glenn
-
April 26th, 2023 at 3:11 am
Kelley Kinney Says:Aloha Glenn
Just want you to know that I am praying for your mom and you and your sisters.
It was so touching what you said about your mom. So beautiful how you love your mom so much. I know how hard this must be for you.
I used to watch your weather show on T.V. when I first moved to Maui in 1994. And now I always check your website to find out the weather. I think you’re really awesome and very good at your job. I’ll keep you in prayer that God comforts you and helps get you through this!Kelley Kinney
~~~ Hello Kelley, very good to hear from you, and I and my Family are very open to your prayers. You are so kind to write these touching words of support during this unusually sad time in my life. You’ve been around a long time if you used to watch my daily TV weather show! It makes me happy to know that you use this website for your weather information source now. What can I say, you think I’m awesome and very good at my jobs, but…thank you, thank you, thank you!
Aloha, Glenn
-
April 26th, 2023 at 12:29 am
Bonno Says:Thinking of you. Sending you hugs and blessings. To a long time friend, there is nothing like family. ♡
~~~ Hello Bonno, indeed my long time friend. Thank you so much for your hugs and blessings, they mean a lot to me during this very sensitive time in my life!
Aloha, Glenn
-
April 25th, 2023 at 7:29 pm
Catherine Says:Sending many blessings and much love to you and your family. Holding your Mom in the divine light, may she transition wrapped in a blanket of grace.
~~~ Hello Catherine, you’ve shared such beautiful and kind words on my Mom’s behalf, truly. I greatly appreciate your taking the time to share your lovely feelings with my Family…thank you very much!
Aloha, Glenn
-
April 25th, 2023 at 7:05 pm
Patti Says:Aloha Glenn, I am holding you and your family in the arms of love and comfort during these difficult days. May your mother’s transition be full of grace and beloved memories of your years together.
Patti~~~ Patti, I am so so grateful for your love and comfort during these difficult times! I appreciate your lovely words in relation to my Mother’s passage, as what more could anyone wish for…than to be full of grace and beloved memories! We have been close friends for so very long, and I just love hearing from you with these kindest of kind words! Thank you so much!
Aloha, Glenn
-
April 25th, 2023 at 9:18 am
Helen Says:Aloha Glenn,
Thinking of you, your mom and your siblings.
Take good care of yourselves. Sending you all love & light.
Aloha,
Helen~~~ Hello my good friend Helen, thank you for your caring and very kind words, the James Family greatly appreciates your generous sharing of love and light!
Aloha, Glenn
-
April 25th, 2023 at 6:19 am
Cheryl Says:Hi Glen, ❤️ to you, your Mom, and your family. It’s so good that you can all be there for her. Cheryl
~~~ Hi Cheryl, so good to hear from you, I greatly appreciate your kind words during these sad moments for the James Family!
Aloha, Glenn
-
April 24th, 2023 at 1:51 am
Jeremy Burns Says:Aloha Glenn, so sorry to hear that, keeping your ohana in our thoughts.
I’ll be sailing back from Oahu to Kauai tomorrow. We’ll probably motoring if this forecast pans out.
Aloha,
Jeremy~~~ Hi Jeremy, nice to hear from you, and thanks for your well wishes towards my Family!
Yes, light winds are in the forecast, best of luck on your sail from Oahu to Kauai!
Aloha, Glenn
-
April 23rd, 2023 at 7:25 pm
mary Says:Glenn
I am keeping you, your Mom and the rest of your family in my thoughts and prayers as your Mom completes her final journey.~~~ Hi Mary, I appreciate your sincere thoughts and prayers! Thank you for keeping us in mind during this time, it’s so kind of you! You’ve always been very supportive of what I have going on in my life.
Aloha, Glenn
-
April 21st, 2023 at 12:03 am
Cheryl Says:Hi Glen, we’re getting several inches of rain here in Kailua, Oahu, at 8 PM, it’s settled right over us, no wind.
~~~ Hi Cheryl, thanks for your on the spot weather report from Oahu! I’m always happy to hear what’s going on there along the windward side of Oahu. Stay dry my friend!
Aloha, Glenn
-
April 14th, 2023 at 9:16 pm
Marge Kelm Says:Hey Glenn, We were surprised to see quite a bit of snow up on the mountain yesterday afternoon, Kihei side of the observatories. We were totally surprised at this unexpected snow in April. Did you get any other reports? Nice to here you are getting good days with your mom. Aloha, Marge
~~~ Hi Marge, no I didn’t get any other reports, and am really surprised that you saw snow up there…like you were! Thanks for letting me know! I heard nothing about this unusual snowfall from anyone else. Indeed, I’m happy to be having some quality time with my Mom at this time in her life, in this time in my life!
Thanks Marge!
Aloha, Glenn
-
April 5th, 2023 at 10:03 pm
Kitt L Says:Aloha Glenn,
I hope your Mom is comfortable. I went through the long dementia journey with my Mom, too. It’s a tough one. Some things I found helpful in getting a reaction from her were to sing, she loved “You are my Sunshine” and looking at old photos. Also, does you Mom speak any other languages? Interestingly I found that part of my Mom’s brain still worked. Thinking of you, sending love & support.
Malama Pono,
Kitty
PS. I used to talk with you in the mornings years ago when I was at the Kapalua Airport.~~~ Hi Kitt, very good to hear from you, with your encouraging words about my Mom! I appreciate your taking the time to share what helped you get through the experience of your Mom’s passing. My Mom is not well at times, and then recovers at other times…so it’s an up and down journey for both of us. I try and keep my cool, although at times, especially after I leave her for the day, it certainly pulls at my heart strings. I of course try and keep my Mom as comfortable as possible, which at this point is mostly having her take varying doses of aspirin. Thanks again for your kind support!
Aloha, Glenn
p.s. yes, I do remember you from the old days!
-
March 29th, 2023 at 9:22 pm
Helen Says:Aloha Glenn,
I sure hope your mom is feeling better today.
Please give her our best!~~~ Hello Helen, that’s such a nice thing to say, and I appreciate your kindness! She was feeling better today, which was a big relief for me! I will tell her tomorrow that you wished her well.
Aloha, Glenn
-
March 27th, 2023 at 11:39 pm
Laura Says:Aloha Glenn- What is the source of the article about fish processing/consumption? Would love to send it around to folks. And in general, where do you find the content for the “Interesting” section? It’s all fascinating!
~~~ Hi Laura, good to hear from you. The source of that article is:
https://www.anthropocenemagazine.org/daily-science-2/page/14/?el_dbe_page
I have several sources, the primary one is the Environmental News Network…happy that you enjoy that section of my Narrative Page!
Aloha, Glenn
-
March 25th, 2023 at 11:02 pm
Del Alexander Says:Hi Glenn! Hope you’re enjoying your visit with your mom! It’s been years since I last emailed. Here on Kaua’i, I use your page daily! Thanks for all you do! My wife is coming to Maui this week to hike Haleakala two cabins Tuesday night, and Wednesday night with long hikes in between. We have done the circuit about 25 years ago. Pretty hard to tell what the weather will be on those days, any suggestions would be appreciated.
~~~ Hi Del, good to hear from you…thanks for using my website for your daily weather information! As for your wife’s trip into the Haleakala Crater, I’d suggest that she use the following page for the weather outlook ahead for the Crater.
https://www.hawaiiweathertoday.com/maui.php?zone=HIZ022
It gets updated many times each day, so she can consult the information on a daily basis as her time to hike into the Crater approaches. I hope she has a fabulous experience…I’ve been in and out of the Crater many, many times while living here on Maui.
Aloha, Glenn
-
March 23rd, 2023 at 10:48 pm
Ann Freitas Says:Glorious sunset tonight overlooking Kihei Maalaea from Lower Kula. Broken layer grayish clouds undertone of pink with gold glow hugging the blue sea.
~~~ Hi Ann, good to hear from you. A friend was playing Pickleball in Wailuku this evening, and she took a photo of the sunset, and as you say…it was a real beauty! I appreciate your letting me know what it looked like from your vantage point!
Aloha, Glenn
-
March 23rd, 2023 at 9:36 pm
Gianna Says:Aloha Glenn!
Next week (3/28-4/3) will be my first time in Hawaii (Oahu) and I have been stressed because all the main weather sites have forecasted that it will be raining the whole time. Luckily, I was referred to your site by some more seasoned visitors and it’s helped calm my nerves and reassure I’ll get to see some sun during my stay. Just wanted to say thanks & that you have a wonderful and extraordinarily informative site!~~~ Hi Gianna, good to hear with you, and glad to hear that you have a vacation planned on Oahu…which is a great island. I’m happy that you found more encouraging weather forecasts for your planned visit…on my site! I’d like to thank you very much for your generous and very kind comments…I greatly appreciate that!
I’m sure you will have a very pleasant visit to Hawaii, and will very likely head back home with a warm afterglow.
Aloha, Glenn
-
March 17th, 2023 at 10:06 am
Carlos Says:Hello Glenn,
Are you able to get an idea of the forecast in Maui for March 23-28 ? We are starting to get worried since it looks like there will be rain but wanted your input on it ?~~~ Hi Carlos, I would suggest that you refer to this weather forecast page, by clicking on whatever location on Maui that you would be interested in:
https://www.hawaiiweathertoday.com/maui.php
I don’t see any problem with at least the first day you arrive. The forecasts get updated 4-times a day. Return to the page as your arrival time gets closer…to see further into your vacation time.
Best of luck,
Aloha, Glenn
-
March 14th, 2023 at 12:32 am
Maile Says:Hello Glen!
What’s the forecast for March 21-23 in Poipu?~~~ Hello Maile, the forecast for Poipu on the dates you request are just beyond my forecast window. However, soon the 21st of March forecast will be available. I’d suggest that you refer to the following page, and it will give you forecast updates 4-times a day as you get closer to your arrival date on the beautiful island of Kauai:
https://www.hawaiiweathertoday.com/kauai.php?zone=HIZ031
You will have a fabulous time on Kauai!
Aloha, Glenn
-
March 12th, 2023 at 11:58 am
Laurie Rohrer Says:Hi Glenn — what does the “sand” sometimes tossed onto various islands represent? Mahalo!
~~~ Hi Laurie, I’m not exactly sure what you are asking me? However, the first thing that comes to mind is that sand is dredged from somewhere else, perhaps offshore, and brought back to some of our local beaches…to replenish areas that are running low on sand for one reason or another.
If I’m missing the point of your question, please let me know.
Aloha, Glenn
-
March 9th, 2023 at 3:12 pm
Jim Says:Hi Glenn, I love your website. I always refer to it when we come to Hawaii. My wife and I are coming to Maui and staying in Wailea 3/16 – 3/22. Any outlook on the long term forecast? Thank you
~~~ Hi Jim, so glad that you refer to my website when you have a planned trip here to paradise!
Your date of arrival is still just past my furthest weather forecast outlook, however, I’d recommend that you use this website to find out what you’ll be having weatherwise when you arrive…it’s updated four times a day:
https://www.hawaiiweathertoday.com/maui.php?zone=HIZ049
I’d say at this point, you are in luck!
Aloha, Glenn
-
March 3rd, 2023 at 7:42 am
Toni Says:We are coming this week and staying in Wailea. It seems like rain every day. Will there be any sun Monday and Tuesday? We have helicopter and surf activities
I’m guessing our bike ride down the volcano will be canceled~~~ Hi Toni, we’re in the middle of an unusual weather pattern here in the islands. To answer your question, it appears that Monday may be the better day (weatherwise) for your outdoor activities. However, there will be some sunshine Tuesday as well, although there will likely be some passing showers too.
I would recommend that you use this weather forecast page to see what’s coming:
https://www.hawaiiweathertoday.com/maui.php?zone=HIZ049
Best of luck, and I’m sure you will have a great vacation!
Aloha, Glenn
-
March 1st, 2023 at 2:05 am
Ian Says:Hi James
I’m hiking the Kalalau Trail March 20/25. Any speculation on the weather coming up at that time?
Mahalo, Ian~~~ Hello Ian, that should be a great hike! However, in regards to what the weather will be like that on Kauai, that far out into the future…I don’t have a clue!
I’d suggest that as the time gets closer for your hike, you refer to this weather forecast page to get the particulars:
https://www.hawaiiweathertoday.com/kauai.php?zone=HIZ029
Best of luck…
Aloha, Glenn
-
February 23rd, 2023 at 10:13 am
Maria Says:Hi! What a great resource and website. So happy we found it.
Escaping the huge blizzard in the Midwest on Tuesday (2/28) until 3/10. How will our weather be? We are doing Hapuna Beach first 5 days and Kaanapali the next 5 days.
Current forecast shows rain after 3/5. Hope it’s wrong! Desperately need sun!~~~ Hi Maria, I can totally understand that you want some warm sunshine on your body, especially since you live in the cold country! Your arrival date is just beyond my forecast outer point. So I’d recommend that you utilize this forecast page going forward, at least for your Kamuela stay on the Big Island:
https://www.hawaiiweathertoday.com/big-island.php?zone=HIZ026
Then, when you get over here to Kaanapali, Maui, you can use this forecast page:
https://www.hawaiiweathertoday.com/maui.php?zone=HIZ018
By the way, don’t believe those long range weather forecast sites, they won’t be accurate!
Best of luck, I’m sure you will have a wonderful vacation…you’ve picked some great areas!
Aloha, Glenn
-
February 18th, 2023 at 7:09 pm
Mary Says:Hi Glenn,
When can we expect to have some drier weather and at least a little sunshine on the Kohala coast on Big Island?
~~~ Hi Mary, good to hear from you over on the Big Island. I’d say you’ll have the best chance of seeing some, at least partial sunshine, would be next Wednesday and Friday. Be had a little muted sunshine here in Kula today, which was nice…just before it started to rain again.
Aloha, Glenn
-
February 17th, 2023 at 6:07 pm
Raquel McComas Says:Hi hawaiiweathertoday.com webmaster, Thanks for the valuable information!
~~~ Hi Raquel, you’re very welcome, thanks for your positive feedback.
Aloha, Glenn
-
February 17th, 2023 at 3:47 pm
David Says:Hi
I have been a big fan of your website and
your dedication to your craft should be honored!
My question is
That i live in haiku and I would like
to know what u recommend for me
to track the rain .
Thx
Aloha
David~~~ Hi David, good to hear from you, and thank you very much for your high praise for my dedication to reporting weather here in the islands!
I’m not exactly sure what you mean by how to track the rain? Actually, everything you need is updated on my Glenn’s Narrative Page…many, many times of day. If you scroll down from the top of the page, you’ll find how much rain has fallen on Maui, usually updated each hour, unless I’m playing Pickleball, out for a walk, or down in Paia shopping.
If you want on Haiku’s specific rainfall, this is where to find that, just scroll down the Narrative page until you see Island of Maui…and then look down the list for Haiku:
https://forecast.weather.gov/product.php?issuedby=HFO&product=RRA&site=hfo
In addition of course you can look for the looping radar image for Oahu and Maui County / and also Maui County and the Big Island, and then you can see what rain is coming your way.
I hope this helps, if not, let me know more specifically what you are looking for.
Thanks again for using my website…
Aloha, Glenn
-
February 17th, 2023 at 2:39 pm
Mary Says:Hi Glenn!
It’s rainy and gloomy in Western Big Island right now. We are scheduled to fly back to Seattle on Monday evening. Do you think there’s a chance we can see some sunshine before then or clouds and rain is all that’s expected?~~~ Hi Mary, gloomy indeed, the entire state is socked in with gray clouds and no sunshine I’m afraid. I dislike saying this, although it appears that this cloudy weather is likely to continue down there on the Kona coast. You know the weather though, it can change on a dime, and lets hope you get some rays of sunshine before you depart!
Best of luck…
Aloha, Glenn
-
February 16th, 2023 at 10:16 pm
Chico Says:Very exciting and worrisome storm approaching. Mahalo for the top notch updates. Will be back many times thru the upcoming weekend. Be safe all. Glenn, Mahalo from all that check this page on a daily basis.
~~~ Hi Chico, good to hear from you. Good words to describe what we have going on here in the islands now. You are very welcome, I greatly enjoy keeping everyone updated on the latest weather conditions, I honestly never get tired of doing this year in and year out.
Stay dry Chico…
Aloha, Glenn
-
February 16th, 2023 at 10:51 am
Shelley Says:Hi there!
We arrive in Maui tomorrow morning, staying 2/16-2/22. Looks pretty rainy! We have a hike planned and Whale watching. Should we be as stressed as we are? Really hoping to see some breaks in the rain and don’t want to cancel our plans.
~~~ Hi Shelley, I totally understand your concern with the upcoming weather conditions here on Maui, as it looks pretty rainy! There will be some breaks in the rainy weather, there always are, so I’d recommend picking and choicing what you do each day, depending up what the weather is doing. I’m sure you’ll end up having more fun than you might think…from the rather gloomy outlook going forward.
Best of luck…
Aloha, Glenn
-
February 16th, 2023 at 10:15 am
Sony Says:Hi, we are on our way to the airport now to fly to Maui Feb 16th through 21st to visit family. We have a 2-year old. Should we be turning back and canceling the trip? Our flight boards in an hour 🫣
~~~ Hi Sony, by the time I received your comment/question, I’m pretty sure you are either in the air flying here, or you’re already here. So your question about cancelling your trip isn’t up for an answer now. Granted, there will be rain while you are here for your short visit, although I’ll bet you’ll have a better time than you might be worrying about! Best of luck!
Aloha, Glenn
-
February 15th, 2023 at 1:25 pm
Meredith Says:Coming to Kihei Feb. 19-28. The Weather Network shows terrible rain for every single day yet your page is less gloomy. Do we listen to your forecast since you are local?
Thanks so much.
~~~ Hi Meredith, it’s true we are headed into a wet weather pattern, however it won’t be nearly as gloomy as the mainland weather forecasters are suggesting. I would strongly recommend using the following weather forecast for south Maui:
https://www.hawaiiweathertoday.com/maui.php?zone=HIZ049
There will be some showers, no doubt about it, although later on in your vacation the weather will turn much better. BTW, it won’t be raining everyday all day long!
I know you will have a great time here on Maui, despite whatever weather that Mother Nature throws your way!
Aloha, Glenn
-
February 15th, 2023 at 11:47 am
Meghan Says:Hi, Glenn.
Thank you for this amazing resource. Hoping you might be able to weigh in on our dilemma. We have a tent camping trip planned in Maui 2/16-2/21. 1 night Olowalu, 2 nights Wai’anapanapa, then last 2 nights Hosmer Grove in Haleakala. We are prepared for rain everywhere and freezing temps on Haleakala. Our tent withstands wind fairly well. However, while we know the weather can be variable, it appears that conditions may be worse than usual and potentially unsafe given flash flood warnings and potential wind conditions. Are we interpreting the weather reports correctly? It was some serious effort to pull off this trip and we really don’t want to cancel, but also want to be responsible. It’s just hard to tell how serious or potentially dangerous the conditions might be in these areas. Any thoughts are beyond appreciated as we struggle to decide whether to cancel or not. Many thanks for your time!~~~ Hi Meghan, you’re really putting me on the spot…smiling. Personally, I wouldn’t cancel, and would just take what I got. It sounds like you will be well prepared, and let’s not forget…you will be on Maui. I don’t see your areas being particularly flood prone, although I certainly can’t know for sure. You will be getting into some rainy weather, although you already know that. So, yes, I would just make the best of it, and I’ll bet you find it to be not as bad as you might fear. Best of Luck, and I’m sure you’ll have more fun than you might think!
Aloha, Glenn
-
February 15th, 2023 at 10:01 am
Eliz Says:We are staying in Kapalua Feb 16th -27th. Accuweather.com is showing lots of rain throughout this time. We are traveling from a far distance (and could reschedule) and looking forward to beach time. What are your thoughts about these websites and their accuracies?
~~~ Hi Eliz, good to hear from you. I’ve found that the mainland weather forecasting sites are often not accurate. I would recommend using this weather forecast page for your stay in Kapalua:
https://www.hawaiiweathertoday.com/maui.php?zone=HIZ018
I’d say come ahead, and be your own weather woman. Use the forecast map to click on where you might want to go any particular day. You can drive to different parts of the island and find different kinds of weather.
I’m sure you are concerned at the moment, however I trust that you will end up having a great time, and will go home with a delightfully warm afterglow of the tropics!
Best of Luck…
Aloha, Glenn
-
February 14th, 2023 at 10:10 pm
Tiffany Williams Says:Hello Glenn, we will be traveling to Maui Feb 19-26. We will be in Lahaina on Ka’anapali Beach. Should I be checking the weather for Lahaina Leeward West region? Thank you, Tiffany
~~~ Hi Tiffany, good to hear from you. Yes, you should use the Leeward West Maui weather forecast page.
You’ve picked a good area of Maui to visit. That coastal area of West Maui is one of the driest and warmest in the state. I trust that you will have nice weather, with lots of warm sunshine, and not many showers…at least for the beginning of your vacation. Beyond that it’s too far out into the future to know what will be happening next.
Best of luck, I’m sure you’ll have a fabulous time here on Maui!
Aloha, Glenn
-
February 14th, 2023 at 7:46 pm
Cathy Says:Today’s poem touched me deeply. Thank you so much.
~~~ Hi Cathy, glad to hear that the Billy Collins poem had you feeling things on this Valentine’s Day 2023! Thank you for your lovely comment.
Aloha, Glenn
-
February 14th, 2023 at 11:50 am
Kate Says:Oh no! We are traveling to Kauai and will be staying in Poipu with three very young children from today until the 24th. Will it be dumping rain the entire time? We’re so disappointed. What is the probability that there will be some breaks?
~~~ Hi Kate, indeed, I understand your feelings about the weather here in the islands. We’re definitely experiencing winter weather, no doubt about it. During your long stay you will definitely have some sunny periods, in between the showers that will be falling at times. I’d say that despite the weather, you’ll have a great time on Kauai, it’s a wonderful place to be!
I’d recommend that you use this forecast page to help plan your daily activities, and it gets updated several times each day:
https://www.hawaiiweathertoday.com/kauai.php
Just click on the map to see the forecast for that particular area.
Happy Valentine’s Day, and best of luck!
Glenn
-
February 13th, 2023 at 10:17 pm
Geoff Says:Hi Glenn,
We are supposed to come to Kona from Feb 15th – 20th…from what you can see, does this system coming in look like significant rain? Many Thanks!!~~~ Hello Geoff, good to hear from with your valid weather question about rain on the Kona side of the Big Island…during the time of your vacation. Yes, there will be some rain at times, like pretty much everywhere in the Hawaiian Islands.
I suggest you use this forecast page, which updates 4-times a day, so you can refresh the page morning, noon, late afternoon and night…to get the latest outlook:
https://www.hawaiiweathertoday.com/big-island.php?zone=HIZ023
Best of luck, and BTW, it won’t be raining constantly by any means!
Aloha, Glenn
-
February 11th, 2023 at 11:55 am
Dan Thomas Says:Aloha Glenn,
which forecast zone should I use for hiking the Kahakapao and loop trail? Judging from the map, I believe it would be windward Haleakala.Mahalo
Dan
~~~ Hi Dan, that’s correct, you would use the windward Haleakala forecast map. I’m not sure if you are going today, although if so…be sure to bring rain gear!
Aloha, Glenn
-
February 8th, 2023 at 7:31 am
Jessica Says:Hi Glen! I have so appreciated your site over the years. Could you tell me, is South Maui
/Upcountry the right place to look for Kihei weather?Mahalo!
~~~ Hi Jessica, so glad you continue to appreciate my website after so many years…thanks very much for letting me know!
As for your question, yes, the Kihei and upcountry area forecast is the one to use to get the Kihei forecast.
Aloha, Glenn
Aloha, Glenn
-
February 4th, 2023 at 12:35 am
Jeremy Burns Says:Aloha Glen,
Thanks very much for your continued local forecasts! It is very helpful as part of managing Haena State Park access to keep parkgoers and staff safe and updated.
Mahalo mahalo mahalo
Jeremy~~~ Hi Jeremy, good to hear from you up there on Kauai! Great to know that you are using my website to inform others, thank you very much for that…and for letting me know!
Aloha, Glenn
-
February 3rd, 2023 at 7:27 pm
Mike Says:Glenn, I never saw the west side rain total from the recent wet weather. Did Kaanapali break 3 inches? Mahalo Mike
~~~ Hi Mike, I didn’t either, not sure how much they got, although I’d hazard a guess it was a fair amount more than 3 inches. Here at my place in upper Kula, we received over 20″ over the course of that many day rainstorm!
Aloha, Glenn
-
January 30th, 2023 at 1:12 pm
Elsa Says:Hi Glenn,
How does the weather look in north west maui (napilli) from feb 7-11?
Thanks,
Elsa~~~ Hi Elsa, good question, although my forecasts only go out through February 5th…so I don’t rightly know what it will be like during your vacation.
I’d recommend that when your time gets closer, that you consult with this forecast page:
https://www.hawaiiweathertoday.com/maui.php?zone=HIZ018
Best of luck!
Aloha, Glenn
-
January 29th, 2023 at 12:21 pm
Graham Says:Hi Glenn. Hope you’re keeping dry in Kula. Can you tell me please why Pukalani – usually as dry as the Sahara – is getting dumped on? I’ve measure more than 11 inches so far!
~~~ Hi Graham, I am staying dry, although after all this rain and cloudy weather, it’s unusually damp!
As for the rainfall in Pukalani, you aren’t the only place that’s been getting so much rainfall, as I’m sure you know. Maui County has been taking the brunt of this copious precipitation, as we’ve had a surface and upper level trough of low pressure parked over us for many days in a row! Look for a gradual improvement as we get into the upcoming new work week.
Aloha, Glenn
-
January 27th, 2023 at 11:29 pm
Christine Says:Hi Glen!
We are here in Wailea and wondering… when will this rain stop? I want to spend some time basking in the sun on the beautiful beaches!
~~~ Hi Christine, I totally understand your desire to have this wet spell end…I’m sure many others feel the same way.
Looking at the latest forecast, it appears that you might have to wait until Monday or even Tuesday, and then, through the rest of next week…sunny weather will return during the days!
I hope you can wait it out!
Aloha, Glenn
-
January 26th, 2023 at 10:35 pm
Nancy Says:Dear Glenn,
Do you really live in a weather tower?
🙂
Nancy~~~ Hi Sebastopol Nancy, in fact I do live in a sort of weather tower. It’s only 60 feet above the ground, although I’d say that qualifies as a tower don’t you? I might however be over estimating the height, as I’m not that good at estimating such things I’m afraid.
Good to hear from you by the way, I hope you and your husband are doing well as we launch into this new year.
Aloha, Glenn
-
January 23rd, 2023 at 12:42 pm
Sasha A Says:Hey there! We will be visiting Maui from Jan 25th to the 30th and were going to be visiting different areas on the island, hoping to be in Hana from the 26th to the 27th, given the weather would it still be safe to drive out there? Will we still have sunny breaks through out our time on the island? Getting a little nervous with the forecast for our time there haha thanks Glen!
~~~ Hi Sasha, great news, you’ll be visiting our wonderful island of Maui soon! I don’t think you need to be overly nervous, however there will be some showers falling at times during your vacation. It is after all the heart of winter, even here in the tropics. You won’t have constant rainy weather by any means, there will be periods of warm sunny weather without showers too. As for keeping track of the daily weather conditions, including your trip out to Hana, I suggest that you use this weather forecast page, and simply click on the areas you are interested in on a daily basis…depending upon where you want to go:
https://www.hawaiiweathertoday.com/maui.php
Have a wonderful time, I know you will!
Aloha, Glenn
-
January 22nd, 2023 at 10:02 pm
Nina Says:Hi Glenn! Thanks for this great website! We will be on Kaanapali Beach from 01/24-02/04. It looks like it will be colder and rainier during that time. Should we plan on packing warmer clothes as opposed to beach stuff? Thanks!
~~~ Hi Nina, good to hear that you’ll be staying in Kaanapali soon! As for your question about it being colder and rainy during your stay, that’s incorrect.
I recommend you use this webpage for the latest weather forecast for Kaanapali:
https://www.hawaiiweathertoday.com/maui.php?zone=HIZ018
I know you will have a great vacation!
Aloha, Glenn
-
January 21st, 2023 at 4:34 pm
Courtney Says:Hi! We will be coming to Maui 1/28 – 2/4 for my great aunt’s 90th birthday. We are getting super nervous looking at the weather forecast as it is showing rain/thunderstorms almost every day for Lahaina. Will we likely be seeing a lot of rain during this time?
Thanks!!
~~~ Hello Courtney, good to hear that you’ll be visiting Maui later this month into the early part of February! My forecasts only go out through the 27th of this month. However, I don’t know where you are getting these forecasts for further out in time, however, I can guarantee you that those forecasts of a lot of rain are inaccurate.
By the way, typically, Lahaina is one of the warmest and driest places in the state. You’ll be fine, and I suggest that you use this webpage for seeing the more accurate forecasts for the time period coming up later this month:
https://www.hawaiiweathertoday.com/maui.php?zone=HIZ018
Again, you are going to have a very nice vacation!
Aloha, Glenn
-
January 21st, 2023 at 11:39 am
Ashley Says:Hi there!
My family will be vacationing on Kauai 1/25-1/31. Are we looking at cooler and rain the entire trip?
Thank you!
Ashley~~~ Hi Ashley, good to hear that you’ll be visiting the beautiful island of Kauai! The answer to your question is no, it definitely won’t be raining during your entire trip. We are however in the heart of our winter season, so you could expect the weather to be showery at times (but not all the time by any means), and cooler than during the summer months…although still quite warm in general.
You’ll be fine, I’m sure you will go away with a warm afterglow from your visit to paradise!
Aloha, Glenn
-
January 15th, 2023 at 12:08 pm
Andrew Says:Hello, we will be vacationing in Lahaina from January 20-29th. As mentioned in a previous comment we also noticed that longer range forecasts are showing it to be cooler and wetter during that period. Do you have any insight what the weather may be like beyond next weekend? Thanks!
~~~ Hello Andrew, good to hear that you’ll be vacationing here in Lahaina, Maui soon! The first three days of your trip should be very nice! Unfortunately, it’s too soon to know what the weather will be doing after next weekend.
I’d highly recommend that you consult with this weather forecasting page: https://www.hawaiiweathertoday.com/maui.php?zone=HIZ018
as we move through this week. Fortunately, you have picked Lahaina as a destination, which is one of the warmest and driest areas in the state!
Best of luck!
Aloha, Glenn
-
January 15th, 2023 at 10:11 am
Brandis Sarich Says:I am excited to learn about underground gravity energy storage! Thank you for sharing this.
~~~ Hi Brandis, you are very welcome, indeed, this sounds like an exciting new technology!
Aloha, Glenn
-
January 14th, 2023 at 2:12 pm
Carrie Says:Aloha, Glenn! My family is coming to Kaanapali on January 29-February 5. Would you be able to give me any insight to what the weather may look like? I’m seeing forecasts through the 28th that are showing a lot of rain and thunderstorms and I’m getting nervous.
~~~ Hi Carrie, it’s nice to hear that your family will be vacationing on the upper West side of Maui…great area! As for some sort of reasonable forecast during your future dates, I don’t have a clue. It’s way too far in advance, and whoever might try and give you a forecast, would just be guessing.
I’d recommend using this page
https://www.hawaiiweathertoday.com/maui.php?zone=HIZ018to check on the latest forecast…as it gets closer to your arrival time. I’ll hazard a guess that you’ll love being here…no matter what the weather may be like then.
Aloha, Glenn
-
January 13th, 2023 at 2:45 pm
Ann Freitas Says:Are you familiar with this weather term: bombogenesis? Keep warm. Wish I could say keep dry.
~~~ Hi Ann, yes, Bombogenesis, occurs when a mid-latitude cyclone rapidly intensifies, or strengthens…over a 24 hour period.
Bombogenesis can happen when a cold air mass collides with a warm air mass, such as air over relatively warm ocean waters. It is popularly referred to as a bomb cyclone.
We don’t have such things here in Hawaii, as we’re south of the mid-latitudes, and there are no such sharp contrasts in air temperature, which triggers these bomb weather features.
Aloha, Glenn
-
January 6th, 2023 at 1:22 pm
Johnny Matthews Says:Aloha, Glen. You’re the first thing I look at every morning for the past 10 years! since Kilauea is erupting again please put the VOG tracker back up.
Mahalo~~~ Hi Johnny, great to hear that you are reading my weather stuff each day!
I have put the Vog tracker back up, thanks for the reminder.
Aloha, Glenn
-
January 5th, 2023 at 1:30 am
Larry Jones Says:What do you foresee for the coming hurricane season? Will it be active? I‘be been following your excellent site for many years
~~~ Hi Larry, yours is a good question, although I’m afraid that I don’t have a good answer, at least not this early in the year. As we get into the spring, say March or April, that information would begin to come into focus. I’ll share whatever I find in terms of the upcoming tropical cyclone season here in the central Pacific…as soon as I see it.
Aloha, Glenn
-
January 4th, 2023 at 1:02 pm
David Says:Glen Howzit, We are missing a few links this morning. Closer View/To Windy and the 2 others on the same line. Happy New Year.
~~~ Hi David, I accidentally deleted those links, they’re back where they were…thanks for pointing that out!
Aloha, Glenn
-
January 4th, 2023 at 11:46 am
Lance Says:Aloha Glenn, where’s the near real time wind feature? Love that as well your entire site is a must see for me everyday. Thanks for what you do, Lance
~~~ Hi Lance, I accidentally deleted those links, they’re back where they were…thanks for pointing that out!
Aloha, Glenn
-
January 3rd, 2023 at 3:34 pm
Douglas MacDougal Says:Hi Glenn
The series of Low pressure systems up North near Alaska, displayed on the Blue Orb as clouds, look like a perfect wave at Pipeline ….the beach being represented by the Hawaiian islands!
As always thank you fur your most informative site.~~~ Hi Doug, I see that breaking wave (deep low pressure system) towards the Gulf of Alaska from here in Hawaii…along with its perfectly shaped comma shaped cold front, the tail-end of which will bring us some fairly minor moisture, and some cool north breezes ahead of and in its wake. Cool stuff this weather!
Aloha, Glenn
p.s. thanks for your positive comment about my website!
-
January 3rd, 2023 at 1:53 am
Bill Ferguson Says:The rain gauge on Puu Kukui
The rain gauge hasn’t worked for couple of months. I looked it up on the Internet and can’t find any information on why it’s not working or when it will be repaired. Can you find out what’s going on with it? Happy new year.~~~ Hi Bill, I’ve noticed that that rain gauge is out as well. I just called the NWS office in Honolulu and asked about it. The person who answered the phone said she would have someone call me back with whatever information they can come up with. I’ll write you at your email address and let you know what I find out. I’m not sure when that will be…probably within a day or two.
Aloha, Glenn
-
December 28th, 2022 at 11:39 am
Roberto Says:Aloha Stargazers ( and Glenn) Venus and Mercury pair up in the evening sky for an interesting sunset/ twilight conjunction ! Look low in the west, Venus is bright and easy to spot.
Venus and Mercury have been getting closer in our sky for a few weeks. And today, December 28, 2022, they’re at their closest. Their conjunction happens at 9 UTC on December 29, 2022. That’s when Mercury will sweep 1.4 degrees north of Venus on our sky’s dome. And that’s about the width of three full moons. Look for them is after sunset. You’ll find them low in the west, near the sunset point.
The pair is in twilight. If you can’t see Mercury, aim binoculars at Venus to view Mercury and Venus in a single binocular field. Also, you can spot the ringed planet, Saturn, nearby, a hand above following the ecliptic. Keep looking UP ! Jupiter is at the top of the sky, followed by brilliant red/orange Mars rising in the east.
~~~ Hi Roberto, thanks for passing along this interesting information!
Aloha, Glenn
-
December 26th, 2022 at 9:25 am
Gary Elster Says:Glenn
the Wind profile link hasn’t worked in some time.
aloha
Gary
~~~ Hi Gary, hmmm, I just checked that link on both my laptop and my iPhone…and they seem to be working fine. Not sure what to say other than that?Aloha, Glenn
-
December 21st, 2022 at 9:52 am
Yvette Says:Thank you for having this informative site still! I log in every year before our annual trip – which starts tomorrow for 2 weeks! Looks like we dodged the impressive storm by a few days. How is the brown water and is it dissipating or sticking around for a bit?
~~~ Hi Yvette, you’re very welcome, I appreciate your positive comment about my website. You did miss that big Kona storm the last several days. As for the silt in the ocean, carried there by the heavy rains, it was certainly evident yesterday, and actually the day before too. However, I just walked out on my deck here in upper Kula, and looked down towards the ocean in Kihei, and I don’t see it any longer. It might still be around in other areas, although I think you lucked out in that regard too.
Happy Holidays…
Aloha, Glenn
-
December 19th, 2022 at 1:04 am
Lucia Says:Thank you for this! I’m in upper Kula too, and this was my first Kona storm since moving from Makawao. The gulch next to me was raging most of the afternoon, and even now, a few hours after the rain has stopped here. It was intense! I’ll check back in the morning for more updates, thanks!
~~~ Hi Lucia, thanks for your comments. Indeed, this is quite a wild ride we’re on, as this Kona storm rages over the state, and certainly here in upper Kula at times too. As I’m sure you did, I got woken up around 330am this morning to lots of lightning and loud thunder, as a line of big thunderstorms rolled through! Hunker in Lucia, and experience these unusual weather conditions with me.
Happy Holiday’s
Aloha, Glenn
-
December 18th, 2022 at 11:16 pm
Nancy Says:Aloha Glenn,
Envious of your extreme weather conditions there. I hope Your hale stays safe and your power stays on so you can enjoy it. I heard About the Hawaiian Airlines flight. Take care, and enjoy your weather!
Nancy~~~ Hi Nancy, good to hear from you there in Sebastopol. Yes, my flight back to Maui recently was quite turbulent. It’s certainly very gusty this evening here in Kula, although better than being in an airplane flying up high! Envious, I know what you mean, however this time around It’s my turn to enjoy some wild weather…I haven’t been in any of late. It will be interesting to see how this weather system treats the islands tonight and tomorrow!
Happy Holiday’s to you and your husband…
Aloha, Glenn
-
December 17th, 2022 at 10:59 pm
Howard Says:Big Blue Mahalo’s Glen, I’ve missed it so Beautiful so informative. Howard (Aina Haina)
~~~ Hi Howard you’re very welcome, glad to have found it again, and now displaying it front and center.
Happy Holidays…
Aloha, Glenn
-
December 16th, 2022 at 11:44 am
Roberto Says:Hey Glenn, thanks for finding/posting Big Blue, such an interesting and dramatic weather view, especially this time of year with the fronts sweeping down. Feel like I’m in a space ship looking at ol Mother Earth! Mahalos, Roberto
~~~ Hi Roberto, you’re welcome, I’ve always really liked this Canadian Satellite image as well.
Happy Holiday’s…
Aloha, Glenn
-
December 14th, 2022 at 3:35 pm
rege Says:Ahhhhh…..Big Blue, almost forgot how I enjoyed seeing it here years ago!
Sure wish I could click on any place on the planet and see real time status of the various “spheres” between the satellite’s lens and Earth! (or is there an app for that?)
J/K, or not? Maybe a job with the N.S.A. would be in order?
At any rate Merry Christmas to you and your loved ones!
Keep snuggled up tight in the down in that tower of yours!Peace and Grace to you!
rege~~~ Hi Rege, good to hear from you again. Indeed, I’m happy to have put up Big Blue again, not sure how it slipped away.
Yes, it’s been cold in the mornings since I’ve been back from the mainland, case in point, the morning low this morning was a very chilly 42 degrees at my place, which is approximately 3,200 feet in elevation.
Thanks for your Holiday well wishes, and lets turn that right around…sending you and your loved ones the same sincere well wishes.
Aloha, Glenn
-
December 14th, 2022 at 11:51 am
Roberto Says:Aloha Glenn, tried to find “Big Blue” , the satellite image of the whole Pacific? Is it still in orbit? It was such a great image and interesting weather wise… and welcome back. Chilly this morning in Makawao and … pretty good meteor activity last night, even with the last quarter moon. Happy Holidays
~~~ Hi Roberto, good to hear from you again. I found that Big Blue satellite image you were referring to, by the way you can click on the image to make it larger:
https://weather.gc.ca/data/satellite/goes_gwdisk11_1070_100.jpg
I’ll check out the meteors tonight, that is if I can peel myself out from under my warm down comforter!
Happy Holiday’s to you as well!
Aloha, Glenn
-
December 2nd, 2022 at 8:42 pm
Nancy Swartz Says:Hi Glenn, Did Molokai have an earthquake at 4:33 pm today? Mahalo, Nancy
~~~ Hi Nancy, I just looked at the USGS Earthquakes page, and I didn’t see any earthquakes that occurred on Molokai December 2nd.
Aloha, Glenn
-
November 30th, 2022 at 12:16 pm
Jon Says:Hello Glen
I am a former resident of Maui (1967-1979) and I keep my connection to Hawaii through your site. It is informative and entertaining and your writing style is truly in the spirit of Hawaii. Although much has changed since my days there, the beauty and the weather are always the same.
Keep up the good work.
Aloha
Jon Robertson~~~ Hi Jon, good to hear from you, and I’m glad to know you stay in touch with the Hawaiian Island via my weather website. I greatly appreciate your positive feedback as well, in regards to what I present on a daily basis.
Yes indeed, our Hawaiian Islands remain as beautiful and serene as always, hopefully they will remain that way forever.
Happy Holiday’s Jon…
Aloha, Glenn
-
November 28th, 2022 at 11:15 am
Butch Says:Morning Glen!
Well looks like winter is completely here this year, and welcome!
So now that mauna loa is belching, will you be so kind to put up the vog link again!!
Thank you for all the great info and energy you provide us here in the middle of the puddle!
Mahalo & Aloha!
Butch~~~ Hi Butch, good to hear from you. Indeed, this autumn weather could easily be a part of winter. I have put the VOG link back on this page, and here it is here too:
http://mkwc.ifa.hawaii.edu/vmap/new/Thanks for your positive feedback about my website, I greatly appreciate it!
Happy Holiday’s…
Aloha, Glenn
-
November 27th, 2022 at 5:43 pm
rege Says:Howzit Brah,
Thank you for sharing the beautiful picture of your Mom!Now I know where you got your great hair from!
Enjoy the rest of your visit in California and I’ll see you in Maui {someday}.Yes to good will and love to all on our planet, and the rest of the universe as well!
rege
~~~ Hi Rege, and it’s been a while since I’ve heard from you as well…thanks for your positive feedback! Yes, my Mom is still beautiful even at 100 years old. I’ve always appreciated my hair, even though it has turned gray.
I’m coming to the tail-end of my extended stay in California and Oregon, and it won’t be long before I return home to Maui.
Happy Holidays my friend, to you and yours…
Aloha, Glenn
-
November 27th, 2022 at 3:05 pm
Cheryl Says:Hi Glen, your Mom looks wonderful! Thanks for sharing the photo! Much aloha to you both, Cheryl
~~~ Hi Cheryl, so good to hear from you. I agree, I’m astonished that my Mom is looking so good as well, and that her mind is holding up so well too!
I appreciate your taking the time to say hi.
Happy Holiday’s to you and yours!
Aloha, Glenn
-
November 27th, 2022 at 12:18 pm
rick Says:God Bless Your Mom!
~~~ Hi Rick, thank you so much!
Happy Holiday’s to you and yours.
Aloha, Glenn
-
November 27th, 2022 at 8:37 am
marjorie Classen Says:Aloha Glenn,
Loved the photo of your Mom. She looks spunky.
Sending wishes for a Happy Holiday to you, yours and all the folks on the planet.
Aloha,
Marjorie~~~ Hi Marjorie, very nice to hear from you again. I’m happy to hear that you enjoyed seeing my Mom, and it’s true…she is definitely spunky!
Thanks for your Happy Holiday well wishes, I appreciate that. I’d like to send the same warm wishes to your family…and to the planetary citizenship as well!
Aloha, Glenn
-
November 27th, 2022 at 12:40 am
Nancy Says:Aloha Glen, How sweet to see that picture of your mom! Hello Mrs. James! Indeed you look wonderful!
Nancy~~~ Hi Nancy, great to hear from you, and thanks for your positive feedback on my Mom…Dorothy James. I will let her know you said to say hello to her.
Hope you and your husband have a Happy Holiday Season!
Aloha, Glenn
-
November 27th, 2022 at 12:08 am
mary Says:Aloha Mrs. James!
~~~ Hi Mary, very nice to hear from you again. I will certainly tell my Mom that you said to say hi!
Please have a Happy Holiday Season!
Aloha, Glenn
-
November 25th, 2022 at 5:29 pm
Jeff King Says:Aloha La, Glenn,
What is that mega-low blob that looks like it will shoot straight northward past Kaua’i Sunday or Monday. THAT seems very unusual. Unless one recalls November 1992 and November, 1982.
~~~ Hi Jeff, haven’t heard from you in a while. That blob is an upper level low far to the northeast, with an associated low beneath it. This area of low pressure is the one that spawned yesterday’s vigorous cold front…that sweep through the state on Thanksgiving. It’s moving away towards the northeast it appears, with the cold front now just south of the Big Island.
Aloha, Glenn
-
November 25th, 2022 at 5:27 am
Mauri Says:Happy Thanksgiving, thankful & appreciative for all you do!
~~~ Hi Mauri, thank you very much!
Aloha, Glenn
-
November 24th, 2022 at 9:35 am
Jerry Says:Hi Glenn- Very long time follower….Are you sure about those Long Beach temps? Seems like you are way too cold.
~~~ Hi Jerry, I totally understand your questioning my thermometer! I sometimes do that myself. However, the truth is that I do believe those low temperature numbers. I put my temperature sensor on a low chair, out in the middle of the lawn in my Mom’s backyard.
I tested it against my friend Bob’s thermometer while I was up in Bend Oregon recently, and they showed similar numbers. While I was at my friend Linda’s up in Marin County, I put it on a fence railing, and when I was recording temperatures in the high 20’s during a cold spell…there was ice on all the nearby roofs.
While home in Kula, Maui, my thermometer reads quite close to my neighbors thermometer as well.
So, despite my readings being way colder than the thermometer output at the nearby Long Beach Airport, I trust my La Cross Technology Outdoor/Indoor thermometer.
Thanks for your inquiry…
Glenn
-
November 18th, 2022 at 1:46 pm
Myrtle Says:Hi Glenn,
Do you think we will have clear skies here in Wailuku for the Saturday night meteor shower? Wow, it’s really cold in So. Cal!
Myrtle
~~~ Hello Myrtle, here’s what it’s looking like for Wailuku:
SATURDAY
Mostly sunny. Isolated showers in the morning, then scattered showers in the afternoon. Highs around 85. Northeast winds 10 to 15 mph. Chance of rain 50 percent.SATURDAY NIGHT
Mostly clear with isolated showers. Lows 67 to 73. Northeast winds around 15 mph. Chance of rain 20 percent.SUNDAY
Mostly sunny. Breezy. Isolated showers in the morning. Highs around 84. Northeast winds 15 to 20 mph. Chance of rain 20 percent.Good luck, Aloha, Glenn
-
November 7th, 2022 at 12:37 pm
Char Says:Aloha Glen,
It’s been seriously windy on Maui! Why?~~~ Hi Char, it has been windy lately as you point out, and this coming week looks to continue that trend. Looking at weather maps lately, and through the upcoming week or so, it appears that we’ll continue to have rather robust trade wind producing high pressure systems parked far north-northeast, and even further away…in the Gulf of Alaska.
At the same time, there’s been an elongated trough of low pressure (running east to west) well south of Hawaii, in the deeper tropics, referred to as the Inter-tropical Convergence Zone (ITCZ).
It’s a meteorological fact that the air coming out of a high pressure center…moves towards areas of low pressure. Thus, our trade winds arrive from the northeast and east. In addition, the stronger the high pressure systems to our north, and the deeper the troughs of low pressure to our south…are the weather features (working in tandem) that prompt the strong trade winds you’ve referred to.
I hope this helps,
Aloha, Glenn
-
November 4th, 2022 at 11:25 am
Cheryl Says:Hi Glen, impressive lightning passed north of Oahu last night, nearly constant flashes!
~~~ Hi Cheryl, I love those rare occasions when lightning flashes just keep coming for an extended period…thanks for letting me know!
Aloha, Glenn
-
November 4th, 2022 at 9:46 am
marjorie Classen Says:Aloha Glenn,
Nov. 4 today and I do not see the “closer view” etc.
on your report. It is useful to get a visual on the
weather patterns.
Wishing you a fine visit with your family and friends.
Aloha,
Marjorie~~~ Hi Majorie, I accidentally deleted that link, I have put it back now…thanks for letting me know.
Aloha, Glenn
-
October 19th, 2022 at 2:41 am
AmandaOnMaui Says:Whew, the north shore has been rough with this change in wind flow. The reprieve over the weekend was lovely, but we’re back to sticky hot nights even at 11pm.
~~~ Hi Amanda, good to hear from you again. Fortunately, the gusty north winds in the wake of an approaching cold front will have you feeling more comfortable soon!
Aloha, Glenn
-
October 5th, 2022 at 5:42 pm
rege Says:Aloha Bro!
Looks like i will miss you again, after a three year covid lockdown. Was planning to drop in on your pickle ball session! We are very happy you are spending time with your Mom and sibs in California. Make it a time to remember. If you and I make it to one hundred years we will surely meet some day. Tell your Mom we love her and thank her for bearing such a fine son! As always thanks for the great “Hawaii Weather Today”!
Bring us some sunshine and blue skies in the next weeks if you can.Rege
~~~ Hi Rege, good to hear from you again! It would have been fun to finally meet you, as you sauntered onto the Pickleball courts on Maui. However, as you noted, I’m here with my Mom in Long Beach, CA, which I do each autumn. I trust you will have a wonderful time in paradise, and absolutely, I will tell my Mom your very positive acknowledgement about me…thank you very much my friend! And oh yes, I’m putting in a special weather request for sunny weather.
Aloha, Glenn
-
October 4th, 2022 at 11:44 am
Gary Elster Says:Glenn:
Puu Kukui has not been showing up lately in your summation
of precip. it always gets more rain than we do and we have received over 1/2 inch in last couple of days . any explanation for its not reporting?
aloha
Gary~~~ Hi Gary, good question. In the precipitation section on my Narrative Page, I put the places around the state that receive the greatest rainfall totals for each island. As far as Maui County goes, it’s often the West Wailuaiki rain gauge, which is out along the Hana Hwy…on the way to Hana town. Actually, it’s often Puu Kukui too, which is the gauge atop the West Maui Mountains. So, which ever rain gauge has the most rainfall during the last 24 hours…is the one I show. I update this section many times during the day by the way. If you want to check out where I get the information, you can find the NWS page here: https://forecast.weather.gov/product.php?issuedby=HFO&product=RRA&site=hfo
Aloha, Glenn
-
October 3rd, 2022 at 11:12 pm
AmandaOnMaui Says:It was so nice to see rain over the Central Valley today. I hope it gets some more! Though, I hope the upcountry reservoirs also get their fill.
~~~ Hi Amanda, yes, Maui got some good early autumn rains the last few days! It looks like we’ll be getting more of this precipitation over the next week or so…off and on at least.
Aloha, Glenn
-
September 27th, 2022 at 7:48 pm
Steven Says:Checking in with you Glenn,
From the frying pan into the fire! We’ve got some heat here in Del Mar as well, but planning to visit our 97 year old Mom in Myrtle Beach, SC with arrival Thursday 10pm, then visiting for a few days and leaving Tuesday morning. That’s the part we need help from you on… deciding whether to put it off a week (that would not be easy)?
~~~ Hi Steven, oh yeah, Southern California is hot, although fortunately things should be starting to cool down…although gradually.
As for flying to Myrtle Beach, SC…it looks like off and on rain Thursday through Saturday, although with relatively cool weather for a change. I’d say go ahead and go, and just deal with whatever weather you find…hopefully Ian will have slid by without a major blow there. I say this considering your comment that it wouldn’t be easy to change your plans at this late date.
About all I can say is good luck and stay save…and dry!
Aloha, Glenn
-
September 18th, 2022 at 12:41 pm
Marilyn Wright Says:I have a friend doing research on marine mammals off of Nome Alaska who reports the research vessel is steaming North to get out of the way of a disturbance in that area.
Can you report on the system up there.
Thanks~~~ Hi Marilyn, here’s a story about this storm:
https://www.nbcnews.com/news/us-news/alaska-prepares-powerful-storm-said-strongest-decade-rcna48167
Aloha, Glenn
-
September 11th, 2022 at 9:59 am
Steven Says:Hi Glenn,
Currently I’m in Del Mar, where, after a very strange hothouse type period of 3 weeks (80 degree mornings with 80 percent humidity!), some tropical moisture from Hurricane Kay, crept up the Baja Peninsula giving us (drum roll)…a few drops of rain. The rain it unleashed was all in the mountains, so us urban types were underwhelmed. Downtown San Diego got a .62 inch of rain washing of debris into the ocean, however) What movie did you see?
~~~ Hi Steven, good to hear from you. I’ve been keeping close tabs on Kay and the southern California area, as I’ll be flying to Long Beach this coming Thursday. It’s been rather remarkable, the high temperatures and the high humidity…and those warm low temperatures too. It’s unusual for the southern CA to get rain this time of year, although many areas got some, and some areas got too much!
I haven’t been to see a movie at a theater in several years, due to the Pandemic among other things. I do however watch films on Netflix and Amazon Prime of course.
Be well, Aloha, Glenn
-
September 10th, 2022 at 6:10 pm
Mike Says:Aloha Glenn, please keep us posted about any tsunami related news from the big quake in New Guinea! Yikes!
~~~ Hi Mike, there is no negative tsunami threat for the islands…thank goodness!
Aloha, Glenn
-
September 9th, 2022 at 6:35 pm
Amanda Says:Hi Glenn! I noticed that a couple of the satellite view links are no longer working. Thought you’d want to know so you can find the appropriate ones.
~~~ Hi Amanda, thank you for pointing this out…I replaced the one that I saw, the top one, with the current version.
Aloha, Glenn
-
September 2nd, 2022 at 5:04 pm
michael davenport Says:Hi Glenn, I’m not sure about CC for ocean fish, I do know that overfishing is causing a decline for sure. The Chinese have fleets that go in and suck up all the fish in certain areas. I know the just got caught down near the Galapagos islands. We need to eat fish not bugs. And not farmed fish.
~~~ Hi Michael, good to hear from you. I’m troubled by the overfishing issue myself! I’m also concerned about how clean, or should I say dirty the ocean is these days. We dump so much pollution in our oceans, that to tell you the truth, I’ve stopped eating fish for the most part…which I’ve enjoyed very much in the past. On occasion I’ll buy some fresh salmon that has been wild caught in Alaskan waters, that’s about all I’ll eat these days. I love Ahi Tuna, both raw and cooked, although haven’t had any of that either.
Aloha, Glenn
-
August 28th, 2022 at 10:44 pm
Bill Ferguson Says:The temperature at the Kahului airport the high hourly temperature was 91 with the maximum temperature 93. I looked at every personal weather station on Maui and the highest temperature I could find was 91. If you really want to tell people what the temperature really is you need to do the hourly temperature and forget about the maximum temperature because for the.
???? time it’s been questionable. I’ve noticed that the middle of the valley between Haleakala and the west maui mountains has been slightly hotter in the last few years. I think it’s probably because of the end of the sugarcane. When the million trees that Mahi Pono has planted reach maturity I think this will make an incredible difference in the temperatures in the valley. My personal weather station in Maui Lani 2 miles from the airport was 88.~~~ Hi Bill, I appreciate your comment about the high temperatures at the AP in Kahului. I’ve had other folks write me and suggest that the AP temperature isn’t accurate. So, I once again called the NWS office in Honolulu, and asked them about the accuracy of this thermometer. They have checked the instrument, and re-checked it again. They swear by the accuracy of the thermometer, and so I’m going to continue using it, and pointing out the high temperature, and the record high temperatures for the date on a daily basis…as long as it reaches 90 degrees and above.
Best Regards, Glenn
-
August 14th, 2022 at 10:48 am
Tomas Says:It would appear that Kahului is experiencing some kind of localized climate change, consistently breaking records for temperature highs when other locations are not. Why has it become the state’s hot spot? Or did NWS just move their thermometer?
~~~ Hi Tomas, that is a good question. As for a localized climate change for the AP in Kahului, I doubt that’s it, although I think you already know that. I’ve talked to the NWS a couple of times about what’s up with the higher high’s than any other major AP in the state. Apparently there’s been a couple of thermometer moves over the last year or two, and perhaps that has something to do with this issue. It’s a tough call, and honestly I don’t rightly know exactly why Kahului is so darn hot, and keeps tying or breaking records this month.
Aloha, Glenn
-
August 6th, 2022 at 12:30 am
David Hume Says:Hi Glenn, several times you refer to a potential system ‘well South West of the Hawaiian Islands’……? Shouldn’t it be South East??. Also, having some wonderful dry days here, finally able to repaint my deck. Aloha David.
~~~ Hi David, indeed, I just caught that mistake myself this morning! Yes, that area is in fact southeast. My first error in 20 years…hahaha! 🙂
Dry is the word down your way, glad you finally got to take care of your deck there in Kona!
Take care of yourself my long term friend!
Aloha, Glenn
-
August 3rd, 2022 at 9:19 pm
Alan Says:Glenn—Wailea got about 3” of rain in a downpour Wednesday between 2 and 3pm.
~~~ Hi Alan, thanks for your report! From here at my place I could see the dark gray towering cumulus down your way, and was hoping that they were depositing some much needed water to the leeward side of east Maui. I wish you could send some of that precipitation up here to Kula!
Aloha, Glenn
-
August 3rd, 2022 at 1:50 pm
Meghan Says:Hi! Is there any concern with this new
“area of low pressure could form over the far western portion of the eastern Pacific basin later this week”
as far as it directly impacting the Hawaii islands in the next 2 weeks? Thank you!~~~ Hi Meghan, good question. Actually, looking at the latest forecast models, there are two tropical cyclones that will likely spin up in the eastern Pacific, both of which will head west. However, it’s still too early to know how far they will make it towards our central Pacific, or even towards the Hawaiian Islands. My best wild guess would be that neither one will end up being a problem for Hawaii. This is due to the cooler water and upper air shearing winds out to the east of Hawaii. Time will tell of course, and I will be reporting on all tropical activity in both the east and central Pacific going forward. One final note: A remnant trough associated with former Tropical Cyclone Georgette, will drift westward across the islands enhancing shower activity early next week…Long range guidance continues to show a tropical low passing south of the Big Island around the middle of next week. If the low develops and passes south of the islands, trade winds could further strengthen as the surface pressure gradient increases. Neither the trough or the low should have any major impact on the islands.
Aloha, Glenn
-
August 2nd, 2022 at 8:03 am
Lynn Says:Hi Glenn,
We are staying at The Grand Wailea in Maui. The weather channel is showing rain Wednesday through Saturday. I’ve been told not to go by those websites. Please tell me the forecast will be different than what I’m seeing !!
Thanks!!~~~ Hi Lynn, good question. I anticipate that Wailea might have some rain over the next day or two, although as for rain everyday between Wednesday and Saturday…out of the question. You will have plenty of daytime sunshine, no doubt. I recommend using this weather page for your latest Wailea forecast:
https://www.hawaiiweathertoday.com/maui.php?zone=HIZ049Best of luck!
Aloha, Glenn
-
July 31st, 2022 at 11:14 pm
Keith Says:Aloha Glenn…I’m wondering…these high temps and drought we’ve been experience across the island…how unusual is it? Any data on that?
~~~ Hi Keith, I’d say the high temperatures aren’t unusual for summer. However, it’s drier than normal, although I don’t have any data to confirm that. Here at my place in upper Kula, our typically green grass has turned crispy brown. I’ve seen this happen before, although it’s not the norm by any means. We keep hoping for some afternoon rainfall, or some other source of showery weather to arrive! The windward sides have had better luck with showers, as the trade winds carry moisture to them quite often.
Aloha, Glenn
-
July 21st, 2022 at 7:49 pm
Graham Says:Hi Glenn and thanks for keeping us informed on the weather. Question for you please – we were told to expect a quiet Pacific hurricane season but an active Atlantic one. So far we’ve seen the reverse with six named storms so far in the Pacific and just two I think in the Atlantic. Do you have any thoughts on this please?
~~~ Hi Graham, good to hear from you. It’s very true, the eastern Pacific has had the bulk of the tropical cyclone activity so far this 2022 hurricane season. It’s also true the major models suggested that the Atlantic would see the majority of the tropical cyclones this season, through the end of November. This may be the cue here, it’s still very early on in the long June-November hurricane season. We have a long ways to go, so things could shift around over the next couple of months and beyond. I suppose the old saying “time will tell” whether the models were right on, or got their signals crossed…may be the ultimate answer to your good question. I’ll be keeping tabs on all the activity across the globe here, on this website. Thanks for using my website, and you are very welcome…I enjoy keeping you abreast of everything weather!
Aloha, Glenn
-
July 20th, 2022 at 8:14 pm
Marisa Says:Hi Glenn!
We are staying at Andaz Maui with 2 kids who are super excited to snorkel next week Monday Tuesday and Wednesday.I see there is mention of a small south swell… does that mean snorkeling in Wailea may be impacted for the worse? First timers here, thanks for any info!
~~~ Hi Marisa, good to hear from you. Surf conditions, and consequently water visibility can change between now and the first 3-days of next week of course. However, as you point out, there is expected to be a small rise in surf then, which if this proves to be correct, the visibility of the water for snorkeling could turn less favorable.
If that is the case, there are other areas that you could drive to for better conditions. One place that I can think of would be Honolua Bay on the upper west side of Maui.
The surf isn’t expected to become large by any means, so the snorkeling could be ok in Wailea. I would check it out next Monday, and see how it looks first, and go from there. Good luck!
Aloha, Glenn
-
July 18th, 2022 at 11:41 am
Christina Says:Glenn,
On a work trip to Honolulu this week, first thing I did this morning was check your weather page. Sending you some aloha and belated birthday wishes.
Take care,
Christina~~~ Hi Christina, thanks for your comment! I remember you from the past somewhere along the line, was it at the Pacific Disaster Center way back when? At any rate, it seems as if you were involved with weather, was it the National Weather Service? Thanks for your Aloha and your belated Happy Birthday wishes too! Be well my friend…
Aloha, Glenn
-
July 15th, 2022 at 1:18 am
Helen Says:Happy Birthday Glenn !
~~~ Hi Helen, thanks for your Happy Birthday wishes!
Aloha, Glenn
-
July 14th, 2022 at 1:58 pm
Dwight Weiding Says:Happy Birthday Glenn!
Many thanks to you for your continuing service to the Maui and Hawaii community with vital weather information. I love the way you package the information for ease of consumption with everything you need on your website. Please enjoy your day and have fun in this upcoming year!
Aloha,
Dwight~~~ Hi Dwight, very nice of you to wish me a Happy Birthday! I love keeping you, and all of my valued readers, abreast of all the latest information available to me. I’m glad too that you approve of the packaging I use to share with you…it’s certainly changed many, many times over the last 26 years that I’ve been doing this website. I’m very much enjoying this birthday!
Aloha, Glenn
-
July 13th, 2022 at 10:31 am
mary Says:Glenn
I seem to remember that your birthday is in the middle of July. I may be early on-time or late but I wish you a Happy Birthday!~~~ Thanks for thinking of me Mary, actually July 14th is my birthday!
Aloha, Glenn
-
July 6th, 2022 at 1:04 pm
Allan Says:Thanks for the info on Bonnie, very interesting.
~~~ Hi Allan, you’re very welcome, happy to know you found it interesting!
Aloha, Glenn
-
July 6th, 2022 at 10:37 am
Jill Says:Loved the overview of Bonnie…she is sure persistent!
~~~ Hi Jill, thank you very much, I was wondering if anyone would read that. Indeed, she is one persistent tropical cyclone…although will be winding down steadily from here on out.
Aloha, Glenn
-
June 28th, 2022 at 5:24 pm
Erica Rainhart Says:Aloha Mahalo Glen
Date stamp on satellite views June 25
New Moon June 28 here we are!
Appreciate your work very much,
Erica~~~ Hi Erica, thanks for your comments! On the narrative page, I see that all the satellite images actually have the appropriate date stamp. When I go to the satellite page, which I’m sorry to say is unworthy of being on the website anymore, things go south I’m afraid. I will be taking it down asap.
Ah yes, the new moon, and time for new beginnings as I understand it. Thanks for letting us know that here we are!
Thanks too for letting me know you appreciate this website, that helps to make my day…thank you!
Aloha, Glenn
-
June 22nd, 2022 at 12:59 am
Catherine Says:Aloha Glenn,
Just wanted to let you know the vog graphic isn’t working.
Thanks for all the weather updates you provide us!
Catherine~~~ Hi Catherine, thanks for letting me know, although unfortunately the University of Hawaii is in control of this vog website. Hopefully, it will be back online with its animated graphic soon. Thanks too for your positive remark about my website, I appreciate that.
p.s. I just checked the link now, and it’s back to working!
Aloha, Glenn
-
June 13th, 2022 at 8:05 am
Jerry Says:Hi Glenn- I’m afraid you’ll have to get used to the crowds too!!
~~~ Hi Jerry, fortunately I don’t often go down country, pretty much always upcountry while I’m on Maui…which isn’t crowded in my neck of the woods.
Aloha, Glenn
-
June 8th, 2022 at 6:16 pm
Cheryl Says:Hi Glenn, happy 100th birthday to your Mom! 🎂🎉🌺
~~~ Hi Cheryl, thanks so much, I will let her know you mentioned her…very kind of you!
Aloha, Glenn
-
June 8th, 2022 at 3:19 pm
Jeremy Says:Aloha Glenn. Please note the “Haleakala Crater” camera is now active. You should be able to refresh your link by going to Haleakala National Park’s website, or: https://www.nps.gov/hale/learn/photosmultimedia/webcams.htm. Thanks for your work and the service that you provide the community.
~~~ Hi Jeremy, I appreciate your letting me know, I will change the wording in relation to the Haleakala Crater webcam right now.
Aloha, Glenn
-
June 8th, 2022 at 1:18 am
Helen Says:Aloha Glenn,
Happiest of birthdays to your mom!!
100 ! That is amazing! 🎊🎉~~~ Hi Helen, it’s so true, I’ll pass your BD wishes on to my Mom…thanks!
Aloha, Glenn
-
June 7th, 2022 at 7:34 pm
teresa davila Says:OMG, Happy 100th Birthday to your MoM, Glenn!
What a milestone…and gosh, those are some good genes to have.
Safe travels to you on your return to your/our island home.
Looking forward to having you back to help explain these upcountry showers we see right above us.~~~ Hi Teresa, good to hear from you. I know, it’s almost unbelievable that my Mom has reached the 100 year old mark!
Thanks for your safe travels wishes as I fly back to Maui on Friday. As I’m sure you know, upcountry leeward Maui can use all the rain we can get this time of year…as we head into the summer dry spell.
Aloha, Glenn
-
June 7th, 2022 at 2:42 pm
David Hume Says:Aloha Glenn and Happy Birthday Mom. As encouragement I have a friend in England that will be turning one hundred and thirteen in two months, isn’t life grand! Wet wet wet here again in Holualoa, the wettest three years I have experienced in over forty here.
~~~ Hi David, good to hear from you again there on Kona coast. Thanks for your Birthday wishes to my Mom…I’ll pass them along. Wow, 113 years old, that absolutely amazing! Lots of rain over your way, and I hear that upcountry leeward Maui has been wet too…which is an area that really needs the water.
I hope you’re doing well and fine my friend!
Aloha, Glenn
-
June 6th, 2022 at 8:29 pm
Judy Eagle Says:Good genes! Here’s to l00 for you all. Pickleball players (and their folks) are the best.
((**))
~~~ Hi Judy, my Mom sure does have good genes, and perhaps they have passed down to me…I hope so, so that I can play pickleball for many more years!
Aloha, Glenn
-
June 6th, 2022 at 2:59 pm
Rob Webb Says:Glenn It has rained in Keokea every day for like 6 weeks. What is going on?
~~~ Hi Robb, unbelievable, that’s so unusual…considering that May and June are two of the driest months of the year! What’s going on? I hate to say it…although I don’t really know! Hope it keeps up, as I get back to Maui this coming Friday.
Aloha, Glenn
-
May 28th, 2022 at 11:33 pm
Pamela Kantarova Says:Hi Glenn,
It’s been raining here, up in Kula, almost all day!!
So far .25 “ at 7:30 pm on Saturday – nice and light.
Aloha to you and Mom,
Pamela & Richard
PS
Richard’s sister turns 80 on 6/7!~~~ Hi Pamela and Richard, good to hear from you there in Kula! That’s such good news about the all day light rain upcountry, as Varsha has been telling me how dry it’s been lately. 80 is getting right up there, although falls way short of my Mom’s 100…although it’s interesting that they both share the same Birth date. I’ll be needing to order eggs and Kefir from you, as I get back to Maui June 10th. Looking forward to the short drive over to your place…hopefully on the morning of June 11th.
Be well you two!
Aloha, Glenn
-
May 28th, 2022 at 3:21 pm
sano henderson Says:Aloha, Glenn,
I am currently on the air at KWMR in Point Reyes Station with my bi-monthly show Hawaii Calling. I use your weather comments on your excellent web-site each time……do love the spooky movement of a mix of high and low level clouds!!!!
Blessings to your hundred year old mum….I am also blessed to be a disc jockey at 89!!!!Keep safe,
Susanna Henderson~~~ Hi Susanna, very good to hear from you again there in Point Reyes! I just saw this comment from you, so I began listening to your station…KWMR. KWMR is real FM community radio in West Marin. 90.5 Point Reyes Station, 89.9 Bolinas, 92.3 San Geronimo Valley. I like the music you folks play! Wow, a disc jockey at almost 90 years old…impressive to say the least my friend. Thanks for your Birthday wishes to my Mom, I will tell her when I talk to her soon. I was over at her rest home this morning for 3-hours, and we always enjoy each others company. Thank you, and be well!
Aloha, Glenn
-
May 27th, 2022 at 4:53 pm
Douglas MacDougal Says:Aloha Glenn,
Happy birthday to your mother. What is the actual day? My mother would have been 103 on May 24 th.
Over these many years that I have been enjoying your website, I have hoped that she would indeed meet this extraordinary milestone.
Thanks for sharing in all things that bring happiness and thought to many people.
Mahalo
Douglas~~~ Hi Douglas, very good to hear from you again. My Mom’s 100th Birthday occurs on June 7th, she was born in 1922. I’m very happy that you have enjoyed this website over the many years you have been logging on. I began the site way back in 1996, before websites were well known. The way you put it, that this site brings happiness and good thoughts to my readers…is truly endearing! I appreciate you taking the time to write such generous praise for my ongoing work!
Aloha, Glenn
-
May 26th, 2022 at 10:04 am
marjorie Classen Says:aloha Glenn
Hauoli la hanau to Mama, awesome!
Love,
Marjorie~~~ Hi Marjorie, thanks very much for your kind Birthday wishes for my Mom…100 years old!
Aloha, Glenn
-
May 25th, 2022 at 6:11 pm
Erica Rainhart Says:Hi Glenn 👋
Yes! Thank you! Your site today, presents, photo!
Rugged painterly lit volcanic coast dynamics…
Mahalo Aloha~~~ Hi Erica, nice to hear from you, I’m very pleased that you are enjoying the photo’s which I choose to share with you today…thanks for letting me know!
Aloha, Glenn
-
May 25th, 2022 at 10:40 am
Lynne Says:Aloha Glenn,
Give your mom a big Happy 100th Birthday hug for me!!
Since I check your weather report every morning, whether I’m at my Maui winter or Evergreen CO location, I knew her big birthday was coming up.
Take care and happy traveling back to Maui.~~~ Hi Lynne, thanks so much for your BD wishes for my Mom, I’ll for sure pass them along to her. I’m delighted to know that you check my website every morning, that gives me a good feeling! What a life you have, Maui and CO, really nice places to spend your time! You take care as well as well!
Aloha, Glenn
-
May 1st, 2022 at 6:16 pm
Helen Says:Aloha Glenn,
Happy to report we are getting some rain up here in Olinda! We are very blessed.~~~ Hi Helen, great news, this late season rain has been a true blessing for many areas in the state, thanks for letting us know that Olinda is getting into the action too!
Aloha, Glenn
-
April 26th, 2022 at 1:23 pm
Richard Says:Hi Glenn,
Thanks for your faithful weather updates from wherever you are.
I’m wondering if you would include in one of your upcoming reports a preview discussion for the upcoming hurricane season in the East and Central Pacific? How will the El Nino status affect it? What other climate factors affect the prediction? etc. Mahalo, Richard in Kula
~~~ Hi Richard, first of all you’re very welcome, I greatly enjoy keeping my website up-to-date on a daily basis, and as you point out…no matter where I am.
As for the upcoming hurricane season in the eastern and central Pacific:
Here’s a very preliminary look at what might be the trend for our upcoming 2022 hurricane season.
First of all, this is the latest ENSO outlook from the Climate Prediction Center/NCEP/NWS: La Niña is favored to continue into the Northern Hemisphere summer (53% chance during June-August 2022), with a 40-50% chance of La Niña or ENSO-neutral thereafter.
Simply put, El Niño favors stronger hurricane activity in the central and eastern Pacific basins, and suppresses it in the Atlantic basin. Conversely, La Niña suppresses hurricane activity in the central and eastern Pacific basins, and enhances it in the Atlantic basin.
Thus, it appears that the Atlantic hurricane season could be more active than normal, while the eastern and central Pacific could be less active than normal.
That’s about as far as I’d like to go in this unofficial potential outlook Richard, I hope it will be sufficient to address your good question.
Aloha, Glenn
-
April 1st, 2022 at 10:07 pm
Bett Bidleman Says:How ironic, Glenn, if a small number of Africans are the only humans to survive a nuclear bomb holocaust. Our species began there. It may well be reliant on our origins for people there to once again perpetuate Homo sapiens.
But of course this data is to urge all people to find a solution to the current threat. This is no time for complacency.
~~~ Hi Bett, thanks very much for your astute comment, and I totally agree with your assessment…this is not a time for complacency!
Aloha, Glenn
-
March 23rd, 2022 at 4:49 pm
EricaRainhart Says:Aloha Glen!
Your talent dear man of the weather,
includes posting excellent vision photographic
images of our shores & sky home!
Please can you repost the sunrise lit colors –
Black Sand beach waves of yesterday’s report?(3.22.22) Malama pono Mahalo Aloha~~~ Hi Erica, thanks for your generous praise…I greatly appreciate that! As for your request to re-post the picture you saw on my website, I’m wondering if this picture is the one you’re referring to? I hope so…
Aloha, Glenn
-
March 14th, 2022 at 11:15 am
Robert Says:Aloha Glenn, I really enjoy your weather commentary. Maybe I missed a prior discussion, but what are the reasons for our especially dry conditions that past Winter and going forward?
~~~ Hi Robert, thanks for your positive comment about my weather commentaries. As for why we continue to have dry weather, the long and short of it is that we continue to have blocking high pressure systems between here and the west coast. This acts as a buffer for rainy weather, in terms of cold fronts that often penetrate into the islands from the mid-latitudes.
These blocking high’s to the northeast, have associated ridges, which extend down into the area north and northwest of Hawaii. The ridges shunt rain bearing cold fronts by to our north, or stall them before arriving here in the state. I hope this overly simplified explanation helps some. Let’s hope that we get some rain before we get into our dry summer season!
Aloha, Glenn
-
March 10th, 2022 at 9:25 pm
Helen Says:Aloha Glenn, Thanks so much for your site! We got some nice rain 2 days in a row up here! We feel very blessed. Hope your trip is going well. Send our best wishes to your mom.
~~~ Hi Helen, thanks for being in touch again, I appreciate your kind words, which essentially is all of you readers website…kind of like a long lasting family.
I’m very aware of the recent rains, which is blessing indeed!
I’ll be seeing my Mom tomorrow, and will pass along your best wishes to her…thanks very much!
Take care, Aloha, Glenn
-
March 10th, 2022 at 10:51 am
Linda Denhart Says:Aloha Glen: thanks for sharing your weather expertise. Just curious, which L.B. high school did you attend? I went to Wilson.
~~~ Hi Linda, you’re very welcome! I went to Millikan HS…a long time ago!
Aloha, Glenn
-
March 9th, 2022 at 7:47 pm
Jerry Says:Glenn! You’ve missed the 3/4 pea sized hail falling between the base of Crater Rd. and Upper Kimo at 3,200! Just a light hail scattering mixed in with large droplet rain from the small T-storm. Fun.
~~~ Hi Jerry, how could the weather “have done this to me”! Leaving me out of this unusual and rare event…it serves me right for being out of the state I guess. Hail, that’s something that one hardly ever sees, although I have seen it several times during the last 46 years that I’ve lived in the islands. Thanks for sharing the particulars of this thunderstorm, which unleashed it’s onslaught right over the area I live in Kula…glad you got to experience it at least.
Aloha, Glenn
-
February 17th, 2022 at 12:03 pm
Alan Says:So Glenn,
During the Winter and colder temperatures, do you have a wood stove or any heat in your home? Or do you just freeze and endure?~~~ Hi Alan, your question made me chuckle. No I don’t have a wood stove. I have my weather tower upstairs, and that’s where I do my work and sleep. Off this, I have my weather deck, which gives me my big bi-coastal view…including of course the beautiful West Maui Mountains.
Down below, I have my outdoor shower, small living room, small dining table, kitchen and bathroom…and I do have a gas heater, which I don’t often use, although enjoy it briefly some mornings after my work and walk are done, and I’m making my breakfast.
At any rate, getting back to your good question, upstairs I don’t have a heater, and it’s where I leave all my windows and sliding glass door open (I do have window screens of course). I get up at 415am every morning of the week, so as you can imagine it’s cold not only outside…but also inside where I work.
I have warm down comforters, and when I get up, I have a very warm Canadian down jacket, shearling wool slippers, and I drape a 300 weight Canadian fleece parka over my legs. The only part of me that gets cold is my hands. So…yes my hands are often freezing, and I endure that willingly.
You might be thinking why doesn’t he just close his windows and door, and get a space heater inside? That’s what made me chuckle, there’s just something about me that wants to be in touch with the weather as much as possible at all times…maybe I’m a little nuts in that regard!
I think of myself as a man of the weather…rather than a weatherman.
Aloha, Glenn
-
February 14th, 2022 at 12:08 pm
Bonno Says:Happy Valentines Day!!
~~~ Hi Bonno…and a Happy Valentines Day to you as well!
Aloha, Glenn
-
February 3rd, 2022 at 12:27 pm
Catherine Says:Aloha Glenn from cold Keokea!
I am wondering what is the elevation where you live? I am at 3200 ft. and it has been so cold in the mornings this week.
I also want to thank you for your work on this weather site. I love the accuracy, the information and the photos you display.
Aloha,
Catherine~~~ Hi Catherine, oh yes, the entire leeward slope of the Haleakala Crater, especially from around the 3,000 feet elevation and up has been cold at night into the early morning hours. The clear skies and nighttime downslope land breezes are bringing cold air over us. In addition, the dry and stable atmosphere is lending its chilly aspects to the mix.
I’m at near 3,200′ here near Crater Road, like you are over in Keokea. As long as this huge blocking high pressure system remains parked off the northern California coast, we’ll continue to have chilly to very chilly nights. Not sure about you, although I sleep under two down comforters, and turn to my heavy duty down parka as soon as I get out of bed, with a 300 weight fleece parka draped over my legs (both garments are from Taiga Works in Vancouver B.C). This combo keeps me warm while I sit here starting work at 415am each morning. It’s my exposed fingers that feel the cold most. Thanks for getting in touch Catherine!
Aloha, Glenn
Oh yeah, thanks too for your positive comments of my website!
-
January 3rd, 2022 at 5:45 pm
cathy Says:Aloha Glen
Happy New Year! I have not been able to access Big Blue through Safari or Chrome, from your link on satellite images, can you send another way in to Big Blue ?
Thank you, Cathy~~~ Hi Cathy, indeed, Big Blue doesn’t work anymore. However, I suggest you use the satellite images on my narrative page, as I find them very useful.
Aloha, Glenn
-
December 31st, 2021 at 7:51 pm
Bill Ferguson Says:We have been in Washington for Christmas and are coming home to Kahului Jan. 3rd. We want to wish you a happy new year. Mahalo for your wonderful website.
~~~ Hi Bill, I imagine you had your fair share of cold and snowy weather for Christmas…at least most areas in WA did. Good that you’re coming home in a few days, it will be certainly warmer here.
Thanks for your generous feedback on my website!
Happy New Year!
Aloha, Glenn
-
December 31st, 2021 at 6:27 pm
Robert G Says:Glenn, thank you for keeping us so well informed.
I appreciate you. I’m in lower Kula (Omaopio) where we rarely see any weather accurately portrayed for this piece of heaven.
I wish you a very happy new year! Enjoy the bubbles!
I hope we meet in person someday on the island! 🤗🙏🏽~~~ Hi Robert, ah yes, lower Kula, great place to live. I used to spend quite a bit of time down your way, when I was spending a lot of time with my good friend, Dr. Julie Holmes…who has since passed on. I used to really enjoy the winter months, although in summer, it always felt good (cooler) to be coming up the mountain to upper Kula…where I lived and still live now.
Perhaps we will meet one of these days, if you see me, please introduce yourself.
Happy New Year!
Aloha, Glenn
-
December 31st, 2021 at 1:20 pm
Barb Says:Hi Glenn,
Just wanted to let you know we have been following your forecasts and narrative for many years now and we ALWAYS use your site as our “go-to” for Hawaii weather. We live in Vancouver BC and try to get to Maui whenever we can. Your site is by FAR the best and most accurate all the time!
Anyway, just wanted to wish you Happy New Year and keep up the good work!
Barb
~~~ Hi Barb, great to hear from you up there in snowy Vancouver! I’m happy to know that you’ve been along for this weather ride for so very long!
Thank you so much for your generous praise and acknowledgment, it’s so kind of you, and I take it to heart for sure!
Happy New Year to you my friend!
Aloha, Glenn
-
December 25th, 2021 at 1:35 pm
Lynne Says:Merry Christmas to you, Glenn. Your great site is the first item I check every morning, whether in Kihei for the winter or Evergreen CO for the summer. Thanks for all your hard work!!
~~~ Hi Lynne, that’s wonderful to know, in a way, it makes my day. Kihei and Evergreen, really nice, you have quite the lifestyle! And in return, here’s wishing you a most Merry Christmas as well.
Aloha, Glenn
-
December 25th, 2021 at 7:33 am
Glenn Says:Merry Christmas Glenn. I understand your situation with mom as I am in a similar situation, but closer. Best wishes for the New Year for the both of you.
Aloha, Glenn in South Jersey.~~~ Hi Glenn, and a very Merry Christmas to you as well! It’s tough when our Mom’s get older…that’s for sure! Best wishes to your Mom as well! Aloha, Glenn
-
December 24th, 2021 at 1:57 pm
mary Says:Merry Christmas Glenn
~~~ Hi Mary, thank you very much…and a very Merry Christmas to you as well!
Aloha, Glenn
-
December 20th, 2021 at 11:12 pm
Luke Says:As for your interest in whether or not the Christmas spirit will visit you this year, I can say that your spirit of giving glows bright throughout the year for us who receive your gifts when we come to see you for the weather.. It remains a certain pleasure to daily unwrap the unique messages you deliver with each report and forecast. Glenn, you never fail to gift us with an authentic and integral version of the job you possess – one which gives us all a lovely and personal experience with our weather and our home. I understand the hesitance to feel any magic these days, particularly in a world and season that seems to be largely gripped by motives outside of the greater wonder that is Christmas, but I wish for you that spirit of Christmas enters your home and heart in whichever way that it might allow you to feel the gratitude that so many have for this aspect of your work here in this life. Merry Christmas friend.
~~~ Hello Luke, it’s comments like yours that lift me up and keep me going, through thick and thin! I greatly appreciate your candid and sincere words of praise. I must say that your generous acknowledgment almost brought tears to my eyes, as when I was reading your comment yesterday, I was deeply concerned with my Mother’s health in California. I’ve spent lots of time in California during 2021, in large measure to be with my Mom, or at least close enough that I could be by her side quickly. Now that I’m back on Maui, it seems like a long ways from her rest home.
It’s true this year has been a tough one, actually the last two years for that matter! We all have our various ways of feeling what’s going on in the world, and dealing with it in our own personal way. I feel very fortunate to have the weather to lean into on a daily basis, it comforts me on many levels, and I love being able to share it with all of you devoted website readers…through the past several decades and more.
Happy Holiday’s Luke, and I do consider you a friend as well…definitely.
Glenn
-
December 15th, 2021 at 11:37 am
Jerry Durkan Says:Hi Glenn,
A family member is asking about typical weather in March/
April for the best place to stay on island. I think he means the least rain! Any suggestions? I check your site daily and thanks so much for your detailed reports.~~~ Hi Jerry, I’m not sure which island you will be visiting? However in general, the south and west (leeward) sides of each island are typically the driest and often sunny as well…on all the islands in the state.
I hope this helps, and thanks for using my website!
Happy Holiday’s…
Aloha, Glenn
-
December 8th, 2021 at 11:50 am
Roberto Says:Aloha Glenn, wind weather question … what are the dynamics of wind blowing 90 mph on the top of Haleakala and it was basically calm here in Makawao ? PS: welcome back to da Rock 🙂 RL
~~~ Hi Roberto, thanks for your question, although it’s not a simple answer I’m afraid. There are three levels of the atmosphere, low, middle and high. Often the winds are blowing in different directions and speeds in each of these three levels. In this case, with 90 mph winds atop the Haleakala Crater, and 100 mph winds over the summits on the Big Island…these high peaks jutted up into the middle level atmosphere wind flow, where the strong, sometimes jet stream level winds were much stronger than say down in Makawao. Then of course there is the direction of the winds, which plays an important roll as well. For instance, it might be very windy from the trade wind direction all along the windward sides of Maui, and in Kihei or Wailea…they would be much lighter, due to the topography. I could probably go on and on, although I think I’ll stop here. I hope this helps a little at least.
Thanks for your welcome back!
Aloha, Glenn
-
December 7th, 2021 at 11:09 pm
Alan Says:An amazing Green Flash in Wailea after the storm!
~~~ Hi Alan, we love those Green Flashes…thanks for letting us know! In addition, the sunset last evening was simply fabulous, totally pink!
Aloha, Glenn
-
December 7th, 2021 at 2:50 pm
Pat Bily Says:Welcome back finally Glenn! Hope your Maui life is getting back to normal after that long trip away that so many our age seem to have to make.
You posted >10″ rain recorded at ‘Kula 1’ station monday. What part of Kula is that?
You’re amazing, somehow keeping your site going while flying 2500 miles back to a Kona storm site!~~~ Hi Pat, thanks for your welcome back! The Kula 1 rain gauge is in the Kula Forest Reserve, far up the mountain from Wailea and Maui Meadows.
Actually, this website wasn’t updated from Monday early morning, until I could fly from California back here to Maui. Although once I arrived back home, I found the power had been off for many hours, and it didn’t return until Monday night. So, just this morning I was able to get back online and do all the necessary updating that was needed. I’m “back in the saddle now”, and back to business finally.
Aloha, Glenn
-
December 6th, 2021 at 7:15 pm
Robert Says:G’day Glenn,
With 2 years of covid travel restrictions behind us ( I hope),we are are finally getting back to Maui in February. With the onset of La Nina is Hawaii likely to be wetter or drier this northern winter? I know here on the east coast of Australia its definitely going to be a wetter than normal summer.
Regards,
Robert~~~ Hi Robert, good to hear from you down there in Australia. I hope you get here to Maui as well, as it’s a fabulous place to visit during the month of February. Nothing is for sure, although from all that I’m seeing at this point, it appears that the islands will be somewhat wetter than normal, as La Nina, as you point out, will be active this winter. I trust you will have a wonderful vacation, I bet you can hardly wait!
Aloha, Glenn
-
December 6th, 2021 at 6:59 pm
Mister Rich Says:Nice timing there, Mr. Glenn !
~~~ Hi Mister Rich, indeed, big storm welcomed me back to Maui! The only problem was that the storm knocked out the power to this area in Kula…for over 24 hours!
Aloha, Glenn
-
December 6th, 2021 at 12:59 pm
carl offenbach Says:if possible would you please update satellite imaging link. it has been deteriorating for some time now. malama por favor
~~~ Hi Carl, I just checked all the satellite images, and the radar images too, and they all seem to be current. Could you please be more specific, thanks.
Aloha, Glenn
-
December 5th, 2021 at 11:33 pm
Kathy Blackman Says:Welcome Back Home!
Maui has a doozy of a storm to embrace you!
Have a safe flight!~~~ Hi Kathy, Boy oh boy, indeed…quite a doozy of a storm! Thanks for your well wishes, I’m hoping for the best. Ideally, you’ll be able to log onto my website early this afternoon, and I’ll have my computer equipment set up and will be warm, dry, and hunkered into my Kula weather tower…pumping out the latest updates as usual.
Aloha, Glenn
-
December 5th, 2021 at 11:11 pm
Tommyofhana Says:Just FYI Glenn,
OGG is closed completely currently (7:00pm) due to power outage and generators not working. Hopefully they’ll be up and running for you tomorrow.~~~ Hi Tommy, oh my…quite a bit of fanfare with my arrival back home to Maui…hahaha! I’m certainly hoping that they have got the power supply back on when I land early this afternoon at OGG. Thanks for letting me know.
Aloha, Glenn
-
December 5th, 2021 at 9:33 pm
Butch Says:Howzit Glen!
You’re gonna love this… RIGHT NOW… a waterspout forming & moving on the Sat loop of the IR GOES West sector for Hawaii, see it just below the Big Island less that 100 miles. You can see an eye-like depression in the cloud cover then the dust-devil (type) tail that raises up and into the cloud bank toward the east.
How cool is this!
Easy going,
Butch~~~ Hi Butch, wow, incredible weather that Hawaii is having currently! Thanks for pointing that out, talk about unusual…we’re going off the scale with this weather pattern! I appreciate your sharing this, always feel free to drop a note here, and I’ll be happy to share it with the rest of our fellow visitors to this website.
Aloha, Glenn
-
December 3rd, 2021 at 11:23 am
Jim Jackson Says:Aloha Kakahiaka e Glenn. A friend of mine here on Maui turned me onto your site. His name is Crieghton and he is a vendor at the Maui Gift and Craft Fair in Lahaina at the Lahaina Gateway Center every Sunday. We go to Creighton and ask him for the wind and rain situation every Sunday. Your site is a big help to our Craft Fair’s safety. Thank you for the great weather information.
~~~ Hello Jim, please thank Crieghton for me, in his trust of my weather site! Yes, our weather will be off and on unsettled well into the future, not likely in support of your Sunday function in Lahaina. Things are changing frequently with these unusual weather circumstances…that’s for sure! I’d keep checking back to see the latest changes.
You could refer to this page on my site, for what to expect:
https://www.hawaiiweathertoday.com/maui.php?zone=HIZ018
Best of luck!
Happy Holiday’s…Glenn
-
November 21st, 2021 at 6:27 pm
Jo A. Kimm Says:Aloha Glenn,
I’ll bet you miss your clean Kula air. The Maui community misses you being here on island too. Next time I see you here on Maui, I’ll say hello…now that I know you from your updates! Take care my friend. Jo~~~ Hi Jo, good to hear from you. Like David said, I’m greatly looking forward to getting home to Maui…and being in clean fresh air! Please say hi the next time you see me, that would be cool. Happy Thanksgiving to you my friend.
Aloha, Glenn
-
November 20th, 2021 at 10:14 pm
David Says:Hey Glenn, I hope you can come back to some good fresh air soon. You’ve been gone a long time! Aloha
~~~ Hi David, thanks for checking in with me. It’s so true, I’ve been gone for 6-months, the longest I’ve been away from home…since I’ve been on Maui over the last 45 years. Good fresh air, brought in by the brisk trade winds, sounds so good!
Aloha, Glenn
-
November 13th, 2020 at 7:17 pm
maggie Says:Gee, Glenn. It is as if someone threw a switch and it suddenly turned to winter in Haiku. Cool, damp winds with rainy mornings and evenings have suddenly replaced the hot, dry conditions we’ve had through this summer and fall.
~~~ Hi Maggie, I recall you noting how dry and hot this past summer/early summer had been, so I’ll bet you’re very pleased to see the change to cooler and more moist…although, also has you reaching for your sweater!
Aloha, Glenn
-
November 12th, 2020 at 12:40 am
Helen Says:Thank you for your service Glenn! Also grateful to you for giving us your wonderful weather website! This evening we are having some lovely rain in up here in Olinda.
Take care and stay safe!~~~ Hi Helen, you are very welcome…on both counts! Yes, I can imagine you are having some nice rain over your way, as even here in upper Kula, we’re having some of those showers blown over here on the stiff trades too.
Aloha, Glenn
-
November 11th, 2020 at 4:11 pm
Mary Says:Glenn
No matter the hows or whys, thank you for your service.~~~ Hi Mary, it seems so long ago, and sort of strange to be thanked for my “service”…when all I was trying to do was stay alive. Although, I know what you mean, and appreciate your reaching out.
Aloha, Glenn
-
November 11th, 2020 at 3:16 pm
rege Says:Good afternoon Sir,
Though you have mentioned briefly in the past of your service to our country, todays post seems much more significant! It seems I often forget about the people I knew who went and died, or came home very damaged, and died too young upon their return.
I am very proud and thankful for the veterans who were subjected to the awful
horror that is war. It is a blessing that you and many others were able to survive them and return home to happy and productive lives.
Thank you for sharing, thank you for serving, thank you for the fine man you are!
Dear God, I pray, no more war.rege
~~~ Hi Rege, good to hear from you again, on this Veteran’s Day. Yes, I’ve vaguely mentioned in the past that I was a Veteran, although I can’t remember what I wrote back then. Indeed, for some reason, perhaps just because I’m getting older, I shared a little bit more about that time earlier in my life.
As I mentioned, I barely skimmed the surface of what that experience was like, although perhaps just enough for most folks to know they are very glad they didn’t have that experience.
I appreciate your kind words, thank you very much Rege!
Aloha, Glenn
-
November 8th, 2020 at 10:32 am
Jill Says:Agree with the hip hip hooray…for us and the planet! And thought you’d want to know that in your Interesting section the first two paragraphs are duplicates…just playing editor this morning…enjoy this pretty day!
~~~ Hi Jill, indeed, it seems that about 1/2 the United States is happy, and the other half is sad.
Thanks for pointing out that extra paragraph, I corrected that mistake, and please be my proof reader anytime at all!
It sure is a beautiful day today, lots of clear blue skies!
Aloha, Glenn
-
November 7th, 2020 at 3:08 pm
Alan Beaurline Says:Right on! Hip, hip, hooray!!
~~~ Hi Alan, that’s what I’m/we’re talkin’ bout!!
-
November 6th, 2020 at 1:43 pm
Brad Smith Says:I just wanted to echo Allan’s comment about starting my day with a look at your narrative.
You provide a wonderful service I also enjoyed Debbie’s web site recommendation for all things bat. Like snakes, spiders, centipedes and rats, bats get a bad rap and have a place in this world.~~~ Hi Brad, good to hear from you again. Always happy to know that someone is reading my work, and finds it useful, AND comes back everyday…thank you!
Yes, snakes, spiders, centipedes, and rats freak me out, although as you say, they all have a bonafide place on this round globe of ours.
Aloha, Glenn
-
November 5th, 2020 at 12:48 pm
Allan Says:Good morning Glenn,
Thanks for the great weather reporting every day, it’s the first place I visit in the morning.
I gotta say though that I think there’s something wrong with the Kahalui station, it’s consistently much higher than everywhere else, new record every day. Seems it’s in a microclimate of it’s own. I’m not complaining though, we still have perfect weather all year long and I love it!
Aloha for now…~~~ Hi Allan, good to hear from you. Thanks for your positive feedback, I’m glad you find value in visiting this weather website each day!
I agree with you about the high temperatures at the Kahului AP. I’m simply passing along the numbers that the NWS office in Honolulu issues on their website.
I love our weather too, right there on that with you!
Take care my friend, Aloha…Glenn
-
October 30th, 2020 at 4:55 pm
Debbie Says:Aloha Glenn,If anyone wants to learn more about bats & how amazing they are check out Bat Conservation International. They are dedicated to all things relating to bats.
~~~ Hi Debbie, bats are very interesting, in a somewhat scary way, at least for me. Thanks for turning us on to this website…here’s the URL:
Aloha, Glenn
-
October 30th, 2020 at 8:48 am
Helen Says:Yes right you are ! There is a nice band of rain showers moving through right now!
I hope others are getting some as well. Happy Friday!~~~ Hi again Helen, as long as we have south and west kona winds over us, we’re likely to be getting a few passing showers…which is good. We may find some increase on Sunday too.
Aloha, Glenn
-
October 29th, 2020 at 1:53 am
Helen Says:Hoping for more rain and we are loving the Queen’s Gambit as well!
Thanks again for all you do!~~~ Hello Helen, good to hear from you again! Indeed, with a retiring cold front over the eastern islands, I think we will get some more rain showers over the next few days.
I really liked Queen’s Gambit, so happy you are enjoying it too!
You are so welcome!
Aloha, Glenn
-
October 25th, 2020 at 6:03 pm
Aline Says:Aloha Glen, any idea when this humidity will disperse? Thanks! Aline
~~~ Hi Aline, that’s a good question. It looks to me like it may take until later this weekend, when our light winds shift to west and then north. Perhaps we’ll see the trades returning early next week, which would limit the humidity, that is if another cold front doesn’t approach then…keeping our winds light and the humidity up.
Aloha, Glenn
-
October 24th, 2020 at 2:35 pm
Miriam Says:Hi Glenn
Maui has been so dry for what seems like weeks now. When was our last substantial rainfall? How likely are we to get rain next week? Dreaming of rain for parched Haiku.
Mahalo
Miriam~~~ Hi Miriam, dry all over Maui County, at least so far this autumn. The outlook, considering La Nina, calls for a wetter than normal fall, winter, spring, which would help us…unless most of the significant rainmakers stall over Kauai and Oahu, as they have been lately.
Next week’s event, well, I guess time will tell, although I’m hoping for the best. We definitely need a strong cold front to usher in some moderately heavy rain, without getting too heavy, leading to runoff.
Hang in there, which isn’t easy on the windward sides, with the shower bearing trade winds missing in action!
Aloha, ,Glenn
-
October 21st, 2020 at 3:56 pm
Maggie Says:Aloha Glenn. Fantastic lightning show last night from the slow moving storm that blossomed off Oahu. The lightning in the towering clouds lit up the north shore here on Maui for at least an hour.
~~~ Hi Maggie, I’m a little late in responding, so actually that was two nights ago…and I saw that great show too from here in Kula! Thanks for your comment.
Aloha, Glenn
-
October 21st, 2020 at 3:21 pm
Kiki Says:Aloha Glenn,
Yeah, loved your TV show from the old days….we talked a few times back then while watching the waves at H’Poko (Hookipa). I’m an OLD-time surfer from Oahu and was wondering if Kahului has been under 90 degrees at all so far this month of October!?
~~~ Hi Kiki, I’m sure we had some good conversations watching the surf there on the north shore…great waves break there at times. I used to surf Hookipa in the old days, although only on the smaller days. I remember having to paddle too far out, to make it over some of those clean up sets, and sometimes got caught…scared for me!
As for the Kahului AP, I don’t remember it getting below 90, although there might have been one or two days that were “only” 88. It seems that that location has been tying or breaking records most of this month!
Thanks for your comment and question Kiki!
Aloha, Glenn
-
October 20th, 2020 at 4:41 pm
Gerry Says:Aloha Glenn, Are you aware that when you go to your ‘satellite images” banner on your page and then the icon for the Hawaii GOES satellite feed you get this website “https://www.saic.com/what-we-do/IT-modernization”. Hmmmm
~~~ Hi Gerry, hmmmm is right, I had no idea! I’ll first ask my webmaster to deactivate that link, and try and find the correct link. Thanks for letting me know.
Aloha, Glenn
-
October 19th, 2020 at 9:25 pm
Jen Says:aloha glenn. re; the haze, it seems and feels to me like vog. i know so many on BI say no vog now but even the vog reporting service is showing it covering maui the past few days (and other times, this is just current report). also can see it on windy if you turn on the so2 overlay. since my health went wonky a few years ago i’ve become crazy sensitive to vog in many odd ways but also including my lungs flaring up. so i still keep an eye on the vog forecast – helps me understand why i’m feeling so funky on those days!
http://weather.hawaii.edu/vmap/hysplit/animate.cgi?domain=haw&variable=so2&ftype=ensmean
~~~ Hi Jen, indeed, we’ve had many hazy days late this past summer, and it continues at times early this autumn. Several weeks ago I was quite sure that the hazy skies were being caused by the California smoke. Although more recently it has seemed like vog to me. Vog and smoke have a somewhat differ look and even color (especially at sunrise and sunset times.)
I appreciate your including the animated graphic showing the vog leaving the Big Island, and where our local winds carry it in other places in the island chain. I’m putting a link on this Narrative page, near where I have the weather map link.
I’m sorry that you, and Nina too, have been having definite health problems in relation to these hazy conditions…whatever the source is!
Aloha, Glenn
-
October 19th, 2020 at 11:39 am
Nina Cherry Says:Hi Glenn,
Thank you for your nice note! I definitely remember you from Paia in the olden days.
I asked 1000 people on NextDoor.com and got some answers. Apparently both your fellow meteorologist Malika Dudley on KITV4 and Guy Hagi on Hawai’i News Now have reported on their news that the smoke is indeed coming from the west coast fires.
Someone on NextDoor.com added that it was on national news with radar showing the smoke stretching across the Pacific as well as East (all the way to Europe) during different weather patterns.
That all makes sense to me. Let’s find out more!
Aloha, Nina
~~~ Hi again Nina, well, there’s some votes for smoke having arrived from the wild fires in California. I see that the smoke could get carried here on the trade winds. I know it’s a long way, and of course there would be mixing of the atmosphere along the way too, although I believe it could have arrived, and made our local skies smokey.
Take care my friend from the old days here on Maui…
Aloha, Glenn
-
October 18th, 2020 at 11:40 am
Nina Says:Hi Glenn,
I wanted to ask you why there is so much vog or smoke in the air on Maui for the last month or so. It is really bad! There is a white film on all the mountains. It makes me physically sick.
Is the volcano sending out emissions? Or is it possibly smoke from the west coast fires?
You look so familiar – please send me a note and let me know how we know each other.
Nina
~~~ Hi Nina, thanks for your comment about the haze lately. I’ve questioned myself many times on that same question. At first I thought that the trade winds may be carrying the smoke from the California fires, and stated this on this website several times. I had folks saying “no way”, and many others saying that they thought that it might be smoke…no definitive answer held up though.
I also thought that it could be emissions from the volcanic vents on the Big Island. Although folks said “there’s no vog coming out of the vents now.”
Looking down country from here in Kula this Sunday afternoon, I see lots of haze in the central valley. Oh, and I’m sorry to hear that it’s making you physically unwell!
As for knowing me, or recognizing me, yes, I used to see you down in Paia in the old days! I taught at the University of Hawaii’s Maui campus for many years as well. I still work for the Pacific Disaster Center, which is managed by the UH. As you know, I’m a Meteorologist, and have lived on Maui since 1975.
That was quite a long winded answer, so let me turn my attention to the shower that we’re having now, and spin around in my seat to enjoy watching it!
Aloha, Glenn
-
October 17th, 2020 at 12:51 pm
Jeff McConnel Says:Aloha Glenn,
As a follow up to a message I sent a few months ago regarding the influence of the volcanic activity and rainfall on the Big Island I read an article by Kevin Kodama that is worth consideration. You may have already read it but I found it interesting.
Beyond La Nina, another natural event could also influence the wet season forecast. For years, the Kilauea Volcano has erupted lava on the surface of eastern Hawaii Island. In addition to lava, Kilauea also vented a significant amount of volcanic gas that could impact weather. However, since the conclusion of the 2018 Lower East Rift Zone eruption of Kilauea in the fall of that year, there has been no lava and very little volcanic gas coming from Hawaii’s active volcano.
“Volcanic emissions will tend to hinder rainfall, due to the cloud microphysics and properties,” said Kodama. Too many volcanic aerosols in the air can inhibit the process by which moisture clings to nuclei in the atmosphere to create what eventually becomes rain drops and snow flakes. When Kilauea is active, it makes the ability to produce clouds and precipitation less efficient in areas influenced by those volcanic gasses. “With the lack of volcanic emissions, conditions will return to normal or back to a normal type of regular rainfall,” Kodama said. “In the last couple of summers, on the Kona side of the Big Island, they’ve had pretty wet summers. Normally, the summer season is their (Kona area) wet season, but if you look at this past summer, they’ve had a very wet summer.” One particular rain gauge near Kona has indicated that rainfall this summer was nearly double what the normal amount usually is.
Science that seems to agree with “old ranchers” theory here on the Big Island, “when the volcano is active we have droughts”…
Aloha and thanks again for your efforts in keeping us all informed about weather..
~~~ Hi Jeff, thanks for your comments about rainfall and volcanic emissions on the Big Island. I trust what my friend Kevin Kodoma, from the NWS office in Honolulu, says.
It will be interesting to see what this winters La Nina influence has on our rainfall. Hoping that not all the cold fronts stall or dissipate over the western islands, before pushing down over Maui County and the Big Island. Kona may have had quite a bit of rain, although Maui’s leeward sides could use some rainfall.
Stay in touch, Aloha, Glenn
-
October 17th, 2020 at 9:33 am
Dawn Says:Hi Glenn
We are going to Kauai from Nov. 4 to Nov. 13th. I just looked at the weather and it looks like it is going to rain almost up until our flight. We are from Seattle and could use some sun. Is there any hope for sun during those dates. How bad did we mess up? Thanks for your response in advance….Dawn Riley~~~ Hi Dawn, I understand your concern of course. The truth is that I don’t have the slightest idea what the weather will be like during your vacation to Kauai…as it’s still too far into the future.
I do know that this autumn/winter/spring are expected to be wetter than normal. I would expect that during the two weeks that you’ll be here in Hawaii, that you’ll have sunshine, and some showers too…it just goes with the territory this time of year. It certainly won’t be cloudy and raining everyday, far from it. I hope you have a great time here in paradise!
Aloha, Glenn
-
October 15th, 2020 at 4:32 pm
Steven Sagar Says:Aloha Glenn,
I think I have to go with Barca on this one. I have been following the weather here in Maui for 35 years. Ever since they replaced the temperature gauge at the airport, the average temperature has been 4 to 9 degrees hotter than anywhere else in Hawaii. I know it was hot yesterday but was Kahalui really 9 degrees hotter than Kona ?? I don’t know if the replacement thermometer was somehow placed in a different spot? or new tarmac or recent building has affected the gauge ??Something has changed because I find it impossible for Maui to be the hottest spot in Hawaii every single day. Mahalo as always for your unselfish efforts to bring us the most incredible weather reporting possible. Have a great week and Aloha,
Steve from Napili 😊~~~ Hi Steve, good to hear from you again. I know, it’s true the Kahului AP is so often the hottest major airport weather station, tying and breaking records left and right.
I honestly don’t know what the reason is, although I’m inclined to agree with you…something is different with the thermometer readings these days.You’ve graced me with some very positive feedback towards the end of your comment, and for that, I thank you very much my friend!
Aloha, Glenn
-
October 9th, 2020 at 5:05 pm
Nancy Lorenz Says:Loved your TV show! That’s how I first discovered you, early one morning on a trip to Maui. Hooked after the first episode; had never seen a weather report with Aloha! Continued to follow you on the internet, which was rather new to us in those days! Glad you are still hooked on weather. Thanks for all you do.
Nancy~~~ Oh Nancy, how good to hear from you again, there in Sebastopol, one of my favorite places in the world!
Oh yes, that wonderful TV weather program, definitely one of the high points in my life, and was so thankful that through a NASA grant at the University of Hawaii, I was able to jump from the TV to the internet…into this website!
Indeed, I’m still definitely hooked on the weather here in Hawaii, and everywhere else in the world as well. I trust that you and your family are well, after all the heat, drought, fire and smoke in Sonoma County this summer into fall.
I always look forward to visiting Sebastopol, hopefully some time this year.
Aloha, Glenn
-
October 8th, 2020 at 12:25 pm
Joanne Vasquez Says:Aloha Glenn, we check out your weather info every morning. Thank you for providing such important info.
We see record highs in Kahului day after day after day. Do you have a count of how many record highs have been recorded year to date?much aloha
Joanne~~~ Hi Joanne, you’re very welcome, I’m happy to provide the latest updates on a daily basis. Indeed, the Kahului AP sure seems to be the very warmest major airport weather station in the state. I would imagine that if there were official thermometers in Lahaina and perhaps even Kihei, they would provide even higher temperatures by a degree or two. As for how many records have been established in Kahului, I don’t have that information.
Aloha, Glenn
-
October 8th, 2020 at 7:07 am
J.R. Says:Aloha Glenn,
Lucky I lived Maui 11/17/2003-2/29/2004!
Caught your TV wx every day I could at Maui Memorial before work.Blaming my weather obsession with aspirations of being a pilot back in the 1960’s. Facsimile machines with a purple hue printed satellite photos way back then,got the expired ones to mull over from the local Flight Service Station.Great to see you’re still feeding the need for current weather. I’m planning on bicycling the summit with 200 of my closest friends July 2021! Aloha from Wisconsin,
J.R. (“Kimo” in my dreams)~~~ Hi J.R. good to hear from you there in Wisconsin. Indeed, I sure was doing my TV weather show back then, actually started doing it in 1996. Yes, things have changed remarkably with all the weather information now online…what a great change! Biking the Crater next year with lots of your friends, wow! I sure hope that this crazy Pandemic clears up by then, so you can live out your dream!
Aloha, Glenn
-
October 2nd, 2020 at 2:01 pm
Lloyd Shiraki Says:Surf was firing early this morning glassy conditions with good swell angle @ Ho’okipa.
~~~ Hi Lloyd, I figured as much, we’re into October, and storms are brewing to our north and northwest now that we’re into Autumn. I trust you got some good barrels to drop into…there on the north shore!
Aloha, Glenn
-
October 1st, 2020 at 1:53 pm
Randy Ore Says:Aloha Glenn,
Just a shout out to say thank you for all the years you have been providing the weather that is useable for everyone to use and decipher, but also providing advanced charts i.e., the surface analysis chart that provides a good picture for us wind sports enthusiasts. We also appreciate the storm forecasting for other regions. We split our time between Maui and Playa Del Carmen, Mexico and it is very useful to see what you provide us for there as well in the Caribbean. A couple of systems of concern now and got the scoop here. Keep up the good work, sure miss the baseball throwing shakas!
All the best, Randy
~~~ Hi Randy, great to hear from you, especially with the very positive feedback you’ve thrown my way! Yes, I’ve always been a weather nut, since I was a very young boy, and haven’t faltered an inch…as you can see. I love the weather, and especially the daily changes that take place, and beyond that…I love to share that information with others.
Oh yes, you used to watch my live broadcast, daily, TV weather show that went out to each of the islands. I was teaching at the University of Hawaii, Maui campus back then, and the media department produced my show…of course commercial free as you know. That show was so much fun to do, and I got such great feedback too. I got so busy doing so many things at that time, during the prime of my life, that I had to let go of something, and that weather show was it. I’ve always loved throwing a baseball, still do it now, with a rubber ball on the wall.
Glad you enjoyed my shaka, and here’s one going out to you and everyone else who remembers my doing that! (virtually)
Aloha, Glenn
-
September 27th, 2020 at 5:55 pm
Jerry Says:Hi Glenn- Been following you for many a year. Have you considered doing a Youtube channel. Thanks for all the great weather info…Jerry
~~~ Hi Jerry, thanks for following me for all these years! You know, I did live TV weather for over 18 years, and I think that’s enough on the air time. I prefer doing this website, so folks don’t know how long my hair has gotten! 🙂
Aloha, Glenn
-
September 23rd, 2020 at 1:39 am
Mary Kay HofMann Says:The maps showing the weather developments during the hours of darkness are a splendid addition to your website. It is mesmerizing to watch the weather bloom and dissolve against the background of the city lights and darkness of the rural areas. Can you tell us a little about the technology that produces these map, please?
~~~ Hi Mary Kay, good to hear from you. I’m glad you enjoy viewing the city lights shown on those satellite images, during the nighttime hours. As far explaining the technology behind these images, I’m afraid I don’t have much to say, other than to say I enjoy viewing them too.
Aloha, Glenn
-
September 21st, 2020 at 3:59 pm
Lane Says:We are to 11 year olds that are doing a home school project and one of the questions was why is it so windy on the north shore of Maui and we where wandering if you know the answer.
~~~ Hi Lane, good to hear from you with your good question. The windward sides are on the receiving end of our northeast through easterly trade winds…because they face in that direction. This is in contrast to the south through west leeward sides of the islands…which face away from the trades coming in from over the ocean. This reverses of course, when we have our southwesterly Kona winds blowing…generally during the winter months.
I hope this simplified explanation helps…
Aloha, Glenn
-
September 21st, 2020 at 3:24 pm
Scott Says:Aloha Glen,
Many MAHALOs for sharing your passion and generous time with your followers for soo many years. I cannot adequately express my appreciation in words.
Uncle Dave beat me to the concern of missing your delightful images which had complimented each of your four activity sites as well as your daily narrative sites over the years. You had expressed the time-intensive effort to do this, especially considering this season’s meteorological activity levels.
As an almost daily ocean adventurer of all sorts, I visit all of your four activity pages every morning even before I open my own e-mail. I am in hopes that your images will return to all their respective places eventually as your time allows. These images really contribute well to each of your narratives! I just wanted to express my daily anticipation of which images you had procured overnight as I prepare for another Maui ocean day. Sincerely, Scott
~~~ Hi Scott, great to hear from you, and I so much appreciate your kind and generous words of positivity surrounding my ongoing weather work on this long lasting weather site.
I’m glad to know that the site brings you such pleasure, and adds value to your daily activities. By the way, I don’t know what your profession is, although I’d like to say I admire your writing skills…so clear and concise indeed.
As the hurricane season winds down some going forward into this new autumn season, I’ll gradually be gathering more of the beautiful pictures that represent our wonderful Hawaiian Islands, and share them on each of the individual pages…thanks for your patience Scott.
Aloha, Glenn
-
September 21st, 2020 at 1:55 pm
Uncledave Says:Many great pictures at my Facebook group MAUINOKAOI. with the sunset picture
~~~ Hi Uncledave, thanks, I’ll start using a few of your photo’s…thanks.
Aloha, Glenn
-
September 21st, 2020 at 9:25 am
Uncle Dave Says:Happy to see your pictures back thanks Dave
~~~ Hi Uncle Dave, we like the pictures!
Aloha, Glenn
-
September 19th, 2020 at 11:01 am
Brad Smith Says:Aloha Glen, I was wondering if the resident high pressure north of the state is ever referred to as the “Hawaiian High”, in the way that the Atlantic mid latitude high is often called the Bermuda High or Azores High?
~~~ Hi Brad, I’ve heard it referred to as the Hawaiian High, especially when it sits directly to the north of the islands for a long spell. Otherwise, the high is referred to as the North Pacific High, when it sits to the northeast of Hawaii…and west of the California coast.
It’s strongest during the northern hemisphere summer and shifts towards the equator during the winter, when the Aleutian Low becomes more active in the Gulf of Alaska. It’s responsible for California’s typically dry summer and fall and typically wet winter and spring…as well as Hawaii’s trade winds.
Aloha, Glenn
-
September 18th, 2020 at 11:08 pm
Keith Says:Aloha Glenn – the haze this afternoon – do you think it is from the west coast smoke finally reaching us?
~~~ Hi Keith, I’m not exactly sure, it could be, and then again it could be the dust being kicked up by the gusty trade winds that are blowing through the central valley?
Aloha, Glenn
-
September 18th, 2020 at 8:44 pm
Patsy Says:Good Afternoon. Thanks for providing a great source of weather information for both the Pacific and Atlantic regions. We live in Haiku and have a running argument over the amount and distribution of the rain. I think that it has been consistently dryer this year. Robie disagrees. Want to get in the middle of that disagreement? If you have access to a link that would show the past few years (or more) of precipitation, I would appreciate your posting it. Thanks again, Patsy
~~~ Hi Patsy, As you know there’s no official rain gauge in Haiku. So you’re going to have to refer to the Kahului gauge, which of course typically gets much less rainfall than further out along the Hana Hwy…including your area. I used to do daily rainfall measurements when I lived in Hawaii for about 20 years, although not sure where I’ve stashed those now. At any rate, here’s a website that you can search back on and find weather info back in time. It may no interest you as it’s not a fair representation of your area, although here it is anyway. Interesting question you pose tho, perhaps someone else reading this, who lives in Haiku, may have a record, and can chime in here?
Aloha, Glenn
-
September 17th, 2020 at 8:24 pm
David Says:Aloha Glenn,
Thank you for answering my inversion question. I always learn a lot from you!
I have just one more on this, which is more semantic: why would an area of stability be called an ‘inversion’? Is something being inverted?
Mahalo, d
~~~ Hi David, you’re very welcome. The most simple answer to your question, besides what I wrote before is…an inversion, also known as a temperature inversion, is a deviation from the normal change of an atmospheric property with altitude…which is cooling as air rises.
Aloha, Glenn
-
September 17th, 2020 at 8:16 pm
Dave Barca Says:Hi Glenn,
Thanks for the great job you do.
Quick question. I heard that the temperature for Maui, as seen in all of the newscasts, is taken on the airport tarmac and that is why it is higher than other islands. True or urban myth?
Thanks.
Barca~~~ Hi Barca, you’re very welcome! I’ve received that question many times, and the truth is that I don’t know exactly where at the Kahului AP it is located. However I do know that the thermometer is held in a white louvered box, 4-feet above the surface, not sure if it’s on the tarmac or not? It is certainly true that the high temperatures are by far the highest in the state…repeatedly. Like today, it was 94, just short by one degree of tying the record, set back in 1995.
Aloha, Glenn
-
September 17th, 2020 at 11:03 am
Margie Lovell Says:Thanks for bringing the photos back!
~~~ You’re welcome Margie…Aloha, Glenn
-
September 14th, 2020 at 12:33 pm
David Says:Aloha Glenn,
Would you mind explaining what trade wind inversion is?
Thanks, david
~~~ Hi David, here is some information on inversions, perhaps more than you need:
Inversions have a big impact on the weather we see in Hawaii. The typical driving force we see in Hawaii associated with the trade winds is due to sinking air associated with high pressure systems. An inversion is a stable layer in the atmosphere.
Because an inversion limits how far air can rise, it plays a big part in how strong convective clouds and showers can become. When air is forced upwards, whether along a front, a sea breeze, or by the terrain of the islands, it will keep rising as long as it is warmer than the air around it.
An inversion limits how far it can rise, providing a limit on how strong showers will be. Because an inversion limits how high air can rise, it effectively puts a cap on the height of most lower level clouds.
The average trade wind inversion height in Hawaii is around 7,000 feet. The inversion may be lower, due to sinking air closer to the state, which would lead to lighter showers or, in the case of a really low inversion, just some clouds but no rainfall. The inversion may be higher due to an upper level trough, which would lead to heavier and potentially more intense showers.
Since the average inversion height is lower than our tallest mountains, many times the lower slopes will be cloudy but the summits of Haleakala, Mauna Kea, and Mauna Loa will be clear.
-
September 12th, 2020 at 9:08 pm
Dwight Says:Hi Glenn,
As I’m sure you’re aware the water department has imposed strict limits on water consumption for upcountry and west Maui. Just wondering if you have any near and longer range predictions for the fall and winter anticipated precipitation levels?
Aloha,
Dwight~~~ Hi Dwight, that’s a good question. Given the fact that the El Nino Phase of ENSO is turning to the La Nina phase this fall into winter, this can mean that we could see somewhat more than the normal amount of rainfall arriving over parts of the state…hopefully over the entire state. This is not a sure thing, although I’m personally leaning in this direction myself. Here in upper Kula at the moment, our grass is turning brown and crispy, due to the lack of rainfall lately.
Hoping for the best…
Aloha, Glenn
-
September 12th, 2020 at 2:49 pm
UncleDave Says:Aloha Glenn what happened to your picture of the day really miss it. Keep up the good work Dave
~~~ Hi Dave, you know, over the years I’ve had pictures gracing this website, as you point out. It’s a lot of work to dig up so many pictures each day, or even every couple of days, new pictures that aren’t often repeated. Given the amount of work that I’m doing all day long on this site, and in my work for the Pacific Disaster Center, it’s been a bit too much to do this summer, with all the tropical cyclone activity worldwide. However, one of these days when I catch my breath so to speak, I’ll start adding some photo’s. I’m sorry, as I enjoy those pictures as much as you do!
Aloha, Glenn
-
September 11th, 2020 at 7:49 pm
Jill Says:Thank you for the really nice story about the barn swallow chicks…a wonderful respite from the rest of the news. Nature carries on…with a little help sometimes.
~~~ Hi Jill, you’re very welcome, the swallow chicks story hit a cord with me as well, as we all need a little shift in the type of news that continues to flood our senses.
Aloha, Glenn
-
September 6th, 2020 at 12:39 am
Suzanne Says:Aloha Glenn…Need some boating advice.please… We are thinking about using our 22 ft Boston Whaler on Monday leaving from LAHAINA and going all the way to shark fin rock which is on the south end of Lanai, About 5 miles past Manele Bay. It’s around 23 miles from Mala one way.
There are moorings near the shoreline therebat the south end and we’ve been to that location before and had no problems. However, if there is a south swell it might be too rough and therefore a wasted effort. What do you predict the conditions to be like for that location on Monday….wind and waves. Mahalo! Suzanne~~~ Hi Suzanne, I’m sorry, I don’t feel comfortable giving my opinion on whether or not to go. The winds are still locally quite strong, despite no small craft wind advisories. There is a south swell running now in our local waters as well. So, if you go, best of luck!
Aloha, Glenn
-
September 5th, 2020 at 10:22 am
gerald durkan Says:Did you feel the earthquake last night at 9:43pm? It was centered ese of Paia. We felt a loud jolt without any real shaking.
~~~ Hi Gerald, no I didn’t feel the earthquake, I was already asleep. I get up so early, I have to go to bed early. Interesting, a loud jolt without feeling shake.
Aloha, Glenn
-
August 29th, 2020 at 1:53 pm
Roz Says:Aloha Glenn, thank you for adding the hurricane charts. We have been going to the separate site. We greatly appreciate all your efforts. Roz on Molokai
~~~ Hi Roz, you’re very welcome, I appreciate your positive feedback! Aloha, Glenn
-
August 28th, 2020 at 11:24 am
rege Says:Howzit Bra,
Oh I wish, I wish, I was a loco! Just viewed the Haleakala cam! I love walking down the sliding sands hours before the sun rises. Magnificence! Tried to view some web cams you have linked, could not connect to most? But, Sorentos on the beach came in loud and clear! So beautiful! News today stateside is bad, surge in Hawaiian cases! Sheet!!!
I think I can paddle board across the pacific: right, how hard can it be? Who will join me?
Glenn, thanks for all you do here, it is very pleasing to me!
rege
p.s. douglas, sorry for being “SNARKY” about that name, it is a great name!!!~~~ Hi Rege, you’re coming in loud and clear, you miss being able to visit Maui, and to take your beloved hike down into the Haleakala Crater! I totally understand, and I’m sure lots of others who are reading your comment would totally agree with you! BTW, I wouldn’t recommend paddling across the Pacific, as it’s still hurricane season…and one of those could push you around a little too much. Anyway, hang in there, and stay above the fray of the pandemic and everything else that’s going on during this crazy time in our lives!
Aloha, Glenn
-
August 27th, 2020 at 4:48 pm
Charlie Says:Aloha Glenn, Thanks for publishing such a useful and comprehensive site – we have enjoyed it for years (21 years in Kula on Oct 1st!). Curious how you judge the diving and snorkel conditions – don’t want to sound snarky, but as far as Wailea/Makena, you are usually way wrong! Just got back from Maluaka and the visibility was phenomenal! We’ve been using the ‘wave energy in kJ’ from surf-forecast.com and are finding that when it is below the mid 20’s, the visibility is great – not just ‘marginal to good’. Just was wondering…
~~~ Hi Charlie, thanks for your comment, and thanks for your mostly positive feedback. You know I never use the word snarky, so I’m not exactly sure what it means, and am hesitant to look it up…smiling! At any rate, I use surf reports to estimate diving and snorkeling visibilities, and when it rains hard of course, there’s runoff to factor in. I’m sorry my reports are misleading for the area you particularly like to go to. Oh well, wishing the best visibilities for your trips down to the ocean!
Aloha, Glenn
-
August 26th, 2020 at 6:05 pm
Maggie Says:Hi Glenn. You recently commented on the odd haze on Maui and wondered if it had anything to do with the fires in California. At first I discounted that possibility, but the EPA has a pilot with particulate sensors that showed smoke plumes drifting well down into central Mexico and then drifting out into the Pacific. It’s probably still unlikely that they were responsible for our unusual haze, but smoke plumes also reached as far as New England, so I suppose it is a possibility, albeit an unlikely one. Aloha.
~~~ Hi, Maggie, as a matter of fact, I have felt that the recent smoke and haze here had its source as the wild fires in California. Some folks have agreed with me, and others had not, although I’m sticking to my guns about this issue. Several days ago it was really hazy or smokey, although it’s cleared quite a bit…the last several sunsets have had a definite red smokey look to the west. If you look down several comments from here, you’ll see the thread of comments and my responses in regards to this issue. So, I’m with you, I think the trade winds carried some of this smoke across the Pacific…and into the Hawaiian Islands. Thanks for your comment!
Aloha, Glenn
-
August 25th, 2020 at 9:15 pm
Glenn Says:Aloha Glenn. I hope all is well with you and the rest of your family. We are missing Maui with all that is going on. I bet it is a lot quieter than it has been in a long time! Our last couple of trips were crazy with the amount of people and traffic. Just wanted to say I am missing the beautiful photos you put on various pages. I like checking them out each day. I hope that the change isn’t permanent. Take care and stay safe.
Glenn in South Jersey~~~ Hi Glenn, good to hear from you again. I’m sorry you haven’t been able to visit one of your favorite places this year, many folks are feeling the same way I’m sure! You know, I live upcountry, and rarely drive down country anymore, so I honestly haven’t noticed the big change in visitors that haven’t been here on vacation. I do notice the much less traffic on the Haleakala Crater road, as I walk in the mornings, which I must admit is nice! As for the missing pictures, I’ve taking a break from those for the time being, I’ve been so busy lately, that I’ve discontinued their presentations. I like them too btw! At any rate, best wishes to you and yours, be well!
Aloha, Glenn
-
August 25th, 2020 at 4:27 pm
Gerry Says:Aloha Glenn
Couple of things. The haze over Maui County certainly had that smokey character to it but none of the odor….we still go for SoCal smoke….pretty convincing satellite image you showed. Second we have been having discussions over the hottest month of the year….as farmers we take note! The great god Google shows August but Maui Electric had September on one of our recent bills. What does the weatherman say? Either way it is hot!!!~~~ Hi Gerry, good to hear from you. You know, I had a couple of friends, who work up in the Haleakala Crater observatories, and they confirmed that there was at least a bit of smoke arriving over some parts of the state, that had their source from the California fires. Fortunately, it has gone away now, which is a relief! Indeed, our late summer is hot, hot, hot, and I for one am looking forward to the cooler weather of fall and winter!
Take care and be well!
Aloha, Glenn
-
August 25th, 2020 at 12:49 am
Patti Ballerini Says:Aloha, Glenn…Though I’m no expert, I wouldn’t be at all surprised to believe that the haze or smoke you experienced today over Maui was a result— at least partially— of the California fires. They are massively impacting Northern Cal. I live in Folsom which I know you know is about 25 miles east of Sacramento. The last 5 days have been nearly unbearable as well as completely unbreathable. It’s confined us all to our homes as it is, literally, very unhealthy to breathe. It’s covered outdoor furniture and plants with a fine gray pinhead sized ash. How the global wind currents might get our smoke from east to west across the Pacific, I can’t say but it seems possible, don’t you think? Sad to say, the pandemic cancelled our family’s Maui trip this year and it’s the first time in nearly 50 years that I haven’t been able to visit at least once. But, I have my fingers crossed for next summer and as always, I remain a devoted reader of your site to keep me informed about all the current and projected weather in Hawaii and the Pacific. Thank you for your service, Glenn.
Best always, Patti~~~ Hi Patti, sounds terrible, as those California fires are so outrageous! So sorry to hear about your having to cancel your beloved vacation here on Maui too! Life is a bit different now for all of us, as restriction abound in so many areas. Indeed, there was a bit of smoke from California that drifted over to the islands on the trade winds, although now on Tuesday, it’s gone through…leaving us with very clear air for a change. I wish the very best for you and your family and friends, truly. Thanks so much for staying in touch with the islands through this weather website!
Aloha, Glenn
-
August 24th, 2020 at 6:16 pm
William Johns Says:Aloha Glenn:
Earlier today I went for a drive from Maui Meadows to Kahului and Wailuku. I also noticed the haze In the air yesterday afternoon and again this morning at sunrise…As we are both originally from Southern California we are familiar with the difference of atmospheric pollutants. Smog, Vog, and high humidity all have different colors. Smoke has a distinct red cast to it. My vote is smoke.
We know that when a volcano erupts that gasses and ashe rise to very high elevations where winds can carry the nasty aerosols around the globe in a few weeks or less…(Dinosaurs gone?)
Strangely enough I experienced “winged critters”…(house sparrows, moths, grasshoppers, and larger birds)…while I was on a commercial tuna boat that was over seventy five miles off the coast from the LA area where brush fires were raging on land…During So Cal brush fires this is a common occurrence with Santa Ana offshore winds…The heat updraft of the fires raises those little critters very high and blows them offshore to where the fishing boats collect critters by the thousands which are attracted to the deck lights… So many that a fire hose was needed to wash them off the boat so you would not walk on them. BTW…the tuna loved the free meals. I saw this on multiple trips over a ten year span.
Now as your friends.~~~ Hi William, what an interesting comment you’ve left for us all to read. Yes, we actually got a tad bit of smoke from those California fires, about 2500 miles away…out here in the central Pacific. It’s amazing to think that that smoke could be carried so far on our trade winds. It sure hot hazy with that smoke, and a bit of a small fire in the central valley at the same time…as you know, being here on Maui…we were breathing some pollutants for several days. Although, nothing like what our friends in California are having to deal with!
Take care, Aloha…Glenn
-
August 24th, 2020 at 2:00 pm
Robie Says:Yes, my wife noticed it on our morning walk here in haiku. there was and still is a definite shift to warm in the color spectrum of light. from our house i don’t really see any haze though. i bet your right! hey, that atlantic hurricane season is continuing to be a very interesting one. robie
~~~ Hi Robie, yes it was less noticeable over on your windward side of the island of Maui, although over here on the leeward side of Haleakala, from up here in Kula, it was quite a sight to see all the haze and smoke recently. Although, as I mentioned above, we are back in the clear again now…thank goodness!
Aloha, Glenn
-
August 24th, 2020 at 1:34 pm
Eric Phillips Says:Yes the haze/smoke is from California. Check out the Mauna Kea cam.
~~~ Hi Eric, indeed, this was confirmed by a friend who works up at the observatory here on Maui as well.
Glad its gone now!
Aloha, Glenn
-
August 24th, 2020 at 1:14 pm
Lou Says:Aloha Glenn,
I’m glad you’re researching the source of the haze. We noticed it yesterday evening and it was still there this morning. On our drive to the summit this morning I will tell you it is everywhere up to about 10’000 feet and all around the island and from what I can tell all around our neighboring islands and at least between us and the Big Island. Weird.
Cheers,
Lou~~~ Hi Lou, good to hear from you. Yes, it seemed to be some leftover smoke from a small fire in the central valley a couple of days ago, and a bit of smoke from the fires in California…quite a mix! Interesting that you drove up to the top of the Crater, and it was that deep in the atmosphere! Weird is a good word I think, in aptly describing that recent atmospheric haze!
Take care and Aloha…Glenn
-
August 24th, 2020 at 12:09 pm
Will Says:A morning report from your fan on the Kohala mountain. It’s hazy here too. Reminds me of the vog . Anyway hard for me to imagine a small fire on Maui causing haze here.
~~~ Hi Will, exactly, it was more than the small fire here on Maui that got your hazy on the Big Island! It looked voggy for sure, although at sunrise and sunset, it turned a brownish red, which is typical of having smoke in the air. Glad its gone!
Aloha, Glenn -
August 19th, 2020 at 2:11 pm
Suzanne Albers Says:Aloha Glenn
We are planning to use our Boston Whaler tomorrow, Thursday, from about 11 am til 4 pm. We will be in the waters off Lahaina. Your forecast said light winds with a 50% chance of rain. If it rains we will Cancel. What are the chances of rain on the west side? Will we be able to tell in the morning?
Thanks, Suzanne~~~ Hi Suzanne, I’m sorry I’m late in responding to your comment, actually to everyone’s comment recently, as I had made an adjustment to my editor on this page, and it hid the comments from me. I just happened to readjust, and saw that I had all these comments, darn! I hope you had a good sail at any rate!
Aloha, Glenn
-
August 16th, 2020 at 12:59 am
Jean E Tappan Says:Hi Glenn! It’s been a while since we’ve connected. Just thought you would be interested-&you mentioned it was 78°in your tower. That was our high temperature today also here in Alaska. That’s unusual for here but we’re enjoying it while it lasts.
Has Maui opened up lately? My daughter didn’t go to her condo in June because everything was shut down.
Hope all is well with you. We’re getting by but I sure miss Maui.
~~~ Hi Jean, its been so long since we’ve been in touch! Wow, really warm there in your area of Alaska, that must feel good, as it won’t be long before you start to feel that coolness of early autumn I’m sure! Yes, folks can’t fly directly from the mainland to Maui, and there are still lots of restrictions I’m afraid…with potentially more on the horizon. I trust that you and your husband will be able to return next year…at least I hope so!
Be well, Aloha, Glenn
-
August 9th, 2020 at 4:44 pm
robie Says:funny video thanks
~~~ Hi Robie, yeah you’re welcome…I think we’ve all had these things happen to us over the years!
Aloha, Glenn
-
August 8th, 2020 at 12:07 am
Douglas MacDougal Says:Aloha Glenn
Well…. I,for one, thought the name “DOUGLAS” was an inspired choice for that interesting Tropical Cyclone (Hurricane) that recently passed by.
When, in the rarefied atmosphere of the World Meteorological Organisation, those learned people charged with choosing a name get to the “R”s, your recent correspondent will, no doubt, pay close attention.
As usual, Glenn, your site provides me with a daily dose of merriment and thought.
We all miss Maui and in particular Kapalua.
Stay well
DOUGLAS~~~ Hi Douglas, indeed, I’m sure you were watching closely as you, I mean this last tropical cyclone passed by very close to the north of the islands. Yes, and if Rege gets a storm named after him later this hurricane season, then he too will be focused intently as well I’m sure.
I’m very happy that you are still viewing my website so closely, I greatly appreciate that!
Sorry you can’t come flying back to Maui, I know you would love to be here!
Take care,
Aloha, Glenn
-
August 7th, 2020 at 2:46 pm
rege Says:Who is the namer of hurricanes and tropical storms? Well, I suggest Mikes daughter should have the privilege of naming the next one any where in the world!
Isaias, sorry, can not begin to pronounce it… or know the origin of it, perhaps the selectors of the names could give a little more back ground as to the reason and method of the selected names. Douglas…Meh! Really, who in the world has the power to name these things? My vote is of course that Glenn James should be the namer of every storm within a thousand miles of Maui!!! But I know nothing.
Sorry to bloviate on your site Glenn, but I miss Maui so much!! I’ve always taken the ability to travel there for granted, wow, never saw this mess coming. Counting the moments till I can return. Glenn, thank you for keeping the beauty and the dream alive for us who long to visit you island again!Aloha,
rege~~~ Hi Rege, good to hear from you again. The World Meteorological Organization names tropical cyclones in some parts of the world, although in others, the local agencies, like the Central Pacific Hurricane Center here in Hawaii, gives Hawaiian names to storms.
I can’t get my tongue around the name Isaias either! Thanks for suggesting that I give tropical cyclones here in the central Pacific…their names. That would be fun indeed, and we’d have to name one Rege right away, since it was your bright idea!
You’re not alone that’s for sure, many, many folks I’m sure greatly miss being able to come to Maui on vacation, coming back to the beauty of our wonderful island here in Paradise!
Take care of yourself!
Aloha, Glenn
-
August 5th, 2020 at 2:05 am
David Says:Aloha Glenn,
Just reading through the question’s about Douglas’s track and how once again we have had a near miss, I can’t resist asking:
Is there anything to the persistent rumor that the military is “playing “with these storms with various technologies such as microwave energy, cloud seeding etc. in a effort to push them away, and maybe even succeeding in some cases?
Would you be free to tell us if you knew?
Thanks! David
~~~ Hi David, I’ve had others in the past ask that same question. My quick answer is no, at least as far as I know. It’s beyond me to know such things, although thanks for asking.
Aloha, Glenn
-
July 31st, 2020 at 2:08 am
robie Says:thanks for your atlantic coverage of now hurricane isaias. seems like hurricanes love that path across the old bahama channel up through the bahamas and into the straits of florida. best wishes to all Bahamians. thanks, robie
~~~ Hi Robie, you’re welcome, my intention is to cover storms around the globe, as I’ve always been a guy who loves such things…ever since I was a little kid in fact.
Aloha, Glenn
-
July 29th, 2020 at 11:34 pm
Bill Alpenfels Says:Aloha Glenn
Thanks for your hard work keeping us informed. I was tracking Douglas the earth.nullschool site. It showed Douglas taking a more northerly track than forecast. Does Haleakalaā influence the track? It seems like the models don’t factor in the really big mountains in Hawaii.
Thanks
Bill~~~ Hi Bill, good to hear from you, you’re very welcome!
As for whether the models utilize the bulk of both the Big Island and our two mountains here on Maui…in their output? I seem to remember reading or hearing somewhere along the line, that they don’t, although I’m not positive about that. If anyone has a definite fact about that, I’d appreciate you chiming in…as others here have asked that same question.
If I hear anything I’ll share it with you and everyone else who is curious…good question!
Aloha, Glenn
-
July 27th, 2020 at 10:57 pm
Gary Says:Glenn:
My son and I were trying to figure out how it was that Doug managed to be very close but miss all the islands. Is it just coincidence or is there any theory out there about hurricanes and land masses or some other esoteric theory that would explain the phenomenon?
aloha
Gary~~~ Hi Gary, good question of course. When you think about how huge the Pacific Ocean is, and how much water there is between where Douglas began, as an area of disturbed weather well offshore from Mexico in the eastern Pacific, and eventually attained a category 4 rating, traveling some 2000+ miles out into the middle of the ocean, and then comes within 45 miles of the islands at its closest approach, it’s just hard to believe! I’ve watched this happen so many times, over and over and over through the years. As we know, very few of them strike us directly, fortunately. Although Douglas is pretty famous now for coming so close, and yet missing us just enough. That the storm was just enough to our north helped of course, what with the wind shearing effect coming up from the south, at just the right time, nudging it just enough as well. I’m know I’m not addressing your questions, although I’m not sure I could get my tongue around an adequate answer anyway. Does luck qualify do you think? It sure was exciting to have tracked it for so long before hand, and then even more exciting watching it skim by us so darn close…as you point out. This was long winded way of saying I’m not sure what the answer to your question is, sorry about that.
Aloha, Glenn
-
July 27th, 2020 at 8:58 pm
Mike Lagana Says:Aloha Glenn, My daughter was wondering why this hurricane did not have or adopt a Hawaiian name like Iniki. Thanks!
~~~ Hi Mike, good question. As it turns out, Douglas formed and took on a name in the eastern Pacific. When a name is given, it retains that name when it comes into our central Pacific…and even if and when it were moving even further into the western Pacific. Once a name is picked, it sticks throughout the life of the storm.
Aloha, Glenn
-
July 27th, 2020 at 4:46 pm
ruth morrison Says:was there any storm surge on east side of Oahu near Waimanalo or street flooding?
~~~ Hi Ruth, I’m not aware of any storm surge or street flooding, although perhaps someone that lives in that area of windward Oahu could chime in?
Aloha, Glenn
-
July 27th, 2020 at 2:29 pm
Becky Says:Aloha Glenn:
Mahalo for all the hard work you put in yesterday. I live on Kauai, and since we were the last island to possibly be trampled by Douglas, it was very helpful to check your website to stay updated. It is nice to be able to go to one site which has all the information bundled in one easy to read format. You helped keep my heart rate down!
All the best,
Becky~~~ Hi Becky, we want you to remain mellow up there on Kauai, no racing heart beats, at least in reference to approaching hurricanes!
I’m glad you find my website easy to understand and useful, I endeavor to keep it that way always. Enough depth to be satisfying, although not so deep that you have to be a meteorologist to understand it.
Glad the Garden Isle got off easy…as it turned out Maui County got the most rain, and some of the strongest winds, as Douglas scooted by with 45 miles at one point. Fortunately the whole state was south of the heavy weather!
Be well…
Aloha, Glenn
-
July 27th, 2020 at 11:42 am
robie Says:good bye doug, time to put stuff back out, we were glad for the rain. thanks for the weather coverage this weekend glenn! robie
~~~ Hi Robie, indeed, bye bye Mr. Douglas, interesting to have you in our lives the last couple of weeks, at least for me, as I was tracking it from the time it formed offshore from Mexico.
You’re very welcome, it was my pleasure to share information about this robust hurricane with you…along with the rest of my interested readers!
Aloha, Glenn
-
July 26th, 2020 at 11:42 pm
Mike Says:Aloha Glenn,
Wind is picking up a bit here on Kauai and our power just went out. Not sure how much of the island is affected.~~~ Hi Mike, first of all thanks for letting us know what’s happening up on your island. Although, not good to hear that you’ve lost your power all ready, without Douglas even getting there yet. Hopefully it will be a short-lived outage, and your lights and electricity will come back on soon! Best of luck Mike!
Aloha, Glenn
-
July 26th, 2020 at 9:51 pm
Brad Says:Mahalo Glenn for keeping us all up to date on Hurricane Douglas. Your frequent updates where spot on and exactly what is needed when we face the kind of uncertainty a storm like this throws at us. I especially appreciated your comments around your nap, as these issues are on all our collective minds- and I enjoyed a well deserved nap as well. We can do so much more when we work together. These threats of natural disasters often bring out the best in us. I am choosing that future. Highly evident here on Molokai. Lucky live Hawaii!!! Aloha
~~~ Hi over there on Molokai, I totally agree, after living here in the Aloha State for going on 45 years…Lucky live Hawaii!
You are very welcome, it has been a lot of time on the computer these last several days, and especially this weekend. Although if the truth be told, I’ve greatly enjoyed the challenge of keeping my faithful readers in the know as best I could. It has been an edgy although exciting time I must admit, and am glad that the damage has been minimal thus far…as Douglas spins by Oahu and Kauai tonight.
The times are unsettled aren’t they, in terms of what’s happening around the world. I’m with you though, I’ll choose a positive and settled future if possible…hopefully sooner rather than later!
Aloha, Glenn
-
July 26th, 2020 at 7:27 pm
Paul Varley Says:Hi Glen
I read your Maui update almost every day, have done so for years. 2020 will be the first time in 8 years my wife Sue and I have not been fortunate enough to visit Maui. We have vacationed there 15 of the last 19 years. Covig has changed so may lives, for some it has been a life altering event, for Sue and I only the ability to travel to the place we love the best. We only have so many trips left in us so we hope 2021 will allow us to visit the most beautiful place on earth. Until then we read your daily scribe, imagine time spent in a magical place, and count the days until our next trip.
Keep up the great work.
Regards
Paul & Sue Varley~~~ Hello dear Paul and Sue, good to hear from you two, who love Maui so much! Happy to know that you are fans of this weather site as well, I love serving you on a daily basis…thanks for letting me know.
I truly hope that you will be able to come back here soon, like in 2021, I really do. I know how good it feels to come back after being away more than a few weeks.
Hurry back you guys!
Aloha, Glenn
-
July 26th, 2020 at 7:08 pm
Suzanne Says:Aloha Glenn,
Right now,3 pm Sunday, we are bewildered because there has been hardly any rain or wind up where we live near LAHAINA in Launiupoko. We were at least expecting the Devil winds that rip through our neighborhood at times. Why does the satellite and radar show RED over all of Maui as I type this? Is more coming to the west side later today or tonight or is it moving towards Oahu?Thanks for your expertise, Suzanne
~~~ Hi Suzanne, good to hear from you over there in Lahaina town. We’re all surprised that there was more wind in the central valley, and as you know sometimes with a north wind, Lahaina can get good windy too. I think the NWS is leaving the hurricane warning up over Maui County out of a desire to be cautious…even if things have mellowed out a lot from earlier. The hurricane does continue to move towards Oahu and Kauai, although it is still relatively close by, perhaps the NWS is still not sure if it will dip southward and cause unexpected trough for those western islands. I’m not too surprised that your area remained on the dry side, as there were no random thunderstorms, and I think the West Maui Mountains likely shielded the windward biased rain from coming over your way. At any rate, the forecast still calls for a 90% chance of rain, which could be locally heavy, through tonight. So despite the respite, not that you saw a lot over your way, we might get some more rain coming up on the southwest kona winds yet.
Aloha, Glenn
-
July 26th, 2020 at 6:27 pm
Helen Says:Thanks so much Glenn for your constant updates!!
Very helpful, informative and reassuring!~~~ Hi Helen, you’re very welcome, it was very interesting, still is actually…happy to keep the updates coming your way!
Aloha, Glenn
-
July 26th, 2020 at 6:19 pm
Keith Says:Glenn, not that any of us are complaining – but how do you explain the relatively minimal impact from a Cat 1 hurricane only approx 50 miles offshore, especially in Kula, where there has been an absence of downpours and less wind than in more routine, less notable storms? Shouldn’t the 90+mph winds along the front edge have swept across Central Maui and upcountry?
~~~ Hi Keith, that sounds like a fairly straight forward question, and one that I’d have a good answer on the tip of my tongue. However, I’m here wondering about that too. It was rather windy last night, and off and on through the morning hours, no doubt about it…trees were bent over here in Kula at times. However, I think the long and short of it was that we were on the less robust side of the storm, with the heavy stuff to the north and northeast of the center, as it moved along. So, we got some wind and rain, strong and heavy at a few times, although the overall dynamics kept us out of the most intense stuff…thank goodness.
Aloha, Glenn
-
July 26th, 2020 at 6:07 pm
Graham Smith Says:Hi Glen. Looks like we dodged a bullet with Douglas. Views from Windy.com during the storm consistently showed a band of less strong winds between Maui and the storm. Perhaps the mountainous topography of the island somehow kept the stronger winds at a distance? Any ideas?
~~~ Hi Graham, good to hear from you. I was watching that website some too, and as you point out, there was that green strip of lighter winds to the south of the hurricane’s path, as the strongest winds remained some 50 miles offshore to our northeast and east. Yes, the mountainous terrain helped shield us some, although as Keith was pointing out, why didn’t it funnel down through the central valley more? I was watching the winds at Maalaea Bay, to see if it was really windy down there, like it usually is with north winds blowing…although it wasn’t. So, there we have it, yet another situation in nature that leave us scratching our heads a little.
Aloha, Glenn
-
July 26th, 2020 at 6:05 pm
john Says:Aloha Glenn, thanks for all the links you provide + your insight. 35 yrs. in Haiku and this is the closest an eye has probably been. Less rain than a normal wet trade pattern, less wind too. I realize we were in the dry quadrant but the lack of wind is an oddity. Do you think the big island / haleakala wall cut off the fuel from the south west quadrant? It will probably get wetter here as Dougie passes.
~~~ Hi John, good to hear from you too. You’re very welcome, glad to share my information and perspectives. Indeed, as everyone is pointing out here, less rain and wind than there could have been, and even less than expected by all the experts in the field. Here in Kula this afternoon, the winds are coming up from the southwest, bringing clouds and fog our way. I’d say that you might not see much more rain, not that you got much. Likely the leeward sides from Makena around to Maalaea Bay and on around to Lahaina and Kaanapali would see most of the following precipitation…and perhaps in the upcountry areas on the leeward sides too.
Thanks for your good comment!
Aloha, Glenn
-
July 26th, 2020 at 5:47 pm
Gman Says:Aloha Glen, Thanks for all the storm info you posted so early. I think we all were very lucky today we never got any wind and we got 1.25 inches of rain counting last night here in Pauwela Haiku. The conditions are calm, overcast and nice and cool. Was it the wind shear that helped us? Thanks, Gman.
~~~ Hi Gman, good to hear from you, yet another good question as they all seem to be today, too good in some cases…chuckling to myself. It’s true that the wind shear aloft did kick in as the hurricane got into the area to our north and northeast, although it didn’t seem to take the steam out of the hurricanes sustained winds…despite seeing the flagging of the cloud field around the storm, being sheared to the north. That might have saved us some, although I think that there were a few other factors in play too. The topography of Haleakala and the West Maui Mountains, and the direction of the winds coming in, just work together in such a way that we tapped into the stronger winds just to the north…thank goodness. As it was, there were some good gusty winds around, although I haven’t heard of any damage at this point, thank goodness!
Aloha, Glenn
-
July 26th, 2020 at 4:44 pm
Jessie Says:Thank you Glen for all the updates! Keep safe up there! We missed the impact if the storm and hoping the islands will be okay.
~~~ Hi Jessie, it seems the worst of the weather is now passed Maui, or at least up here in Kula. We’re just having fog and light drizzle early this afternoon.
Thanks for checking in…
Aloha, Glenn
-
July 26th, 2020 at 2:57 pm
“Rudy” :) Says:Hey Mr. Can Do!
The Windy.com website sort of shows the eye staying about 100 miles offshore to the north… is that an accurate interpretation of that graphic there?
Mahalo my friend!! Stay safe in “The Tower!!”Peter/Rudy
~~~ Hey hey, my old buddy Rudy, howzit? Well, I’ve been looking at that site, along with about a million others today. Actually, the NWS is calling the center of Douglas 55 miles east-northeast of Kahului…at 11am this morning. The NWS is who I put my money with in these situations.
I’m not sure if you’re still in Keokea, or elsewhere, although you and the wife stay safe wherever you are!
Aloha, Glenn
-
July 26th, 2020 at 12:44 pm
brent r Larkin Says:Aloha Glenn,
Your site is my “go to” starting at 5am today, You
do a great job , and thank you ! Sirens going off here in Lahaina ! Appreciate your constant updates , we send your info to family in Cali, as they are concerned . Used yur surf report for many, many years as well !Thanks,Brent
~~~ Hi Brent, good to hear from you over there in Lahaina. I’m glad you’re finding value enough in my website, to make it your go to place for weather…thanks!
Hunker Down my friend…
Aloha, Glenn
-
July 26th, 2020 at 11:42 am
Mr. Rich Says:Aloha Glenn–
Considering all the anticipation of the last week, it’s odd to wake to completely dry surroundings today,
here in Kea’au makai, south of Hilo! Four days back
when everyone down here was wondering how it would be, a good friend
tossed off, “we’re not even going to notice it.” Darned
if she wasn’t spot-on..Best of Luck to Everyone Else !
Peace, RICH…~~~ Hi Mr. Rich, incredible, how close you are to the hurricane, and yet just far enough away, to be out of the rain shadow of the storm…at least so far.
Thanks for your well wishes, the rest of the state appreciates that!
Aloha, Glenn
-
July 26th, 2020 at 9:52 am
Leimomi Kekina Says:Aloha Glenn!
Mahalo for the updates!! Hope you doing well. Miss you, take care! Stay safe!!
Aloha,
Leimomi~~~ Hi Leimomi, good to hear from you old friend on the windward side of Oahu! You are very welcome of course, and I’m taking care up here in my Weather Tower in upper Kula. It’s getting blustery with passing showers early this Sunday morning. It’s one of those rare days when I have all my windows closed!
You take care as well!
Aloha, Glenn
-
July 26th, 2020 at 8:18 am
ML Boland Says:Good Morning Glenn,
Thanks for the very early morning update! Other early risers like me appreciate it!~~~ Hi ML, you’re very welcome, I’m with you…as part of the early morning risers club!
Aloha, Glenn
-
July 25th, 2020 at 7:39 pm
misha bowman Says:i live in haiku, hi. 96708 could you please tell me what is happening now……..i live alone and am anxious. thank ou…..misha
~~~ Hi Misha, I understand, here’s a link to the weather you can expect.
https://www.hawaiiweathertoday.com/maui.php?zone=HIZ020
I would suggest you secure any loose outside stuff, and remain hunkered in once the weather takes a downturn…likely Sunday morning.
If this doesn’t sound comfortable enough, you could call the police department and ask where there might be an evacuation center in Haiku or Paia…and then retreat there if need be. Best of luck.
Aloha, Glenn
-
July 25th, 2020 at 7:18 pm
Berney Says:Aloha Glenn,
Just FYI, your link to the Central Pacific Hurricane Center (https://www.prh.noaa.gov/cphc/) is broken. It should be:
https://www.nhc.noaa.gov/?cpacTake Care and stay safe!
Berney
~~~ Hi Berney, thanks! I just fixed that bad link, I appreciate your keen eye.
Aloha, Glenn
-
July 25th, 2020 at 6:25 pm
BP Says:Any update on your prediction on winds speeds for the north shore of high Oahu?
Thank you for your time
~~~ Hi Bryan, please check this out:
https://www.hawaiiweathertoday.com/oahu.php?zone=HIZ008
Aloha, Glenn
-
July 25th, 2020 at 2:10 pm
Robert Sutor Says:Hi Glen,
I’ve been following you since the 1980’s. Do you have an audio clip of the tune that was played at the introduction of your previous TV show. I really miss hearing that.Thank you and keep up the great work!
~~~ Hi Robert, good morning Robert, good to hear from you. Wow, all the way back into the 80’s! I loved that audio clip I used at the beginning of my live broadcast TV show way back then! I don’t have that for you, although now that you’ve reminded me of that song, it brings back such good memories…thanks!
Glad you are still following our weather here in the islands…along with many others of us.
Be well my friend…
Aloha, Glenn
-
July 24th, 2020 at 1:31 pm
Richard Thompson Says:Hi Glenn,
We live in Kula, like you. I’m wondering about the wind if Douglas stays on the current track and passes just north of Haleakala. What are the chances that when Douglas is close and the wind is just west of north that the air will back up against the mountain and the wind speed greatly magnified in Kula?
~~~ Hi Richard, good question. I’d be hard pressed to forecast the upcoming winds for Kula by Saturday night into Sunday, prompting folks to respond to my words in one way or another. Thus, perhaps it would just be wise to get things that could be blown around easily by potentially strong and gusty winds, secured. That’s the best I can say I’m afraid.
Best of luck,
Aloha, Glenn
-
July 24th, 2020 at 11:24 am
Peggy Reeve Says:To anyone interested in the white haze and air quality in general, the windy.com website is not just wind, but also air quality. The air quality index has several parts and you can see the track of the large dust from Africa still located east of the Americas (using either the aerosol or ppm2.5 overlay). You can see we are not the clearest place for either of those metrics. I added on the SO2 layer, and we are looking quite high even though we no longer have volcanic gases from the Big Island.
~~~ Hi Peggy, good to hear from you. Thanks for your air quality information. Looking down the mountain from here in upper Kula, into the central valley on Maui, I see pretty clear skies on this Friday morning.
Aloha, Glenn
-
July 23rd, 2020 at 2:21 pm
Richard Brock Says:Glenn, Aloha!
Seeing the tentative track of Hurricane Douglas brought to mind a short article I read sometime in the past regarding another (unnamed) hurricane that passed through the Alenuihaha Channel (from east to west) moving northwest along Maui’s western shoreline impacting Lahaina. It subsequently moved north to Oahu’s south shore impacting Honolulu. This hurricane occurred in 1821…..199 years ago!! I can’t find the article but it may have been in the Hawaiian Journal of History. The tentative track of Douglas gives me “chicken skin”!!! Richard
~~~ Hi Richard, good to hear from you about Douglas. On the one hand it’s exciting to see a category 3 hurricane churning the waters of the eastern Pacific, although on the other hand, not so exciting to see the potential path moving over parts of the eastern islands! Thanks for your interesting words about that unnamed storm way back when, that passed through the Alenuihaha Channel. There’s still some time for this storm to wiggle around in its path, and to gain or lose some strength too. I know you are watching, and I have my eyes peeled as well!
Take care…
Aloha, Glenn
-
July 23rd, 2020 at 12:19 pm
Dod John Says:Glen..Saw the comet last night just where Tom Worthington said! Two dipper lengths to the left of the bottom of the Big Dipper. Just as the moon was setting over west Maui. Best seen with binocs. I’m pretty sure I saw what I saw! Any comments? Doc John
~~~ Hi Dr. John, good to hear from you again. I’ve seen it twice in the last week, when there weren’t any clouds blocking my view. I saw it about an hour or less after sunset both times to the northwest, and at best it was faint…although definitely the comet with its tail. I could barely see it without my weak binoculars, which didn’t help much, but just enough to be thrilling!
Aloha, Glenn
-
July 21st, 2020 at 11:01 am
Joanne Vasquez Says:Could the haze yesterday be ash blown up the fire swirling around?
~~~ Hi Joanne, your guess is as good as mine…thanks for chiming in.
Aloha, Glenn
-
July 20th, 2020 at 9:43 pm
Karl Rohlfing Says:Hi Glen, what’s this white haze that is everywhere today? I’m in Haiku and can barely see the horizon. I drove to town and it’s everywhere. Is it possibly Sahara dust?
~~~ Hi Karl, that’s a good question! I’m seeing that stuff too, down in the central valley from up here in Kula. I hadn’t thought of Sahara dust actually, I was thinking more in terms of dust from the gusty trade winds. However, I honestly don’t know the source, although I totally agree, it’s definitely not good visibility!
If anyone else wants to hazard a comment about this, please do.
Aloha, Glenn
-
July 18th, 2020 at 9:45 am
Tom Worthington Says:Aloha Glenn,
We drove up to close to the Haleakala Park entrance to see Comet Neowise last night. There are some pull off’s just before the band of pines before the park entrance at about 6500 feet that provide a good view to the northwest. Despite a lot of low clouds and some higher cirrus cloud bands the comet became visible about an hour after sunset. Very clearly a comet with binoculars, just barely visible to the naked eye. It helps to know where to look. Last night it was below and just to the left the Big Dipper, about “2 dipper widths” below the bottom of the dipper. Bring lots of warm clothes!
~~~ Hi Tom, thanks very much for sharing your successful comet viewing experience with us! I’ve looked a couple of times from here in upper Kula, although haven’t spotted it yet. I have a pair binoculars, although they weren’t strong enough, or I just didn’t know exactly where to look. I’m glad you got to view this spectacle!Aloha, Glenn
-
July 14th, 2020 at 11:55 pm
Helen Says:Happy Birthday Glenn! Hope you had a wonderful day! 🙂
~~~ Hi Helen, good to hear from you again, and yes, it was a fine day, with just the right amount leisure time, and just the right amount of weather work.
Thanks for your Happy Birthday wishes!
Aloha, Glenn
-
July 14th, 2020 at 6:46 pm
mary Says:Glenn
when i wished you a happy day yesterday, i forgot to also send congratulations and greetings to your Mom who did all of the work. I know you cannot be with her but she did a good job and should be proud of you.~~~ Hi again Mary, thanks again for your HB well wishes. Indeed, my Mom did a good job in raising me, along with the other three siblings in our James Family. It’s true I can’t be with her in California, thus I’m staying here at home on Maui. I speak with her on the phone everyday…she sang Happy Birthday to me today!
Aloha, Glenn
-
July 14th, 2020 at 11:52 am
Fred Staff Says:HBD Glenn.
Thanks for the great website.~~~ Hi Fred, I appreciate your BD well wishes, and for your positive response to my website!
Aloha, Glenn
-
July 13th, 2020 at 8:31 pm
maggie Says:Aloha Glenn. I’ve been anxious to see comet Neowise appear in upcoming evenings, but the latest round of cirrus clouds obstructs objects close to the horizon. Any outlook for the wispy cloud cover to diminish over the next few days?
~~~ Hi Maggie, good to hear from you again. They may slip south of the state with time, although likely not today, unless you live on Kauai…and I know you live here on Maui. Keep checking that looping satellite image.
Good luck, Glenn
-
July 13th, 2020 at 7:00 pm
Douglas MacDougal Says:Aloha Glenn
Its the 14th July down here (Sydney) so happy birthday from the future!
Stay well
Douglas~~~ Hi Douglas, chuckles, my birthday has already arrived in Australia, wonderful…thanks for your well wishes and for letting me know…it’s happening already!
Thanks!
Aloha, Glenn
-
July 13th, 2020 at 1:45 pm
robie Says:hi glenn, i regularly looking at the color satellite photo of hawaii, and trying to learn to identify the cloud types on the image. so, is it the lighter wispy clouds that are the cirrus clouds and the denser whiter clouds that are the cumulus? thanks, happy birthday month, robie
~~~ Hi Robie, as for the question about clouds, the brighter white clouds are the high cirrus, and the less bright more compacted clouds are the lower cumulus and stratocumulus clouds. The high stuff usually moves from west to east (left to right)…while the lower clouds are usually carried by the trade winds from east to west (right to left). Good question!
Thanks for your birthday wishes too!
Aloha, Glenn
-
July 13th, 2020 at 10:25 am
Mary Says:Glenn
Good wishes and good health for your birthday
~~~ Hi Mary, my actual birthday is tomorrow, although I’m happy to receive your well wishes a day early! 🙂Aloha, Glenn
-
July 11th, 2020 at 1:39 pm
Jerry Says:Here is some info for finding Comet Neowise (great name btw)
https://earthsky.org/space/how-to-see-comet-c2020-f3-neowise~~~ Hi Jerry, thanks for the info, and I’ll be checking this great comet out Sunday morning. My friend Ratkowski also sent me a picture of the comet that he took this morning atop the Haleakala Crater.
Aloha, Glenn
-
July 9th, 2020 at 8:29 pm
Berney Says:Aloha Glenn,
You have a bad link under the GEOS-17 color still image. The Looping version should be:
~~~ Hi Berney, the best on the planet!? Wow, fabulous positive feedback…thanks!
Thanks for pointing out that bad link as well, I fixed it.
Aloha, Glenn
Keep up the best website on weather on the planet!!!
Mahalo,
Berney
-
July 8th, 2020 at 10:30 am
Jill Says:Yes..more days like yesterday!…hopefully the thick heavy, cool cloud hanging over upper Kula will be kept away by the trade winds. The new Total Surface Precipitation model is also a joy…being able to slow it down is helpful in seeing and getting a real sense of what the next week will be like…at least precipitation wise. mahalo for your site.
~~~ Hi Jill, I’m happy to know that you’re still pleased with this website. As for those afternoon clouds here in upper Kula, indeed, they were definitely missing yesterday! It’s not easy to know ahead of time, whether these afternoon clouds will block the sun on any particular day…or not. We’ll see what happens today.
Aloha, Glenn
-
July 1st, 2020 at 4:13 pm
robie Says:yes, those clouds,
they looked wispy, like cirrus. but i guess not. what are they then? beautiful image what ever they are. thanks, robie~~~ Hi again Robie, they do look wispy, although they happen to be lower level cumulus and stratocumulus clouds. I really like this new satellite image I found…glad you do too!
Aloha, Glenn
-
July 1st, 2020 at 2:28 pm
robie Says:hey glenn, beautiful satellite photo of the cirrus clouds over the island chain. thanks robie
~~~ Hi Robie, you’re welcome, although the only few cirrus I see at the moment, are just a few northwest of Kauai.https://cdn.star.nesdis.noaa.gov/GOES17/ABI/SECTOR/hi/GEOCOLOR/1200×1200.jpg
Are you referring to the lower level clouds in this satellite image?
Aloha, Glenn
-
June 27th, 2020 at 2:18 pm
Lou Says:Aloha Glenn,
Mahalo to Jerry for the great wind site! And to Bobby from Boston, Kula at 3000′ is absolute Heaven! Cool nights warm, mostly dry, days and calm to light wind.
Cheers,
Lou~~~ Hi Lou, I’m in agreement, 3,000+ elevation is pretty darn nice most of the time!
Aloha, Glenn
-
June 26th, 2020 at 7:32 pm
Eliza Says:Aloha Glenn – greetings from scorching Pukalani. I know it can be worse. Egads, this is coming in on the southern winds.
Yesterday we had extremely brief sprinkles. They were large enough for me to hear them tap on the trees. But nothing more. Drought is here. 🙁
Will we get any moisture in our wind streams from the disturbances east of us? That would be lovely to experience.
Have a peaceful weekend.
Eliza~~~ Hi again Eliza, good to hear from you down there in Pukalani. Ouch, the summer heat is here, even in the upcountry areas, not to mention the recent record breaking/tying heat down at the airport in Kahului.
Showers? Hmmm, I don’t see much on the horizon I’m afraid. Of course we know that May and June are typically the driest months of the year here in Hawaii…at least in most places.
Hang in there Eliza, and you have a nice weekend too.
Aloha, Glenn
-
June 26th, 2020 at 11:59 am
Jeff McConnel Says:Aloha Glenn,
We live on the Western Slopes of Mauna Loa at an elevation of 4,000′. We have experienced afternoon and nighttime showers nearly every day for months on end. Several of the old time ranchers have repeated the adage that when the volcano erupts that draught conditions often occur here. Since the latest eruption stopped there has been a marked increase in moisture up here, as a matter of fact we never had our normal winter draught conditions this year, October to March. Do you know of any science behind the volcano/draught conditions theory? Possibly clearer skies leading to more heating of the land and thus bringing in moist air from the ocean to the upper slopes.
Thanks for your thoughts on this and always thanks to your great weather page.
Aloha Jeff
~~~ Hi Jeff, good to hear from you again. 4,000 feet on the Big Island…must be an interesting place to live, nice and cool and often afternoon clouds. Sounds like those clouds have been keep you wet, almost sounds like a windward area, with rain everyday an all.
You know, I don’t have a theory myself, nor do I know of any other theories about the increased moisture, now that the vents have shut down.
Your analysis sounds good to me though, I’d go with that one. With sunny skies heating the slopes up, then the sea breezes kick in, carrying moisture upslope from the ocean, and bingo…those clouds let loose with some showers later in the day.
Thanks for your interesting comment Jeff.
Aloha, Glenn
-
June 24th, 2020 at 10:54 pm
jerry Says:Hi Glenn. We paddlers have been using soest for our marine wind forecasts and it has been very accurate for predicting downwinding.
http://www.soest.hawaii.edu/MET/Faculty/wrf/arw/arw_maui_loop_10mw.html
~~~ Hi Jerry, thanks for passing this link along to all of the rest of us!
Aloha, Glenn
-
June 24th, 2020 at 6:46 pm
Bobby Keigan Says:Enjoy all the info but I would like to ask where we could find the most moderate temps on the Islands. My wife is severely disabled with MS and heat is more damaging for her than our New England winters. A daily diet in the 80s won’t work, your night time temps in the 70s would be perfect.
Does Kula have the elevation to keep it in a range where she could exist?? And to be honest, with my Boston accent I like saying – It’s coolah in Kula.
New to your site but it has the kind of info I’m interested in. Any suggestions would be appreciated.
Mahalo~~~ Hi Bobby, I can appreciate your question. Personally, I prefer cooler temperatures, and thus I live in an upcountry area here on Maui. There are other areas that have cloud cover during the afternoons, which helps keep the temperature down…in contrast to our sunny beaches.
I don’t know if you are planning on moving here, or just for a short vacation. Nonetheless, you need to look for places above 3,000 in general, although these areas are rather limited. At least this will give you a start.
At the moment, here in upper Kula, at 3pm Wednesday, the air temperature is 68.9 degrees. In contrast, at the same time it was 88 degrees down in Kahului.
I should add that places on the windward sides can be cooler too, such as Hilo on the Big Island, although for the coolest, you have to go up in elevation here in Hawaii. Hawaii may not be the best place for your wife, as we have to remember we’re in the tropics.
Best luck!
Aloha, Glenn
-
June 24th, 2020 at 1:32 pm
Lou Says:Aloha Glenn,
Do you know of a better or more local forecasting site for boating conditions around Maui County? I have been using the NWS marine weather site but is often seems like the conditions we experience often times don’t match the forecast.
Mahalo,
Lou~~~ Hi Lou, good question, although unfortunately I don’t know any better source of local wind conditions in our marine environment. I trust the NWS, although it’s tough to get it right all the time, especially with all the various factors dealing with terrain around the islands…not to mention all the various micro wind directions.
Best of luck!
Aloha, Glenn
-
June 16th, 2020 at 4:44 pm
Michael Says:Aloha Glenn,
Just found your site for the first time today and glad I did…
Looks like the best summary for the islands that I’ve seen.Will bookmark and visit often from now on. I live in ‘medium’ Haiku about 1200 ft, just off Ulumalu Rd, up from Jaws Cafe/Store on Hana Hwy.
Mahalo for your communications,
Michael~~~ Hi Michael, glad you finally found me, my website. Glad you like it, welcome aboard!
I know your area well, lived over on that side for many, many years back in the day, actually on East Kuiaha. I’m up in Kula now, and find it agreeable…with the cool temperatures and nice views.
At any rate, I’ll be updating this site several times a day, to say the least, for you and all the other regular visitors.
Aloha, Glenn
-
June 10th, 2020 at 11:15 pm
Dennis Says:Will those high cirrus clouds moving in from the West bring rain to the leeward side? It sure looks like they are full of moisture.
~~~ Hi Dennis, no, they are ice crystal clouds way up high, and don’t produce rain. The leeward sides will remain generally dry, with a few exceptions here and there at times.
Aloha, Glenn
-
June 10th, 2020 at 5:24 pm
maggie Says:Aloha Glenn:
I noticed that Kahului is, once again, setting records. I know there have been discussions about the Kahului meter, so I pulled historical records and looked at the spread between daily highs at both Kahului and Kapalua since 2010. Graphing the spread shows a clear shift in 2019, with the daily high for Kahalui running about a 1 degree hotter vs Kapalua than in the past. Interestingly, the spread in daily lows falls within historical norms. So,something has happened to the OGG meter that boosts daytime high temperatures but it is not a faulty meter, since it only affects daytime temps. Perhaps a new nearby structure is blocking cooling winds, or the sensor has been subtly exposed to more direct sunlight? Either way, the “new highs” from the Kahului meter might be viewed with a tinge of skepticism and a quick adjustment would to subtract a degree, or so. I find similar results from other locations (Hana, etc). Am happy to share the data and charts if you’re interested. Aloha.~~~ Hi Maggie, very interesting stuff, well done exploring of the data. I take your word for the findings, so no need to see the data and charts…although thanks.
It will be interesting to see how many records are tied or broken this summer. I’ll monitor, and when the records are reached, I’ll make note of it on this narrative page.
Thanks Maggie!
Aloha, Glenn
-
June 10th, 2020 at 11:11 am
james williams Says:Why is the quality of the Haleakala Web Cam picture so
Poor? I keep thinking, Surely it will be fixed. It has
bad for Years now. Whats up with That?
~~~ Hi James, its so true, and why you ask…I haven’t a clue!Aloha, Glenn
-
June 7th, 2020 at 7:53 pm
Helen Says:Hau’oli la hanau to your mom !! Thanks for letting us know.
~~~ Hi Helen, thanks very much, I’ll pass your well wishes along to my Mom.
Aloha, Glenn
-
June 7th, 2020 at 9:50 am
JIll Painter Says:Hau’oil La Hanau to your Mom!!. What a remarkable milestone. Is she still your editor, as you mentioned once? Mahalo for the Nodosaur article…fascinating and so good to add a few neurons everyday.
~~~ Hi Jill, indeed, my Mom is an amazing woman! No, she was proof reading some parts of my narrative page at one point, although now she is in a home care facility in Long Beach. Unfortunately, even if I was there, I couldn’t visit her.
Glad you continue to enjoy reading my interesting articles.Be well, Aloha…Glenn
-
June 4th, 2020 at 3:11 pm
Dwight Says:Hi Glenn,
Let me start as always by saying how much I appreciate your site. There is no better site for our area, yours is the best. I also look forward to your FYI posts at the bottom, they are well curated.
Noticing your last posted comment about another record setting hot season for us it looks like we are already setting records here in late spring. Of course for us even more concern is the water temps since they are the main cyclone engine or fuel. I know they are predicting a moderate storm season here in the central pacific but it’s never the number as much as the track of an individual storm.
I pray and enjoin others to follow in holding us safely through this storm season. May the storms we have veer away keeping us harmless, I maintain that vision.
Aloha Dwight
~~~ Hi Dwight, what a well written comment, truly. Thanks for your positive comment on my presentation of this site too.
I’m with you concerning the current hurricane season here in the central Pacific, let’s hope that any storms that form in this basin, or in the eastern Pacific too…don’t blow through Hawaii.
We like to see them veer away, keeping the high winds and flooding rain away from us. There’s always the threat of high surf impacting our coasts however…even if they don’t strike us directly.
As you point out, we are expecting a normal or somewhat less than normal season, in terms of number of hurricanes. Although, also as you mention, it’s not how many, it’s the individual track that any individual storm eventually takes.
Be well Dwight!
Aloha, Glenn
-
June 4th, 2020 at 1:20 pm
Steven H Says:Hey Glenn;
I’ve been a fan of your forecasts for years. Thanks for the good work.
We live in west Haiku, (not the jungle).
My wife and I have been wondering about your rain predictions. Your percentages seem to be a bit higher than the usual suspects, for example the seven day forecast from NWS.
Any thoughts?
SH~~~ Hi Steven, good to hear from you from Haiku, my old stomping grounds before I moved up to Kula. Thanks for being a fan, I appreciate that!
In terms of your question about rainfall forecasts and their percentages on my site, compared to other sites…I just checked around, and found that my forecasts are similar to the NWS rainfall forecast.
Thus, I’m not sure where you are looking on their site, finding information that differs substantially from my percentages.
Please point me to where you are looking, and I’ll check that out.
Best wishes to you and your wife!
Aloha, Glenn
-
May 27th, 2020 at 4:50 pm
Frank Says:Forgive me if you’ve already covered this topic. What is your opinion of some forecasting abnormally hot Summer here in the State.
~~~ Hi Frank, I honestly don’t know if this summer will set new records, although I’d expect it to be definitely hot…given the fact that last year (2019) had the hottest summer on record.
Aloha, Glenn
-
May 26th, 2020 at 12:49 pm
robie Says:hi glenn, looking at your weather maps and noticing the upper level wind veering from the itcz all the way up to us. is that what i’m seeing? how often does that happen? also thanks for the weather report from the western atlantic, i keep my boat in florida. robie
~~~ Hi Robie, yes, we can see the high clouds riding these upper level winds straight up from the deeper tropics. It’s a bit unusual I’d say, more typically they come up from the southwest or from the west aloft.
You’re welcome, I’ll be posting whatever tropical activity is happening, in terms of cyclones, through November 30th. Good luck with your boat this summer/fall. The Atlantic is expecting a pretty active hurricane season this time around.
Be well…
Aloha, Glenn
-
May 26th, 2020 at 11:46 am
Jill Says:Verrry interesting..like the ‘olelo Hawai’i on your site! And the weather..different today in Kula with less rain?
~~~ Hi Jill, it appears that the trade winds may already be trying to make an appearance, a bit earlier than expected. If this is so, I’d expect somewhat fewer showers this afternoon, than we saw yesterday here in Kula.
Aloha, Glenn
-
May 25th, 2020 at 3:36 pm
Eliza Says:Aloha Glenn –
Mahalo no for your service, both in Vietnam and to us weather geeks.
Would you happen to have the data for the Lahaina noon times for Maui? I noticed it is tomorrow on O’ahu, where the sculpture on the island will be a perfect circle at noon. Sorry if I missed it if you shared it another day.From the post I saw -> From Nānā I Ke Kumu:
“Kau ka lā i ka lolo, a ho’i ke aka i ke kino” — phrase designating high noon; the time when “the sun is directly overhead and the shadow retreats into the body,” or, more literally, “rests the strong sun on the brain, and retreats the shadow into the body.”
At the time of the meeting between morning and afternoon, no shadow could be seen. Man’s own mysterious aka (shadow) neither followed nor preceded him nor paced at his side. Instead, it retreated into the body, directly into the brain, near the very region of the spirit pit (tear duct of the eye) through which one’s own living spirit might exit and return in the wanderings of dreams, in the topmost part of the po’o, sacred to the ‘aumākua. What we call high noon was thought to be a time of great mana.
This was a time for the most sacred rituals in order to benefit from this fleeting time of bounteous mana!
Thanks again, Glenn. Peace and well-being to all of us.
Eliza~~~ Hi Eliza, good to hear from you again. Good question, and thanks for the background information too. From what I could dig up, it appears that the Lahaina Noon during May already happened on the 23rd and 24th.
Kahului (Maui): 12:22 PM (May 23 + 24) and 2:32 PM (July 17+18th)
I’m sorry you missed it by such a short time!
Thanks for your appreciation of my service and the weather work I now do.
Be well, Aloha, Glenn
-
May 15th, 2020 at 3:52 pm
Jed Smith Says:Aloha Glen. The webcam at Haleakala looks like an easy fix. The host just needs to change the camera. I think maybe the National Park just needs to be reminded that it is a valued resource, not only for them but many interested parties. Can you write an email to them? I think a request from you might carry more weight, since I heard other people have asked already. Maybe they can change it so it works while there are no tourists.
~~~ Hi Jed, good to hear from you. Just now looking at the webcam view, and it’s better than it has been it seems. Indeed, there’s some issues with the camera lens apparently. I don’t know if my writing would have any bearing, although if you provide the correct email address, I’ll write a short note asking if there can be something done to improve that webcam’s great view of the Haleakala Crater.Let’s hope for the best…
Aloha, Glenn
-
May 13th, 2020 at 11:27 pm
Suzanne Says:Aloha Glen….it’s the boat lady again…We are going to tow our boat over to Kihei boat ramp tomorrow, Thursday, and go over to Molokini. Do you think it will be sunny with light wind, or cloudy? Your predictions have been very accurate! Mahalo., Suzanne
~~~ Hi Suzanne, I’m expecting generally light winds, although they could be stronger in some locations over the nearshore waters today (Thursday). As for sunshine, I would look for sunny skies in the morning, and perhaps later in the day too…although clouds will be forming over the islands as the daytime onshore sea breezes kick in.
Best of luck in your sailing adventure!
Aloha, Glenn
-
May 13th, 2020 at 9:31 pm
Lou Says:Aloha Glenn,
It’s been raining steadily for about the last two hours down here at the house. Straight down not a lick of breeze, I believe a cloud is stuck right above us. We are right near Morihara Store.
Cheers,
Lou~~~ Hi Lou, good to hear from you. Yes, that same cloud is stuck over my place here in Upper Kula, just like yesterday afternoon. Not hard, although steady, and straight down as you mention…with our light wind pattern. I’d expect the same thing on Thursday.
Aloha, Glenn
-
May 10th, 2020 at 4:31 pm
Helen Says:Happy Mother’s Day to your mom!!
~~~ Hi Helen, how nice of you…I’ll tell her you spoke of her, thank you!
Aloha, Glenn
-
May 10th, 2020 at 9:57 am
mary Says:Glenn
Sending Happy Mother’s Day greetings to your Mom. I am sure she is proud of you and your work with this website.Mahalo!
~~~ Hi Mary, thank you so much…indeed, she has always been my biggest fan!
Aloha, Glenn
-
May 5th, 2020 at 5:09 pm
Douglas MacDougal Says:Hi Glenn
At what altitude is your Weather Tower? Those early morning temperatures are often some 20 to 25 degrees cooler than the lowest daily reported temperatures at Kahului Airport at sea level. As always your site provides food for thought every day.
Aloha
Douglas~~~ Hi Douglas, where I live is at approximately 3,300 feet in elevation. Kahului is at sea level, more or less as you mention. The trade winds bring air from over the warm ocean, typically between say 76-79 degrees or a little more in summer and fall.
Here in upper Kula, in the lee of the Haleakala Crater, we don’t get the exposure of the relatively warm trade winds. It’s often cloudy at the airport, which also helps to trap the heat from escaping out into space. Where in contrast, Kula is often clear at night, and the warmth of the daytime heating readily escapes.
In addition, the air up the mountain from here is cool or even cold, and colder air is more dense, and under the influence of gravity, flows downhill at night into the early morning hours. This is part of that offshore flowing land breeze that you read about here.
So, it’s not unusual for the temperature to be 20-25 degrees cooler up here, than down near sea level by the early morning hours before sunrise…especially when the eastern trade winds are blowing.
Good question, I hope that helps your understanding.
Aloha, Glenn
-
May 1st, 2020 at 11:21 pm
Brad Smith Says:Hi Glen, love your site. Check it daily from Windward Molokai. Would you like any ground truths? Or is it too hard to tweak the algorithms. It has been overcast with quite a bit of rain for the last few hours, say 4-7 PM, with no clearing in sight. Cannot see Maui
All the best. Unbelievable about that hail!
Aloha.~~~ Hi Brad, good to hear from you over on the windward side of Molokai. Sure, I’m always open to ground truths from around the state. Indeed, that huge hail stone is really something else!
Probably the best way to send me observations from the different parts of the islands is through email. My address is at the bottom of all the pages on my website.
Very glad to hear that you appreciate my site, thanks for letting me know!
Aloha, Glenn
-
May 1st, 2020 at 4:54 pm
Douglas Says:Aloha Glen
Absolutely love your upper Kula insights. We are in self isolation here in Sydney unable to travel by the wonderful Hawaiian airlines to our home in Kapalua. When I first visited your weather website so many years ago, I was quite enamored by your sometimes poetic descriptions of the daily changes observed from your home. Thank you Glen, you bring a smile to so many people.
Mahalo
Douglas~~~ Hi Douglas, and I in turn absolutely love that you love my daily musings about our weather…and sometimes other things.
Sorry to hear that you are “stuck down there in Sydney”, and can’t fly back to your other place here in West Maui. I trust that before too long, we can all begin to travel again…that will be a great turn of events.
Best of luck to you and yours Douglas!
Aloha, Glenn
-
May 1st, 2020 at 1:48 pm
robie Says:wow, i like the new animated surface pressure, moisture chart link you’ve added thanks robie
~~~ Hi Robie, thanks for letting me know…I like it too.
Aloha, Glenn
 Email Glenn James:
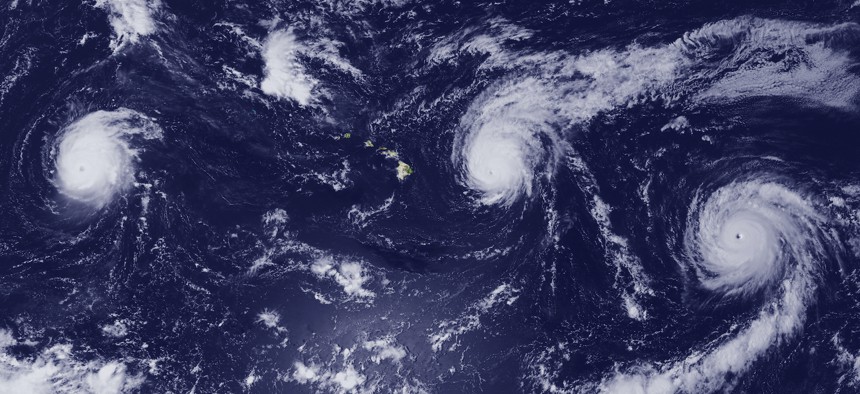
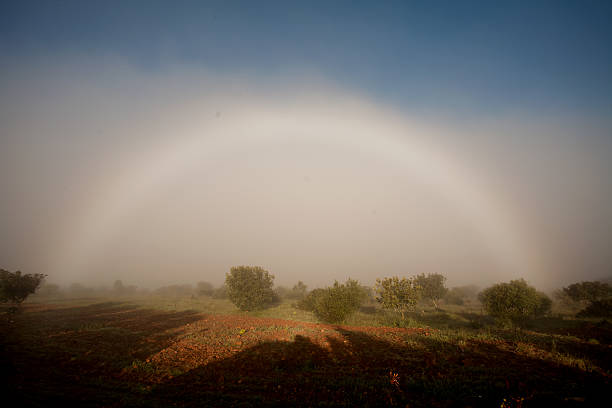
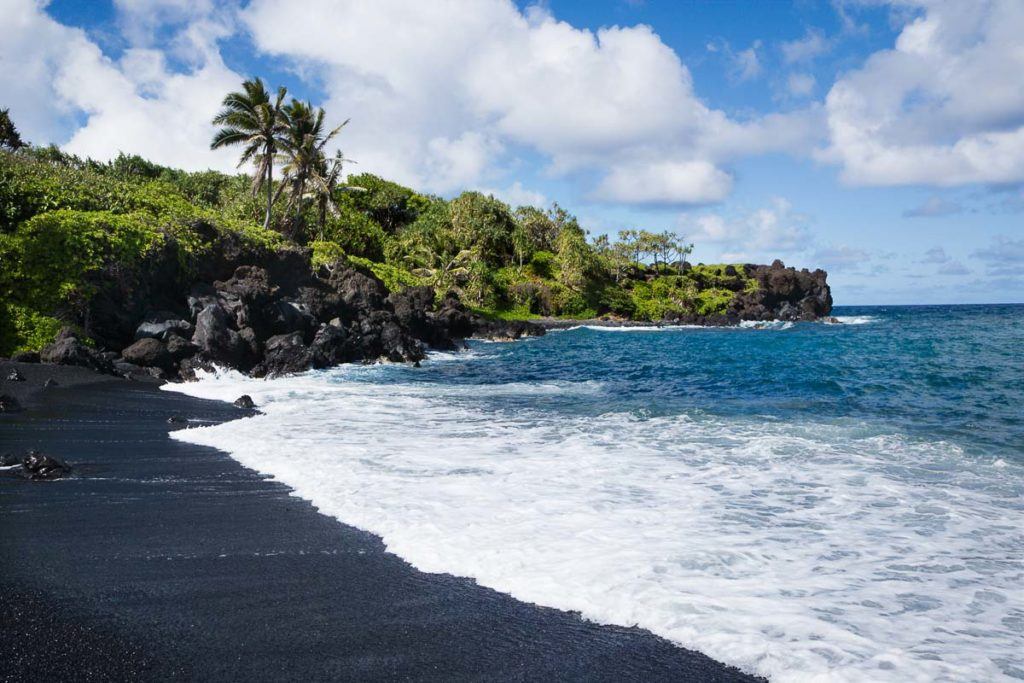

David Hume Says:
Aloha Glenn, you asked for observations. For the last three years I have complained about the extraordinary amount of rain we have been getting in Holualoa, Kona side of the Big Island. I have lived here for forty-five years, 2023,24 and 25 were the wettest years ever, the coffee farmers said the same. And then earlier this year we had the Kona Low storm. I doubt its connected but since then we have had lovely blue skies, sunshine, a little cloud in the afternoon and maybe a shower in the evening. It is now exactly as it was in the early eighties when I first arrived The only coincidence? There was a huge Kona Low storm the days before I arrived. David.
>>> Hi David, thanks for the long term overview!
Talk about a coincidence, yours sure is!!!
Aloha, Glenn
Gary Elster Says:
Glenn thanks for all you do. Have been tuning in for years from the time you were on TV. Here is a factoid from Wailuku Heights, Maui and our weather station. Last year’s rainfall total was 8.55 inches. This year ending tomorrow was 60.00 inches of which we received 21 inches in 30 hours during the 2nd Kona storm.
>>> Hi Gary, we go way back together! Wow, 8.55″ compared to 60.00″…incredible! 21.00″ in 30 hours…under a virtual waterfall!
Please write anytime about your Wailuku Heights weather stuff.
Aloha, Glenn
p.s. this goes for any of you readers
BB Says:
Haleakala Web Cam is back up
>>> Hi BB, thanks for the heads up, I’ve added the link again…
Aloha, Glenn
Jill Painter Says:
Following on David’s question about ridges which I really appreciate your answer to. I would like to understand about the temperature inversion heights. What is the difference between like four and 5000 and then seven and 8000 feet of temperature inversion and exactly what is the temperature inversion?
>>> Hi Jill, good question, and as an answer I’m going to make it as simple as possible. An inversion or temperature inversion is a when a layer of warmer air overlies cooler air. Normally, air temperature gradually decreases as altitude increases, although this relationship is reversed in an inversion. When the inversion is low it caps vertical growth of clouds, and when it’s higher, clouds and grow taller.
I hope that helps Jill…
Aloha, Glenn
David on Kauai Says:
Aloha Glenn, Thank you for all your hard work to keep us informed and safe! You truly are a gift to us out here in the middle of the Pacific. You mentioned that a “ridge” was keeping Nolo to the south of us. Would you please explain what a ridge is and how it works? Mahalo!!
>>> Hi David, good question. And BTW, you’re very welcome, I love keeping not only myself informed with what’s going on with the weather, but all my many readers…like yourself.
A ridge: We have high pressure centers, and from the peaks of these high’s (think of the center of a high pressure system as a mountain), we find elongated zones of high pressure extending from the mountains…which are called ridges…just like a ridge coming off a tall mountain. Under these ridges we find subsiding air, prompting stable atmospheric conditions…and often fair weather. Just the opposite are Troughs, which run from the center of low pressure systems…often bringing ascending air, unstable conditions, and often clouds with some sort of precipitation.
When we have a high pressure ridge to our north, it can block a cold front for instance from coming into our island chain. Ridges can block approaching weather systems, and can also block approaching tropical systems from moving north into the state.
I hope this over simplified explanation is helpful.
Aloha, Glenn