


Air Temperatures – The following maximum temperatures (F) were recorded across the state of Hawaii Thursday…along with the minimums Thursday:
82 – 69 Lihue, Kauai
81 – 69 Honolulu, Oahu
81 – 70 Molokai AP
85 – 71 Kahului, Maui
84 – 72 Kona Intl AP, Hawaii
82 – 67 Hilo, Hawaii
Here are the latest 24-hour precipitation totals (inches) for each of the islands, as of Thursday evening:
0.91 Kilohana, Kauai
0.73 Nuuanu Upper, Oahu
0.21 Puu Alii, Molokai
0.00 Lanai
0.00 Kahoolawe
2.18 Puu Kukui, Maui
2.30 Saddle Quarry, Big Island
The following numbers represent the strongest wind gusts (mph)…as of early Thursday evening:
32 Port Allen, Kauai – NE
39 Kuaokala, Oahu – NE
30 Molokai – NE
35 Lanai – NE
35 Kahoolawe – NE
31 Kapalua, Maui – NE
36 Pali 2, Big Island – NNE
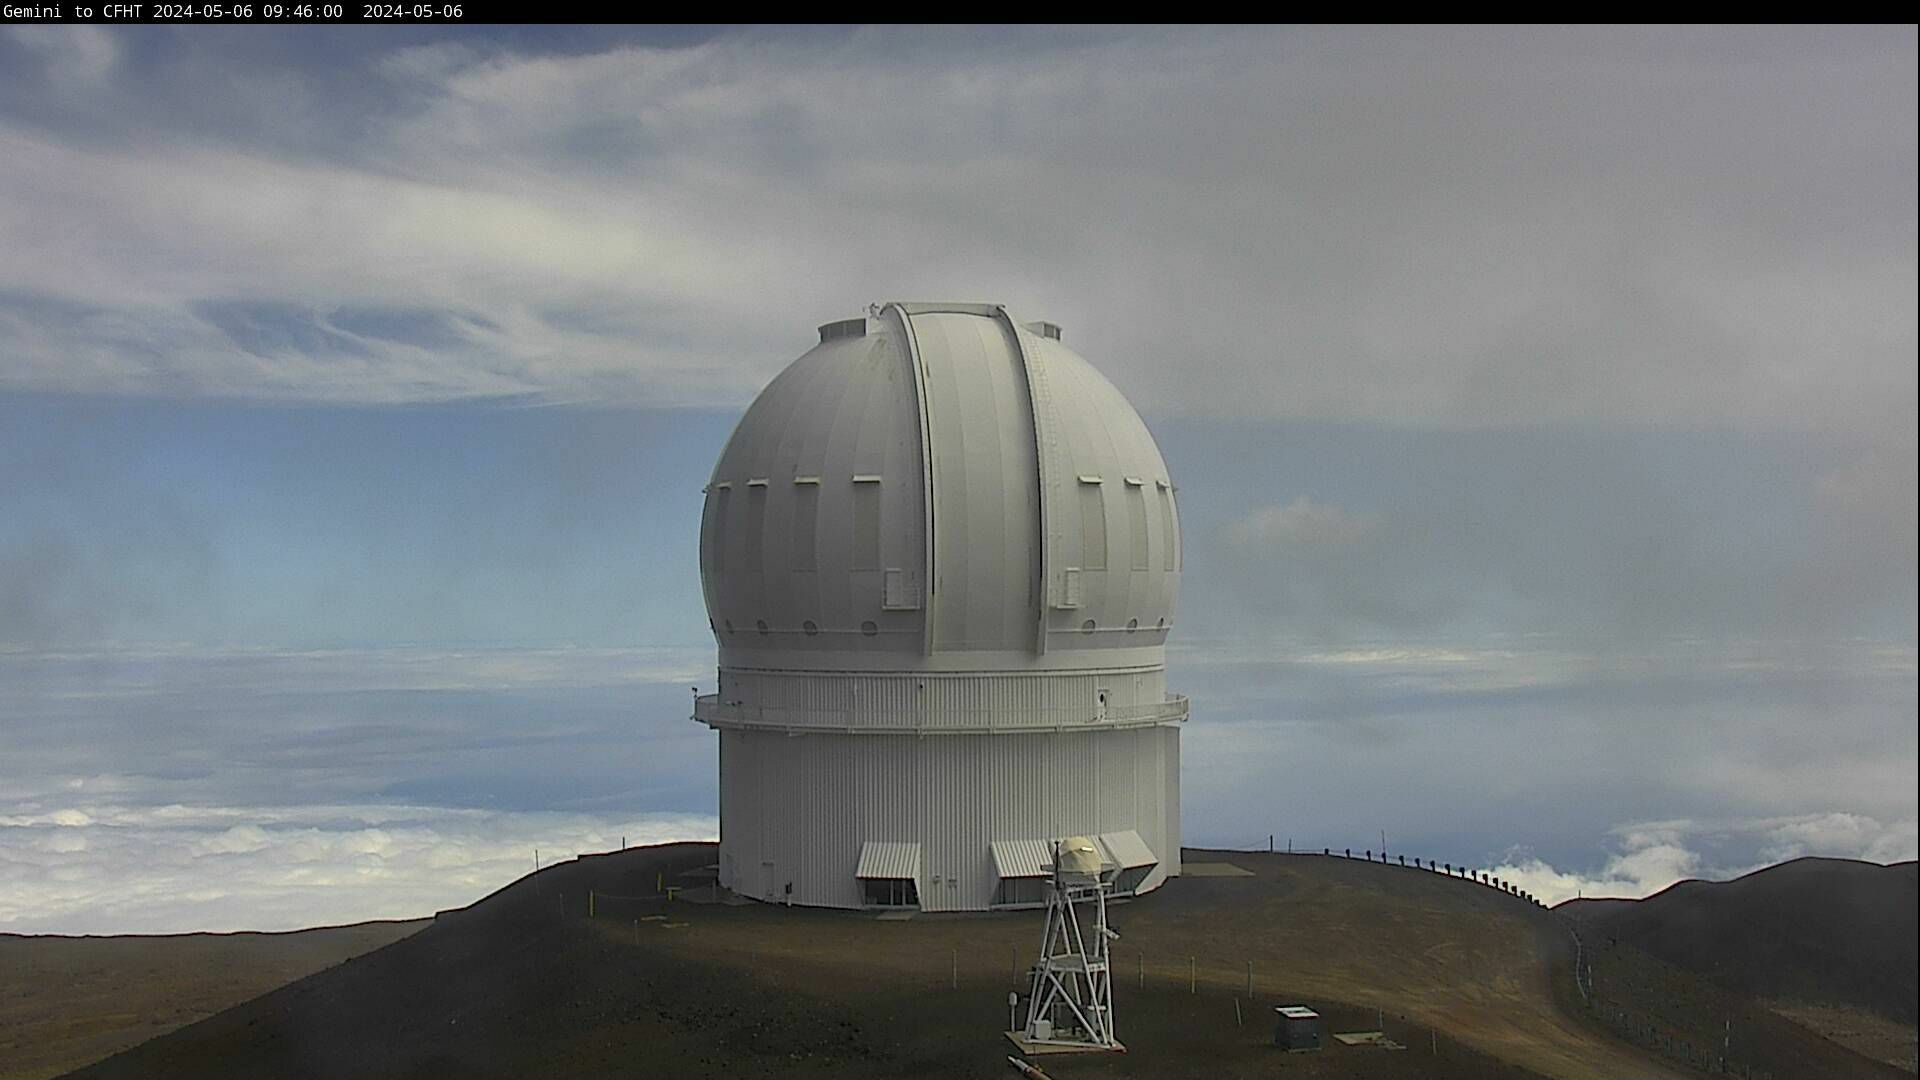
Hawaii’s Mountains – Here’s a link to the live web cam on the summit of near 13,800 foot Mauna Kea on the Big Island of Hawaii. This web cam is available during the daylight hours here in the islands…and when there’s a big moon shining down during the night at times. Plus, during the nights you will be able to see stars, and the sunrise and sunset too… depending upon weather conditions.
Aloha Paragraphs

High cirrus clouds south…band of showers impacting
the windward sides tonight into Friday

Cirrus clouds south of the Big Island…along with a
shower band of clouds moving into islands

Showers are falling over the islands locally…which will be
increasing into Friday morning
Here’s the looping radar image for the Hawaiian Islands
Small Craft Advisory…rough surf and strong trade winds
over the windiest coastal and channel waters
~~~ Hawaii Weather Narrative ~~~
Strong and gusty trade winds continue…easing up some during the weekend. Here’s the latest weather map, showing the Hawaiian Islands, and the rest of the North Pacific Ocean, along with a real-time wind profiler of the central Pacific. We find a large and strong high pressure system located to the north-northeast of the state, with associated ridges extending east and west from its center. As a result of these high pressure features, and low pressure well to the south, our winds will come in from the trade wind direction. These springtime trade winds will be strong and gusty, likely having peaked in strength yesterday. The outlook shows no definite end to this long lasting trade wind episode, although they are expected to ease up some into the weekend…then strengthen again early next week.
Showers will continue along the windward sides at times, increasing this evening into Friday…some locally generous. The windward sides will see the most notable shower activity…as a former cold front moves into the state this evening. The leeward sides will find some showers falling locally at times too. As we push into the weekend, our weather picture will become more pleasant look, with lighter winds and fewer passing showers. As we get into early next week, and the trade winds will surge again, and we’re likely to see another increase in windward biased showers arriving then for several days. I’ll be back with more updates on all of the above, I hope you have a great Thursday night wherever you’re spending it! Aloha for now…Glenn.
World-wide tropical cyclone activity:
>>> Atlantic Ocean: The last regularly scheduled Tropical Weather Outlook of the 2014 Atlantic hurricane season…has occurred. Routine issuance of the Tropical Weather Outlook will resume on June 1, 2015. During the off-season, Special Tropical Weather Outlooks will be issued as conditions warrant.
Here’s a satellite image of the Atlantic Ocean
>>> Caribbean Sea: The last regularly scheduled Tropical Weather Outlook of the 2014 Atlantic hurricane season…has occurred. Routine issuance of the Tropical Weather Outlook will resume on June 1, 2015. During the off-season, Special Tropical Weather Outlooks will be issued as conditions warrant.
>>> Gulf of Mexico: The last regularly scheduled Tropical Weather Outlook of the 2014 Atlantic hurricane season…has occurred. Routine issuance of the Tropical Weather Outlook will resume on June 1, 2015. During the off-season, Special Tropical Weather Outlooks will be issued as conditions warrant.
Here’s a satellite image of the Caribbean Sea…and the Gulf of Mexico.
>>> Eastern Pacific: The last regularly scheduled Tropical Weather Outlook of the 2014 North Pacific hurricane season…has occurred. Routine issuance of the Tropical Weather Outlook will resume on May 15, 2015. During the off-season, Special Tropical Weather Outlooks will be issued as conditions warrant.
Here’s a wide satellite image that covers the entire area between Mexico, out through the central Pacific…to the International Dateline.
Here’s the link to the National Hurricane Center (NHC)
>>> Central Pacific: The central north Pacific hurricane season has officially ended. Routine issuance of the tropical weather outlook will resume on June 1, 2015. During the off-season, special tropical weather outlooks will be issued as conditions warrant.
Here’s a link to the Central Pacific Hurricane Center (CPHC)
>>> Northwest Pacific Ocean: There are no active tropical cyclones
>>> South Pacific Ocean: There are no active tropical cyclones
>>> North and South Indian Oceans: Tropical Cyclone 24S (Quang) is dissipating inland over northwestern Australia, here’s the JTWC graphical track map…along with a satellite image – Final Warning
Here’s a link to the Joint Typhoon Warning Center (JTWC)
Interesting: What ecosystem is most at threat from human impact? – An international team of scientists has used the 23-million-year fossil record to calculate which marine animals and ecosystems are most at risk of extinction today.
In a paper published in the journal Science, the researchers found those animals and ecosystems most threatened are predominantly in the tropics.
“Marine species are under threat from human impact, but knowledge of their vulnerabilities is limited,” says study co-author, Professor John Pandolfi from the ARC Center of Excellence for Coral Reef Studies at the University of Queensland.
The researchers found that the predictors of extinction vulnerability, geographic range size and the type of organism, have remained consistent over the past 23 million years.
As such, they were able to use fossil records to assess the baseline extinction risk for marine animals, including sharks, whales and dolphins, as well as small sedentary organisms such as snails, clams and corals.
They then mapped the regions where those species with a high intrinsic risk are most affected today by human impact and climate change.
“Our goal was to diagnose which species are vulnerable in the modern world, using the past as a guide” says study lead author, Assistant Professor Seth Finnegan from the University of California Berkeley.
“We used these estimates to map natural extinction risk in modern oceans, and compare it with recent human pressures on the ocean such as fishing, and climate change to identify the areas most at risk,” says Professor Pandolfi.
“These regions are disproportionately in the tropics, raising the possibility that these ecosystems may be particularly vulnerable to future extinctions.”
The scientists say that identifying the regions and species at greatest risk means conservation efforts can be better targeted.
“We believe the past can inform the way we plan our conservation efforts. However there is a lot more work that needs to be done to understand the causes underlying these patterns and their policy implications,” says Asst. Professor, Seth Finnegan.