


Air Temperatures – The following maximum temperatures were recorded across the state of Hawaii Monday:
Lihue, Kauai – 82
Honolulu airport, Oahu – 86
Kaneohe, Oahu – 82
Molokai airport – 84
Kahului airport, Maui – 87 (Record high for Monday / 93 – 1953 )
Kona airport – 83
Hilo airport, Hawaii – 82
Air Temperatures ranged between these warmest and coolest spots near sea level – and on the highest mountain tops…as of 5pm Monday evening:
Barking Sands, Kauai – 83
Hilo, Hawaii – 77
Haleakala Crater – 48 (near 10,000 feet on Maui)
Mauna Kea – 36 (near 13,800 feet on the Big Island)
Hawaii’s Mountains – Here’s a link to the live web cam on the summit of near 13,800 foot Mauna Kea on the Big Island of Hawaii. This web cam is available during the daylight hours here in the islands…and when there’s a big moon shining down during the night at times. Plus, during the nights you will be able to see stars, and the sunrise and sunset too…depending upon weather conditions. Here's the Haleakala Crater webcam on Maui…although this webcam is not always working correctly.
Tropical Cyclone activity in the eastern and central Pacific – Here’s the latest weather information coming out of the National Hurricane Center, covering the eastern north Pacific. You can find the latest tropical cyclone information (once the season begins June 1) for the central north Pacific (where Hawaii is located) by clicking on this link to the Central Pacific Hurricane Center. A satellite image, which shows the entire ocean area between Hawaii and the Mexican coast…can be found here. Here's a tropical cyclone tracking map for the eastern and central Pacific.
Aloha Paragraphs

Strengthening trades this week, passing
windward showers at times…although generally
light and limited in coverage for the time being –
locally quite hazy
As this weather map shows, we have a high pressure system located to the east-northeast of the islands, with an elongated high pressure ridge extending far westward…to the north of the state. Our local winds will continue to be from the trade wind direction…picking up further Wednesday onwards.
The following numbers represent the most recent top wind gusts (mph), along with directions as of Monday evening:
25 Port Allen, Kauai – ESE
29 Kuaokala, Oahu – NE
24 Molokai – ENE
32 Kahoolawe – ENE
31 Kahului, Maui – NE
31 Lanai
28 Puu Mali, Big Island – SE
We can use the following links to see what’s going on in our area of the north central Pacific Ocean. Here's the latest NOAA satellite picture – the latest looping satellite image…and finally the latest looping radar image for the Hawaiian Islands.
Here are the latest 24-hour precipitation totals (inches) for each of the islands as of Monday evening:
0.04 Anahola, Kauai
0.20 Kahana, Oahu
0.00 Molokai
0.00 Lanai
0.00 Kahoolawe
0.41 Puu Kukui, Maui
0.40 Kawainui Stream, Big Island
Sunset Commentary: The trade winds will strengthen…becoming stronger by Wednesday. This will be a long lasting trade wind weather pattern, keeping our trades blowing through the next week at least. The NWS forecast office in Honolulu is keeping the small craft wind advisories active overnight, which should last, at least in those windiest areas around Maui County and the Big Island…well into the future. At higher elevations on Maui and the Big Island, stronger winds are keeping wind advisories in force over those summits now too.
As far as precipitation goes, there will be those incoming showers at times, although the overlying atmosphere is generally dry and stable at the moment, which will act to limit shower intensities and coverage. As the trade winds increase in strength, there may be some increase in windward shower activity…depending upon available moisture. There are no signs of any heavy shower activity on the horizon at this time. The leeward sides of the islands should remain nice, with just a few possible showers being carried into those areas when the winds get stronger in a few days.
Here in Kula, Maui, it was partly cloudy early Monday evening, although very hazy, with an air temperature of 72.1F degrees. As this satellite image shows, there are lots of low clouds upstream of the islands, which will be brought in along our windward coasts and slopes tonight into Tuesday, although I don't believe there will be too much precipitation falling from them. Just before sunset there started to be some very thin high cirrus clouds coming in from the north and northwest. I'll be back early Tuesday morning with your next new weather narrative, I hope you have a great Monday night wherever you happen to be spending it! Aloha for now…Glenn.
Tropical cyclone reports / Eastern Pacific: The second tropical cyclone of the 2012 hurricane season, in the eastern Pacific, became active Sunday. This strengthening tropical depression called 2E, is forecast to become a tropical storm called Bud on Tuesday…attaining hurricane status by mid-week. 2E was located approximately 505 miles south-southwest of Acapulco, Mexico, with 35 mph sustained winds. Here's the NHC storm track map, along with a satellite image. There is absolutely no threat to the Hawaiian Islands from this quickly developing tropical system.
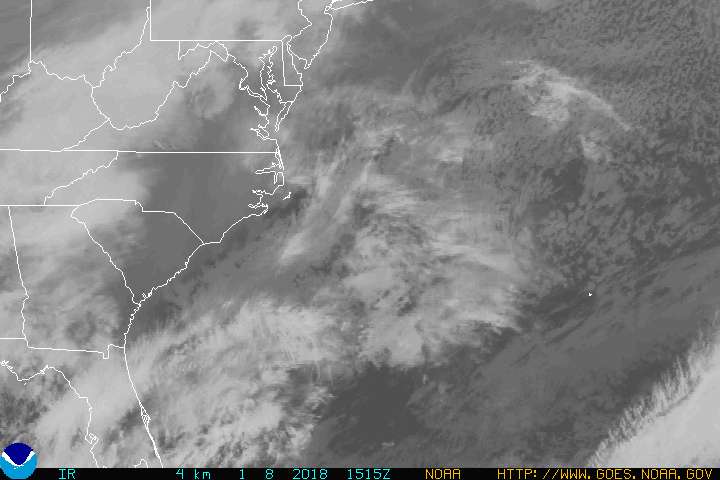
Atlantic Ocean: Meanwhile, tropical depression Alberto remained active offshore approximately 245 miles south-southeast of Charleston, South Carolina. This downgraded tropical depression had 35 mph sustained winds. Alberto is forecast to remain well offshore from the east coast, moving northeast in direction…with a rather fast paced weakening trend. Here's the NHC storm track map, along with a satellite image. There remains no danger to the United States from this first tropical cyclone of the year.
Western Pacific Ocean: Finally, there's a third tropical cyclone in the tropical waters of the world, this one in the western Pacific near Guam. It is tropical storm Sanvu, forecast by the Joint Typhoon Warning Center (JTWC) to become a typhoon later in the day Tuesday or early Wednesday. It was located approximately 45 nautical miles west of Andersen Air Force Base, Guam. Here's the latest JTWC graphical track map. Here's a NOAA satellite image of Sanvu. At the moment, this tropical cyclone isn't expected to impact any island areas in the western Pacific.
Interesting: In the first study of its kind in Australia, scientists have used 27 natural climate records to create the first large-scale temperature reconstruction for the region over the last 1000 years. The study was led by researchers at the University of Melbourne and used a range of natural indicators including tree rings, corals and ice cores to study Australasian temperatures over the past millennium and compared them to climate model simulations. Lead researcher, Dr Joelle Gergis from the University of Melbourne said the results show that there are no other warm periods in the last 1000 years that match the warming experienced in Australasia since 1950.
"Our study revealed that recent warming in a 1000 year context is highly unusual and cannot be explained by natural factors alone, suggesting a strong influence of human-caused climate change in the Australasian region," she said. The study published recently in the Journal of Climate will form the Australasian region's contribution to the 5th IPCC climate change assessment report chapter on past climate.
She said using what is known as 'palaeoclimate' or natural records, such as tree rings, corals and ice cores, are fundamental in evaluating regional and global climate variability over centuries before direct temperature records started in 1910.
Dr Gergis collated these natural records provided by decades of work by more than 30 researchers from Australia, New Zealand and around the world. The reconstruction was developed using 27 natural climate records calculated in 3000 different ways to ensure that the results were robust.
She said reconstructions of regional temperature not only provide a climate picture of the past but also a significant platform to reduce uncertainties associated with future climate variability. The study is part of a global collaboration, PAGES, Past Global Changes Regional 2K initiative, which is working to reconstruct the last 2000 years of climate across every region in the world in order to reduce uncertainties associated with future climate change projections.
Karen Bradley Says:
HI Glenn
My name is Karen and I live in Ireland. I would love to visit Hawaii . what is the best time of year to visit to get some sun.
Thanks Karen~~~Hi Karen, coming from often cloudy Ireland, I can understand your desire for warm sunshine! I suggest the summer months here in Hawaii, with May and June being typically two of the driest months…with often lots of sunshine! I know you will enjoy our islands, for sure. Aloha, Glenn