


July 6-7, 2010
Air Temperatures – The following maximum temperatures were recorded across the state of Hawaii Tuesday afternoon:
Lihue, Kauai – 82
Honolulu, Oahu – 86
Kaneohe, Oahu – 83
Kaunakakai, Molokai – 82
Kahului, Maui – 86
Hilo, Hawaii – 85
Kailua-kona – 83
Air Temperatures ranged between these warmest and coolest spots near sea level – and on the highest mountain tops too…as of 5pm Tuesday evening:
Kalaeloa, Oahu – 85
Molokai airport – 76
Haleakala Crater – 57 (near 10,000 feet on Maui)
Mauna Kea summit – 43 (near 14,000 feet on the Big Island)
Precipitation Totals – The following numbers represent the largest precipitation totals (inches) during the last 24 hours on each of the major islands, as of Tuesday afternoon:
2.15 Mount Waialeale, Kauai
1.33 Oahu Forest NWR, Oahu
0.10 Molokai
0.00 Lanai
0.00 Kahoolawe
0.15 Puu Kukui, Maui
0.01 Kahuku Ranch, Big Island
Marine Winds – Here’s the latest (automatically updated) weather map showing two high pressure cells positioned far northwest and northeast…providing moderately strong trade winds through Thursday.
Satellite and Radar Images: To view the cloud conditions we have here in Hawaii, please use the following satellite links, starting off with this Infrared Satellite Image of the islands to see all the clouds around during the day and night. This next image is one that gives close images of the islands only during the daytime hours, and is referred to as a Close-up visible image. This next image shows a larger view of the Pacific…giving perspective to the wider ranging cloud patterns in the Pacific Ocean. Finally, here’s a Looping IR satellite image, making viewable the clouds around the islands 24 hours a day. To help you keep track of where any showers may be around the islands, here’s the latest animated radar image.
Hawaii’s Mountains – Here’s a link to the live webcam on the summit of near 14,000 foot Mauna Kea on the Big Island of Hawaii. The tallest peak on the island of Maui is the Haleakala Crater, which is near 10,000 feet in elevation. These two webcams are available during the daylight hours here in the islands…and when there’s a big moon rising just after sunset for an hour or two! Plus, during the nights and early mornings you will be able to see stars, and the sunrise too…depending upon weather conditions.
Tropical Cyclone activity in the eastern and central Pacific – Here’s the latest weather information coming out of the National Hurricane Center, covering the eastern north Pacific. You can find the latest tropical cyclone information for the central north Pacific (where Hawaii is located) by clicking on this link to the Central Pacific Hurricane Center. Here’s a tracking map covering both the eastern and central Pacific Ocean. A satellite image, which shows the entire ocean area between Hawaii and the Mexican coast…can be found here. Of course, as we know, our hurricane season won’t begin again until June 1st here in the central Pacific.
Aloha Paragraphs

Generally good weather…windward showers locally
The trade winds will remain active through the rest of this week, bumping up Friday into Saturday, and then coming down later Sunday into early next week. We can consider this wind flow to be moderately strong through Thursday, and then it may ratchet-up a notch or two Friday into the weekend. There won’t likely be a need for small craft wind advisories through Thursday, although by Friday and Saturday into Sunday…we will see those advisories likely going up over the windiest areas, especially around Maui and the
There seems to have been quite a bit of variation with rainfall along our windward sides lately. Saturday was locally wet, Sunday and Monday were generally drier, while it has turned wetter again today…especially over Oahu and Maui County. We’ll find generally wet trade winds, at least locally, to remain active through Thursday…with some of the moisture being carried over into the leeward sides. If we check out this IR satellite image, we see clouds being carried our way, with a few of those brighter whiter spots to the south and SE of the islands…having higher and colder cloud top temperatures. If we switch to a larger view of the central Pacific, we see an area of disturbed weather to our southeast, with just one thunderstorm near the center early this evening. The models show this area sliding by to the south of
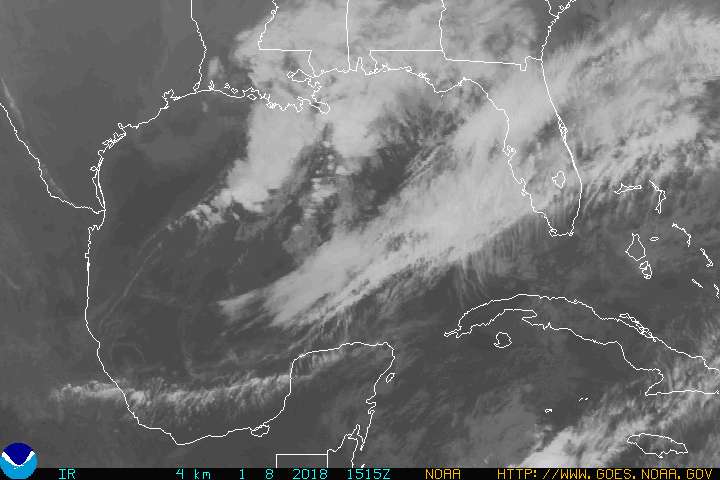
The west, central and east north Pacific Ocean has no active tropical cyclones Tuesday night. There remains that same area of disturbed weather near the Yucatan Peninsula, which continues to have a better than 30% chance of spinning up over the next few days as it moves into the Gulf of Mexico. This area will drop heavy rains in the area. Here’s the area circled in orange…along with a satellite image. Meanwhile, back over here in the central Pacific, we have an area of disturbed weather as well. This area has a low 10% chance of becoming a tropical cyclone. Here’s a map showing the area circled in yellow to the southeast of the islands…along with a satellite image. Here’s what the hurricane models are showing for this area, which is about 725 miles away from the islands.
It’s Tuesday evening as I begin writing this last section of today’s narrative update. As noted above, we’ll continue to be influenced by a trade wind weather pattern. These trade winds will remain in the moderately strong category for the most part. The models continue to show a two day ramping-up of the trade winds Friday into Saturday. This will be caused by the area of disturbed weather (vortex) moving by to our south. The winds will likely slip back a notch Sunday into early next week. As for showers, they will continue to ride in on the trade winds. They will be off and on, becoming wetter some days, and then pull back others. They will however affect the windward sides by far the most, and fall most generously during the night and morning hours. ~~~ Here in Kihei, Maui early Tuesday evening it is mostly clear. There are some clouds around the edges, and up the slope of the Haleakala Crater from here. The strongest wind gusts at around 5pm were: 40 mph at Maalaea Bay, here on Maui, and 35 mph on the Big Island. Meanwhile, the warmest air temperature at 5pm was along the windward side of Oahu, which was 85F degrees. I’ll be leaving now, and will be back online with you early Wednesday morning, when I’ll have your next new weather narrative available around 6am (HST). I hope you have a great Tuesday night until then! Aloha for now…Glenn.
Extra: Be my Love…Keith Jarrett – I recommend you make this youtube video full screen.
Interesting: The possible spread of the oil spill from the Deepwater Horizon rig over the course of one year was studied in a series of computer simulations by a team of researchers from the School of Ocean and Earth Science and Technology (SOEST) at the University of Hawaii at Manoa. The simulations suggest that the coastlines near the Carolinas, Georgia, and Northern Florida could see the effects of the oil spill as early as October 2010, while the main branch of the subtropical gyre is likely to transport the oil film towards Europe, although strongly diluted.
Eight million buoyant particles were released continuously from April 20 to September 17, 2010, at the location of the Deepwater Horizon oil rig. The release occurred in ocean flow data from simulations conducted with the high-resolution Ocean General Circulation Model for the Earth Simulator (OFES).
"The paths of the particles were calculated in 8 typical OFES years over 360 days from the beginning of the spill," says Fabian Schloesser, a PhD student from the Department of Oceanography in SOEST, who worked on these simulations with Axel Timmermann and Oliver Elison Timm from the International Pacific Research Center, also in SOEST.
"From these 8 typical years, 5 were selected to create an animation for which the calculated extent of the spill best matches current observational estimates." The dispersal of the particles does not capture such effects as oil coagulation, formation of tar balls, chemical and microbial degradation. Computed surface concentrations relative to the actual spill may therefore be overestimated.
The animation, thus, is not a detailed, specific prediction, but rather a scenario that could help guide research and mitigation efforts. The animation shows the calculated surface particle concentrations for grid boxes about 10-km-by-10-km in size into April 2011. For an estimated flow of oil from the Deepwater Horizon of 50,000 barrels per day over a 150 day period, a concentration of e.g. 10 particles per grid box in the animation corresponds roughly to an oil volume of 2 cubic meters per 100 square kilometer.
The oil spreads initially in the Gulf of Mexico, then enters the Loop Current and the narrow Florida Current, and finally the Gulf Stream. "After one year, about 20% of the particles initially released at the Deepwater Horizon location have been transported through the Straits of Florida and into the open Atlantic," explains Timmermann. This animation suggests that the coastlines near the Carolinas, Georgia, and Northern Florida could see the effects of the oil spill as early as October 2010.
The main branch of the subtropical gyre is likely to transport the oil film towards Europe, although strongly diluted. The animation also shows that as the northeasterly winds intensify near Florida around October and November, the oil in the Atlantic moves closer to the eastern shores of the US, whereas it retreats from the western shores of Florida.
The narrow, deep Straits of Florida force the Florida Current into a narrow channel, creating a tight bottleneck for the spreading of oil into the Atlantic. As the animation suggests, a filtering system in the narrowest spot of the Florida Current could mitigate the spreading of the oil film into the North Atlantic.
Interesting2: A supertanker adapted to scoop up oil from the BP spill in the Gulf of Mexico began tests, amid a report that some major investors expect the energy giant to replace its top executives. The vessel named "A Whale" and dubbed a "super skimmer" is operating just north of the blown out well as part of a two-day test watched by the U.S. Coastguard, said Bob Grantham, spokesman for TMT Shipping Offshore, which owns the ship.
If all goes to plan TMT hopes to sign a clean-up contract for the ship, which can remove up to 500,000 barrels (21 million gallons) of oil and water mix from the sea surface a day, according to crew members. Efforts by BP to contain the damage returned to normal after a hurricane and the British company said its oil-capture systems at its leaking well collected or burned off 25,290 barrels of oil during operations on Friday.
The storm passed through the spill area off the coast of Louisiana without doing major damage. But the corporate fall-out from the worst offshore oil spill in U.S. history appeared far from over. The Financial Times newspaper reported BP investors expected to see a change in the company’s leadership, possibly once the leak is capped, with both Chief Executive Tony Hayward and Chairman Carl-Henric Svanberg in jeopardy.
"When this is over there will be a full investigation, and we would expect some action to replace the top team," the British newspaper quoted a top 10 UK shareholder as saying in its Saturday edition. Without steps to steady the ship, BP could become a takeover target of companies like ExxonMobil, Royal Dutch Shell or PetroChina, the FT said, citing a source working on BP’s strategy.
Interesting3: The mammoths are members of Elephantidae, the family of elephants and mammoths, and close relatives of modern elephants. They lived from the Pleistiocene epoch around 4.8 million to 4,500 years ago. They were part of a number large mammal species called megafauna. They all lived on Earth during the Pleistocene epoch and became extinct in an extinction event.
These species appear to have died off as humans expanded out of Africa and southern Asia, the only continents that still retain a diversity of megafauna comparable to what was lost. The Americas, northern Eurasia, Australia and many larger Islands lost the vast majority of their larger and all of their largest mammals.
Four throries have been given for these extinctions: hunting by the spreading humans, climate change, spreading disease, and an impact from an asteroid or comet. A combination of those explanations is also possible. This mass extinction was caused by newly arrived humans tipping the balance of power and competing with major predators such as sabertooth cats, the authors of the new analysis argue.
An equilibrium that had survived for thousands of years was disrupted, perhaps explaining the loss of two-thirds of North America’s large mammals during this period. "We suggest that the arrival of humans to North America triggered a trophic cascade in which competition for the largest prey was intensified, ultimately causing the large non-human carnivores to decimate the large herbivores," said Blaire Van Valkenburgh, UCLA professor of ecology and evolutionary biology and a co-author on the paper.
"When human hunters arrived on the scene, they provided new competition with these carnivores for the same prey. "The addition of humans was different from prior arrivals of new predators, such as lions, because humans were also omnivores and could live on plant foods if necessary," Van Valkenburgh said.
"We think this may have triggered a sequential collapse not only in the large herbivores, but ultimately their predators as well. Importantly, humans had some other defenses against predation, such as fire, weapons and living in groups, so they were able to survive." In the late Pleistocene, researchers say, major predators dominated North America in an uneasy stability with a wide range of mammals: mammoths, mastodons, ground sloths, camels, horses and several species of bison.
The new study cites previous evidence from carnivore tooth wear and fracture, growth rates of prey, and other factors that suggest that there were no serious shortages of food caused by environmental change. There was an ecological stability dominated by large predators. The new human predator imbalanced the ecosystem leading to its ultimate collapse. This pattern of extinction has been seen more recently on isolated islands.
Many islands had unique megafauna that went extinct upon the arrival of humans (over the last few millennia and continuing into recent centuries). These included the giant bird forms in New Zealand such as the moas; giant lemurs, two species of hippopotamus, and a giant tortoise in Madagascar; giant geese and moa-nalo (giant ducks) in Hawaii.
The loss of species in North America during the late Pleistocene was remarkable; about 80 percent of 51 large herbivore species went extinct, along with more than 60 percent of large carnivores. Previous research has documented the growth rates of North American mammoths by studying their tusks, revealing no evidence of reduced growth caused by inadequate food, thus offering no support for climate induced habitat decline.
Rather, the large population of predators such as dire wolves and sabertooth cats caused carnivores to compete intensely for food, as evidenced by heavy tooth wear. "Heavily worn and fractured teeth are a result of bone consumption, something most carnivores avoid unless prey is difficult to acquire," Van Valkenburgh said. "In the aquatic realm, the Earth’s oceans are the last frontier for megafaunal species declines and extinctions.
"The tragic cascade of species declines due to human harvesting of marine megafauna happening now may be a repeat of the cascade that occurred with the onset of human harvesting of terrestrial megafauna more than 10,000 years ago. This is a sobering thought, but it is not too late to alter our course this time around in the interest of sustaining Earth’s ecosystems."
Interesting4: La Nina is likely to cool the tropical Pacific in coming months, a phenomenon which usually causes stronger monsoons across Asia and eastern Australia, the World Meteorological Organization (WMO) said on Tuesday. The weather condition also promotes the development of storms including hurricanes in the tropical Atlantic, it said. El Nino, the opposite phenomenon which warms the sea, rapidly dissipated in early May after prevailing since late 2009.
This has led to the current situation, bordering on a weak La Nina event in the tropical Pacific, according to the United Nations agency. "These borderline conditions are more likely than not to strengthen to become a basin-wide La Nina episode during the second half of 2010," WMO said in a statement.
While it is likely that the La Nina conditions will further develop over the next several months, the timing and magnitude of such an event in 2010 are still uncertain," WMO expert Rupa Kumar Kolli told a news briefing in Geneva. Current conditions are not adequate for the WMO to declare that a La Nina event is actually in place, he said.
It is possible, but less likely, for neutral temperatures to prevail during the rest of the year. Most forecasting models do not a indicate a particularly strong La Nina event in terms of sea-surface temperatures, he said. Typical La Nina events are usually associated with stronger monsoons in South Asia, Southeast Asia, parts of East Asia and also Australia.
A La Nina event is also associated with an active hurricane season in the tropical Atlantic, Kolli said. "So these are some of the risk factors that should be kept in mind," he said. The U.S. government’s top weather agency has already predicted that the Atlantic storm season which began on June 1 may be the most intense since 2005 when Hurricane Katrina killed over 1,000 people and disrupted oil production by crashing through Gulf of Mexico energy facilities.
Kolli, asked about the possible effects of La Nina on efforts to clean up BP’s Gulf of Mexico oil slick, said: "La Nina by itself is unlikely to play a role in that region. "But considering that there is a possibility of an active hurricane season, the hurricanes definitely have the potential to churn up the sea and also play a role in the spread of the oil spill in some ways. But this all depends upon the track of the hurricane and the strength of the hurricane and many other factors associated with individual hurricane events," he said.
Changes in sea temperatures in the Pacific are strongly linked to major climate fluctuations around the globe, and once underway such events can last for 12 months or more, according to the WMO. A strong El Nino event of 1997-98 was followed by a prolonged La Nina phase from mid-1998 to early 2001.
While El Nino/La Nina events change the likelihood of particular climate patterns around the globe, the outcomes of each event are never exactly the same, it said. If a La Nina event becomes well-established, it is also associated with a slight decrease in air temperature in many parts of the world, according to Kolli. "That has implications for the global mean temperature," he told Reuters.