Air Temperatures ranged between these warmest and coolest spots near sea level around – and on the highest mountains…as of 5pm Wednesday evening:
Kaneohe, Oahu – 84
Hilo, Hawaii – 77
Haleakala Crater – 53 (near 10,000 feet on Maui)
Mauna Kea summit – 43 (near 14,000 feet on the Big Island)
Precipitation Totals–The following numbers represent the largest precipitation totals (inches) during the last 24 hours on each of the major islands, as ofWednesday afternoon:
1.88 Mount Waialeale, Kauai 0.73 Oahu Forest NWR, Oahu
0.09 Molokai
0.00 Lanai
0.04 Kahoolawe
0.21 West Wailuaiki, Maui
0.22 Mountain View, Big Island
Marine Winds – Here’s the latest (automatically updated)weather mapshowing a 1034 millibar high pressure system to the north of the islands. Trade winds holding at moderately strong, with stronger and gusty winds in a few places. Satellite and Radar Images:To view the cloud conditions we have here in Hawaii, please use the following satellite links, starting off with thisInfrared Satellite Imageof the islands to see all the clouds around during the day and night. This next image is one that gives close images of the islands only during the daytime hours, and is referred to as aClose-up visible image. This next image showsa larger view of the Pacific…giving perspective to the wider ranging cloud patterns in the Pacific Ocean. Finally, here’s aLooping IR satellite image, making viewable the clouds around the islands 24 hours a day. To help you keep track of where any showers may be around the islands, here’s the latest animatedradar image.
Hawaii’s Mountains – Here’s a link to the live webcam on the summit of near 14,000 foot Mauna Kea on the Big Island of Hawaii. The tallest peak on the island of Maui is the Haleakala Crater, which is near 10,000 feet in elevation. These two webcams are available during the daylight hours here in the islands…and when there’s a big moon rising just after sunset for an hour or two! Plus, during the nights and early mornings you will be able to see stars, and the sunrise too…depending upon weather conditions. Tropical Cyclone activity in the eastern and central Pacific– Here’s the latest weather information coming out of theNational Hurricane Center, covering the eastern north Pacific. You can find the latest tropical cyclone information for the central north Pacific (where Hawaii is located) by clicking on this link to the Central Pacific Hurricane Center. Here’s atracking mapcovering both the eastern and central Pacific Ocean. A satellite image, which shows the entire ocean area between Hawaii and the Mexican coast…can be found here. Of course, as we know, our hurricane season won’t begin again until June 1st here in the central Pacific.
Aloha Paragraphs
Kauai…painted by Gary Reed
The trade winds will be quite breezy, remaining that way through the rest of this week…easing up a touch going into next week.Looking at thisweather map, we see a fairly strong 1034 millibar high pressure system, located far to the north of our islands Wednesday night. As the winds are stronger now, small craft wind advisories remain up in the coastal and channel waters around Maui and the Big Island. The computer models show the trade winds sticking around through the rest of this week…right on into next week.
Any showery clouds that get carried our way on the trades…will end up on the windward sides primarily.Here’s an IRsatellite imageshowing an area of clouds approaching from the east, which will bring a modest increase in showers to the windward sides tonight into Thursday morning. As thislooping radar imageof the islands shows, few showers are falling from these clouds however. The leeward sides will remain generally dry, although the Kona slopes may get a few afternoon upslope showers at times. Our weather in general will be on the dry side, although there will be off and on periods of modestly increased windward showers through the week.
The eastern and central Pacific Oceanhas no active tropical cyclones Wednesday night. Meanwhile, we find that hurricane Alex attained category 2 strength, as it impacted the northeast Mexican coast Wednesday evening. Here’s the latest graphical track map…along with a satellite image. Alex brought inclement weather conditions to southern Texas, especially in the Brownsville area as well.
It’s Wednesday evening as I begin writing this last section of today’s narrative update. As noted above, the trade winds have surged as expected. To get a sense of how strong they are as we begin this new day, here’s the strongest gusts on each of the islands at mid-afternoon:
Those numbers are likely about as strong as they will be Wednesday, we’ll check back later this evening to see what we find then. We’ll likely see these winds peaking out in strength this week around Thursday into Friday. The rather strong high pressure system to our north now, is the source of our mid-week trade winds. As this high gradually migrates eastward, our winds will begin to lose a little steam as we move into the upcoming 4th of July holiday. ~~~ Here in Kihei, Maui at around 515pm, looking out the window of my office, it looks exactly like its suppose to on the last day of June, 2010. It’s clear to partly cloudy, and the trade winds are blowing at a good clip. The air temperature, I would estimate is right aroud 84F degrees. As I mentioned above, hurricane Alex has gone ashore over northeast Mexico, with big winds and heavy rains…along with pounding high surf along that stretch of coast as well. Some of these inclement conditions have been getting northward into southern Texas too. At any rate, I’m heading home now, although will be back in a little while to do some additional updating on the high temperatures here in Hawaii today, and the rainfall totals up this page too. Aloha for now…Glenn.
Extra:Asatellite loopof hurricane Alex, in the western Gulf of Mexico…as it moves across the Mexican coast – sending clouds and showers up into southern Texas as well.
Interesting: Desert bats reduce water loss by changing the make-up of their skin, allowing them to thrive in some of the world’s most inhospitable environments. This is surprising as with large naked wings and the energy they expend in flight, bats are expected to have high rates of water loss by evaporation, say the scientists from the Ben-Gurion University in Israel.
This may provide significant insight into how bats might respond to a future changing climate. The researchers are presenting their work at the Society for Experimental Biology Annual Conference in Prague. The researchers found total water loss in the desert-living Pipistrellus kuhli was just 80% of other non-desert species.
Total water loss is made up of the sum of cutaneous (through the skin) and respiratory (exhaling) water losses, explained lead researcher Dr Muñoz-Garcia. Desert bats were found to have reduced cutaneous water loss (CWL), the biggest contributor to total water loss, when compared to non-desert species of bats of the same size.
The proposed mechanism of adjusting the lipid (fat) composition of their skin is known in other species of mammals and birds. Dr Muñoz-Garcia and his team were the first to identify this link in other species of bat, and aim to prove it in desert bats. The scientists believe that these findings provide significant insight into how bats can adapt to major changes in their environment.
"Control of energy expenditure and water loss is crucial for all terrestrial animals to survive and reproduce," explains lead researcher Agustí Muñoz-Garcia. "This is particularly important for animals that live in deserts, where ambient temperatures are high, humidity is low and drinking water is scarce."
The next step for Dr Muñoz-Garcia and his team is to examine further species of desert bats to consolidate their findings so far and shed more light on the adaptive mechanism for reducing CWL. "Our plan is to measure at least 8 species from different environments, so we can start building a database that can allow future comparisons," Dr Muñoz-Garcia explained.
Interesting2:To the untrained eye, University of Colorado at Boulder Research Associate Craig Lee’s recent discovery of a 10,000-year-old wooden hunting weapon might look like a small branch that blew off a tree in a windstorm. Nothing could be further from the truth, according to Lee, a research associate with CU-Boulder’s Institute of Arctic and Alpine Research who found the atlatl dart, a spear-like hunting weapon, melting out of an ice patch high in the Rocky Mountains close to Yellowstone National Park.
Lee, a specialist in the emerging field of ice patch archaeology, said the dart had been frozen in the ice patch for 10 millennia and that climate change has increased global temperatures and accelerated melting of permanent ice fields, exposing organic materials that have long been entombed in the ice.
"We didn’t realize until the early 2000s that there was a potential to find archaeological materials in association with melting permanent snow and ice in many areas of the globe," Lee said. "We’re not talking about massive glaciers, we’re talking about the smaller, more kinetically stable snow banks that you might see if you go to Rocky Mountain National Park."
As glaciers and ice fields continue to melt at an unprecedented rate, increasingly older and significant artifacts — as well as plant material, animal carcasses and ancient feces — are being released from the ice that has gripped them for thousands of years, he said. Over the past decade, Lee has worked with other researchers to develop a geographic information system, or GIS, model to identify glaciers and ice fields in Alaska and elsewhere that are likely to hold artifacts.
They pulled together biological and physical data to find ice fields that may have been used by prehistoric hunters to kill animals seeking refuge from heat and insect swarms in the summer months. "In these instances, what we’re finding as archaeologists is stuff that was lost," Lee said. "Maybe you missed a shot and your weapon disappeared into the snow bank. It’s like finding your keys when you drop them in snow.
You’re not going to find them until spring. Well, the spring hasn’t come until these things started melting for the first time, in some instances, in many, many thousands of years." The dart Lee found was from a birch sapling and still has personal markings on it from the ancient hunter, according to Lee. When it was shot, the 3-foot-long dart had a projectile point on one end, and a cup or dimple on the other end that would have attached to a hook on the atlatl.
The hunter used the atlatl, a throwing tool about two feet long, for leverage to achieve greater velocity. Later this summer Lee and CU-Boulder student researchers will travel to Glacier National Park to work with the Salish, Kootenai and Blackfeet tribes and researchers from the University of Wyoming to recover and protect artifacts that may have recently melted out of similar locations.
"We will be conducting an unprecedented collaboration with our Native American partners to develop and implement protocols for culturally appropriate scientific methods to recover and protect artifacts we may discover," he said. Quick retrieval of any organic artifacts like clothing, wooden tools or weapons is necessary to save them, because once thawed and exposed to the elements they decompose quickly, he said.
An estimated 10 percent of Earth’s land surface is covered with perennial snow, glaciers and ice fields, providing plenty of opportunities for exploration, Lee said. However, once organic artifacts melt out of the ice, they could be lost forever.
"Ninety-five percent of the archaeological record that we usually base our interpretations on is comprised of chip stone artifacts, ground stone artifacts, maybe old hearths, which is a fire pit, or rock rings that would have been used to stabilize a house," Lee said.
"So we really have to base our understanding about ancient times on these inorganic materials. But ice patches are giving us this window into organic technology that we just don’t get in other environments."
Interesting3:It seems ironic that some of the most unhealthy food can be found in a place where people are receiving medical treatment for chronic diseases like heart disease, diabetes and cancer. After all, isn’t healthy food an integral part of the healing process? Given the bad reputation that ‘hospital food’ has, there are substantial opportunities for improvement in quality.
According to a story in NPR, the local and organic food movement is making its way into hospital kitchens around the country. Supporters of the program believe that higher-quality produce combined with fewer servings of meat, will help hospital patients in their recovery process and remind them about the importance of eating well.
One of the major barriers to large scale adoption, however, is cost. Many hospitals aren’t sure that they can afford it. Big medical centers buy food in bulk from large distributors that don’t typically offer organic options. But now that hospitals are giving their menus a makeover, the distributors are taking notice and instituting changes as well.
MedAssets, which purchases food for 2,400 hospitals, executed a contract in 2006 with the nation’s largest supplier of organic products. In today’s competitive health care market, patients that ask for healthier and more organic options are more likely to get it, as hospitals try to meet demand.
In 2008, the Muir Medical Center teamed up with Bay Area hospitals to conduct a trial to cut down on the amount of beef, pork and poultry served to patients and staff. Amongst other notable results, the trial concluded that hospitals were able to reduce meat and poultry purchases by 28 percent, saving $400,000 in costs. The savings could mean purchasing more sustainably raised meats, which have less cholesterol and more vitamins than traditionally produced meat.
Interesting4:The fossilized skull of a colossal whale with a killer bite has been uncovered by a team, who reckon the monster shared the Miocene oceans with a giant shark. The bones, dated to 12 to 13 million years ago, were spotted by Klaas Post of the Natuurhistorisch Museum Rotterdam, the Netherlands, in Peru’s Ica desert. In homage to Herman Melville’s Moby Dick, the beast has been named Leviathan melvillei.
The skull is a huge 3 meters long, says team member Olivier Lambert at the Royal Belgian Institute of Natural Sciences. The team estimates the whale would have been between 13 and 18 meters long, like a modern sperm whale. What really surprised the researchers was the size of the whale’s teeth.
"Some of the biggest ones are 36 centimeters long and 12 centimeters wide, and are probably the biggest predatory teeth ever discovered," Lambert says. Unlike the modern-day sperm whale, which feeds by suction, the giant whale had these massive teeth on both its upper and lower jaw.
"We think the whale used these teeth to catch its prey," says Lambert, suggesting the whale fed in a similar way to modern killer whales. Today’s sperm whales have much smaller teeth on the lower jaw only. "The whale would certainly have been able to catch very large prey, like baleen whales, of which there were plenty in the locality," Lambert says.
"We think it was feeding on medium-sized baleen whales, which were about 8 or 9 metres long." Leviathan melvillei is thought to have co-ruled the ocean with the giant shark Carcharocles megalodon, whose fossils have been found in the same locality in Peru. Lambert and colleagues estimate that the shark was about 15 metres long – more or less the same size as the giant sperm whale.
It’s unlikely that the two giants would have battled each other, says Lambert. "At such sizes, I think it would have been very dangerous for adults of both species to fight," he says. "I could more easily imagine an adult of one species attacking a juvenile of the other." The skull may shed light on the function of the mysterious spermaceti organ.
Consisting of two oil and wax reservoirs on top of the whale’s snout, it is specific to sperm whales ancient and modern. "For a long time it has been proposed that the spermaceti organ helps the whale dive deeper," Lambert says. The team’s proposal that the ancient whale fed on baleen whales, which live near the water’s surface, suggests this may not be the case.
"An alternative hypothesis is that spermaceti organs are used as battering rams to injure opponents during contests over females," says Dave Carrier at the University of Utah. "Leviathan melvillei may also have used forehead ramming to dispatch their suggested prey – baleen whales," Carrier says. Modern killer whales lack spermaceti organs, but are well known to attack large prey by ramming with their snouts."
Air Temperatures ranged between these warmest and coolest spots near sea level around – and on the highest mountains…as of 5pm Tuesday evening:
Kaneohe, Oahu – 76
Hilo, Hawaii – 68
Haleakala Crater – 48 (near 10,000 feet on Maui)
Mauna Kea summit – 34 (near 14,000 feet on the Big Island)
Precipitation Totals–The following numbers represent the largest precipitation totals (inches) during the last 24 hours on each of the major islands, as ofTuesday afternoon:
1.09 Mount Waialeale, Kauai 0.89 Moanalua RG, Oahu
0.09 Molokai
0.00 Lanai
0.04 Kahoolawe
0.24 West Wailuaiki, Maui
0.22 Mountain View, Big Island
Marine Winds – Here’s the latest (automatically updated)weather mapshowing two near 1030 millibar high pressure systems generally to the north of the islands. Trade winds gradually increasing Wednesday into Thursday. Satellite and Radar Images:To view the cloud conditions we have here in Hawaii, please use the following satellite links, starting off with thisInfrared Satellite Imageof the islands to see all the clouds around during the day and night. This next image is one that gives close images of the islands only during the daytime hours, and is referred to as aClose-up visible image. This next image showsa larger view of the Pacific…giving perspective to the wider ranging cloud patterns in the Pacific Ocean. Finally, here’s aLooping IR satellite image, making viewable the clouds around the islands 24 hours a day. To help you keep track of where any showers may be around the islands, here’s the latest animatedradar image.
Hawaii’s Mountains – Here’s a link to the live webcam on the summit of near 14,000 foot Mauna Kea on the Big Island of Hawaii. The tallest peak on the island of Maui is the Haleakala Crater, which is near 10,000 feet in elevation. These two webcams are available during the daylight hours here in the islands…and when there’s a big moon rising just after sunset for an hour or two! Plus, during the nights and early mornings you will be able to see stars, and the sunrise too…depending upon weather conditions. Tropical Cyclone activity in the eastern and central Pacific– Here’s the latest weather information coming out of theNational Hurricane Center, covering the eastern north Pacific. You can find the latest tropical cyclone information for the central north Pacific (where Hawaii is located) by clicking on this link to the Central Pacific Hurricane Center. Here’s atracking mapcovering both the eastern and central Pacific Ocean. A satellite image, which shows the entire ocean area between Hawaii and the Mexican coast…can be found here. Of course, as we know, our hurricane season won’t begin again until June 1st here in the central Pacific.
Aloha Paragraphs
The lovely island of Kauai…Makua Beach
The trade winds are picking up now, remaining breezy through the rest of this week…into next week.Looking at thisweather map, we see a pair of moderately strong high pressure systems, located generally to the north of our islands. As the winds are increasing now, small craft wind advisories have gone up in the coastal and channel waters around Maui and the Big Island. The computer models show the trade winds sticking around through the rest of this week…and likely right on into next week. This is very common as we finish off June, and head into the fully summer month of July.
Whatever showers that get carried our way on the trades…will end up on the windward sides primarily.Here’s an IRsatellite imageshowing a batch of clouds heading towards Kauai….and then off to the west of that island during the night. As thislooping radar imageof the islands shows as well, there were some showers near kauai. The leeward sides will remain dry, although the Kona slopes may get a few afternoon showers over the coffee plantations. Our weather in general will be on the dry side, with no organized showers heading our way at the moment.
The eastern Pacific Oceanhas no active tropical cyclones Tuesday night. Meanwhile, in the Gulf of Mexico we find that tropical storm Alex has recently become a category 1 hurricane in the western Gulf of Mexico…forecast to impact the Mexican coast Wednesday night or Thursday morning. Here’s the latest graphical track map…along with a satellite image. Otherwise, there are no active tropical cyclones elsewhere in the world.
It’s Tuesday evening as I begin writing this last section of today’s narrative update. As noted above, the trade winds have surged as expected. To get a sense of how strong they are as I finish off this work day, here’s the strongest gusts on each of the islands Tuesday evening:
These aren’t all that impressive, although are pretty solid for the evening hours. We saw some gusts today reaching 40 mph, and I’m quite sure there will be gusts above that mark on Wednesday and Thursday…probably right on into the upcoming holiday weekend. We have somehat drier air coming our way now, so that our shower activity, even on the windward sides, will be rather limited. ~~~ Here in Kihei before I leave for the drive upcountry to Kula, it’s clear to partly cloudy, a nice time to head down to some local beach, with perhaps a cocktail in hand, if you’re over 21 that is, to enjoy the sunset. I’ll be back early Wednesday morning with your next new weather narrative. I hope you have a great Tuesday night until then! Aloha for now…Glenn.
Extra:Asatellite loopof hurricane Alex…in the southwest Gulf of Mexico.
Interesting:Reducing the consumption of meat and dairy products and improving agricultural practices could decrease global greenhouse gas emissions substantially. By 2055 the emissions of methane and nitrous oxide from agriculture could be cut by more than eighty percent, researchers of the Potsdam Institute for Climate Impact Research find. The results of the modeling study have recently been published in the journal Global Environmental Change.
"Meat and milk really matter," says Alexander Popp of PIK. "Reduced consumption could decrease the future emissions of nitrous oxide and methane from agriculture to levels below those of 1995," explains the first author of the study. In the past, agricultural emissions of greenhouse gases, mainly methane and nitrous oxide, have increased steadily. In 2005 they accounted for 14 percent of total anthropogenic greenhouse gas emissions.
"Besides the conscious choice of food on the consumers’ side there are technical mitigation options on the producers’ side to reduce emissions significantly," says Popp. The researchers used a global land use model to assess the impact of future changes in food consumption and diet shifts, but also of technological mitigation options on agricultural greenhouse gas emissions up to 2055.
The global model combines information on population, income, food demand, and production costs with spatially explicit environmental data on potential crop yields. The calculations show that global agricultural non-carbon dioxide (non-CO2) emissions increase significantly until 2055 if food energy consumption and diet preferences remain constant at the level of 1995.
Taking into account changing dietary preferences towards higher value foods, like meat and milk, associated with higher income, emissions will rise even more. In contrast, reducing the demand for livestock products by 25 percent each decade from 2015 to 2055, leads to lower non-CO2 emissions even compared to 1995. Furthermore, there are technological mitigation options to decrease emissions significantly.
However, these technological mitigation options are not as effective as changes in food consumption. The highest reduction potential could be achieved by a combination of both approaches, the researchers report. Compared to a scenario that takes population growth and an increase in the demand for livestock products into account, emissions of methane and nitrous oxide could be cut by 84 percent in 2055.
However, livestock products are very valuable for nutrition as they contributed globally an average of one third of protein to dietary intakes in 2003. For many poor and undernourished people in the developing world who frequently suffer from protein deficiencies livestock products are important parts of food consumption. In contrast, less meat-oriented diets in the developed regions would have positive health effects, the authors note.
Agricultural, non-carbon dioxide non-CO2 greenhouse gas emissions consist mainly of methane and nitrous oxide. Nitrous oxide is about 300 and methane about 20 times more effective in trapping heat in the atmosphere than carbon dioxide. Agricultural emissions originate from the use of synthetic fertilizers on croplands and from flooded rice fields.
Because animal products require large amounts of fodder crops, livestock production is connected to higher emissions from fertilizer application. Additional livestock emissions occur due to manure excretion, management and application and methane producing microbes in ruminants’ digestive systems.
Interesting2:Cyclical changes in atmospheric pressure and sea surface temperature in the North Atlantic Ocean affect drought in the Sahel region on the southern Sahara rim. This has been revealed in an international study carried out by researchers from the University of Haifa, the French National Meteorological Service, Columbia University and the University of San Diego.
The study was published recently in the scientific journal Atmospheric Science Letters. That climate variability in one region can have an effect on more distant areas is known in the climate research literature — the challenge being to locate these far-connections and understand their projections.
The current study, co-authored by Dr. Shlomit Paz of the Department of Geography and Environmental Studies at the University of Haifa, analyzed a number of climate parameters in the North Atlantic over the 20th century, including atmospheric pressure at sea level and sea surface temperature.
They revealed two "natural climate signals": a multi-decadal signal of a period exceeding 40 years, and a quasi-decadal signal with periodicity ranging from 8 to 14 years. These two signals may cancel or enhance one another. In order to establish these findings, the scientists compared them with climactic fluctuations as observed in coral and tree-ring studies, by which the temperature values of the past few hundred years can be reconstructed.
The signals were identified in this case too. Next the researchers identified a correlation between the cyclical waves and droughts in the Sahel region: When the Atlantic Ocean cools, there are droughts in the region, and when the Ocean temperature rises, rain returns to the Sahel region. They also found that during drought periods in the Sahel, the force of hurricanes in the Atlantic drops; and vice versa.
This is not merely a theoretical study, Dr. Paz explains. The Sahel region suffered drought over more than 20 years, from the 1970s to the mi-1990s, which caused deep environmental and social crises, such as hunger, civilian desertion, ethnic conflicts, and more. In 2007 the UN published a report stating that the situation in Darfur was intensified by the ongoing drought in the Sahel region and its surroundings.
This study contributes to information availability for climatic models, thereby improving their prediction capability. The researchers are currently investigating whether current human activity has an impact on these phenomena and are examining the effects of the signals on today’s climate in Europe. They note that the thermal imbalance caused by urban development makes the research more challenging.
"Today we are able to gain a better understanding of how the oceans play an important role in the earth’s ‘climate memory’. Once we become familiar with the natural signals, we will be able to better understand how the human factor correlates with climate," Dr. Paz states.
Air Temperatures ranged between these warmest and coolest spots near sea level around – and on the highest mountains…as of 5pm Monday evening:
Kahului, Maui – 83
Lihue, Kauai – 78
Haleakala Crater – 55 (near 10,000 feet on Maui)
Mauna Kea summit – 46 (near 14,000 feet on the Big Island)
Precipitation Totals–The following numbers represent the largest precipitation totals (inches) during the last 24 hours on each of the major islands, as ofMonday afternoon:
0.36 Puu Lua, Kauai 1.15 Oahu Forest NWR, Oahu
0.00 Molokai
0.00 Lanai
0.00 Kahoolawe
0.25 Kepuni, Maui 1.24 Piihonua, Big Island
Marine Winds – Here’s the latest (automatically updated)weather mapshowing two near 1031 millibar high pressure systems generally to the north of the islands. Trade winds gradually increasing later Tuesday into Wednesday. Satellite and Radar Images:To view the cloud conditions we have here in Hawaii, please use the following satellite links, starting off with thisInfrared Satellite Imageof the islands to see all the clouds around during the day and night. This next image is one that gives close images of the islands only during the daytime hours, and is referred to as aClose-up visible image. This next image showsa larger view of the Pacific…giving perspective to the wider ranging cloud patterns in the Pacific Ocean. Finally, here’s aLooping IR satellite image, making viewable the clouds around the islands 24 hours a day. To help you keep track of where any showers may be around the islands, here’s the latest animatedradar image.
Hawaii’s Mountains – Here’s a link to the live webcam on the summit of near 14,000 foot Mauna Kea on the Big Island of Hawaii. The tallest peak on the island of Maui is the Haleakala Crater, which is near 10,000 feet in elevation. These two webcams are available during the daylight hours here in the islands…and when there’s a big moon rising just after sunset for an hour or two! Plus, during the nights and early mornings you will be able to see stars, and the sunrise too…depending upon weather conditions. Tropical Cyclone activity in the eastern and central Pacific– Here’s the latest weather information coming out of theNational Hurricane Center, covering the eastern north Pacific. You can find the latest tropical cyclone information for the central north Pacific (where Hawaii is located) by clicking on this link to the Central Pacific Hurricane Center. Here’s atracking mapcovering both the eastern and central Pacific Ocean. A satellite image, which shows the entire ocean area between Hawaii and the Mexican coast…can be found here. Of course, as we know, our hurricane season won’t begin again until June 1st here in the central Pacific.
Aloha Paragraphs
East side of windward Maui…Hana
Lighter than usual trade winds remained active Monday…although will be increasing in strength Tuesday onwards.Looking at thisweather map, we see two moderately strong high pressure systems, located generally to the north of our islands. As the winds are lighter than usual now, there are still no wind advisories posted anywhere in Hawaiian coastal or channel waters. Whatever volcanic haze that has been around the last 24 hours or so, should be ventilated away by Tuesday. As the trades pick up soon, we’ll see small craft wind advisories going up over those windiest waters around Maui and the Big Island later Tuesday or Wednesday. The computer models show the trade winds sticking around through the rest of this week…and likely right on into next week.
There will continue to be some showers around…which will remain active along the windward sides.The showers recently have been enhanced by an upper level trough of low pressure, especially over Oahu. Here’s a IRsatellite imageto check out the clouds around the islands. It shows just a few clouds draped across the windward sides of the islands around Oahu. As thislooping radar imageof the Hawaiian Islands points out, there were some showers converging around the northern islands, from Oahu up towards Kauai. We should see some increase in showers around the Big Island tonight into Tuesday morning, which will be the leftover moisture from retired tropical cyclone Blas…which could spread up towards Maui and Molokai perhaps.
The eastern Pacific Ocean has just one active tropical cyclone Monday night. Thissatellite imageshows dissipating tropical depression Celia, while tropical depression Darby has dissipated. Celia continues to head generally towards the west, while Darby is heading towards the Mexican coast…as shown on thisgraphical track map. Neither of these storms are any danger to the Hawaiian Islands. Meanwhile, in the Gulf of Mexico we find that tropical storm Alex has increased back into a tropical storm…likely reaching hurricane strength before impacting the Mexican coast Wednesday night. There’s still that chance that Alex may impact the Texas coast around Brownsville. Here’s the latest graphical track map…along with a satellite image.
It’s Monday evening as I begin writing this last section of totday’s narrative update. As noted above, we’re at the tail-end of a short period of lighter than normal winds, which will be taking off again Tuesday onwards. These stronger trade winds will continue to blow through the rest of this week. By the way, Kahului, Maui reached 90F degrees Monday afternoon! Checking in with the record book, we see that this hot day missed the highest maximum temperature by a full 2 degrees…which occurred back in 1969. ~~~ Here in Kihei, Maui, its partly cloudy, and still mildly hazy, although the recent bout of vog is trying to clear…under the influence of the strengthening trade winds Monday evening. I’ll be heading upcountry soon, heading home to Kula in a few minutes. To get a sense of how strong or light the trade winds are now, here’s the strongest gusts on each of the islands at around 5pm Monday evening:
I’ll look forward to catching up with you early Tuesday morning, with your next new weather narrative from paradise. I hope you have a great Monday night until then! Aloha for now…Glenn.
Interesting:Two prominent climate experts, including one from the University of Arizona, are calling for a "no-regrets" strategy for planning for a hotter and drier western North America. Their advice: use water conservatively and continue developing ways to harness energy from the sun, wind and Earth.
Jonathan Overpeck, principal investigator with the Climate Assessment for the Southwest at the UA, and Bradley Udall, director of the Western Water Assessment at the University of Colorado, write in the June 25 issue of the journal Science that such an approach is necessary for coping with a wide range of projected future climate changes in the West and Southwest.
In their overview of shifting climate in the region, Overpeck and Udall cite published findings of prevalent signs of change: rising temperatures, earlier snowmelt, northward-shifting winter storms, increasing precipitation intensity and flooding, record-setting drought, plummeting Colorado River reservoir storage, widespread vegetation mortality and more large wildfires.
"The West, and especially the Southwest, is leading the nation in climate change — warming, drying, less late-winter snowpack and drought — as well as the impacts of this change," said Overpeck, a UA professor of geosciences and atmospheric sciences and co-director of the Institute of the Environment.
In the past 10 years, temperatures in almost all areas in western North America have surpassed the 20th century average, many by more than 1 or even 2 degrees Fahrenheit. The warming has decreased late-season snowpack, which serves as a water reservoir, as well as the annual flow of the Colorado River, the researchers said.
Those reductions, combined with the worst drought observed since 1900, haven’t helped matters; water storage in Lakes Powell and Mead, the largest southwestern water reservoirs, fell nearly 50 percent between 1999 and 2004 and has not risen significantly since.
In addition to water, vegetation is feeling the effects of climate change. Work by UA’s David Breshears and colleagues have already showed that more than 1 million hectares of piñon pine have died in the Southwest in the last few decades from a lethal combination of record-high temperatures and uncommonly severe drought. In addition, the frequency of large wildfires has increased as snowpack has decreased.
While researchers are confident that the higher temperatures and resulting changes in snowpack, Colorado River flow, vegetation mortality and wildfires are human-caused, they don’t know whether the drought that has plagued the West for the last 10 years — the worst since record-keeping began — is because of humans, Overpeck said.
"It’s critical to determine the causes of the observed change, including the drought, because then we will have a much improved ability to say what’s coming next, in the future," Overpeck said.
To complicate issues, studies published to date suggest that Colorado River flow could continue to decrease by 20 percent by 2050, with severe implications for cities served by Colorado River water and for agricultural production.
"One thing is for sure," Overpeck said. "The best strategy now — the no-regrets strategy — is to prepare for a hotter and drier West, Southwest and Arizona, and to make sure we don’t commit water to things now in ways that could make water shortages in the future more difficult to deal with."
Fortunately, Overpeck said, scientists have a better understanding about potential future climate change in western North America than for many other regions around the globe, making it easier for policy makers to plan coping strategies. The researchers also point to the region’s potential wealth of solar, wind and geothermal renewable energy production.
"That offers a way to make up economically for the costs that will be incurred in adapting to the warmer, drier conditions," Overpeck said. "And it will have the side benefit of decreasing the chances, through reducing greenhouse gas emissions, for potentially greater human-caused climate change."
Interesting2:Even though freshwater concentrations of mercury are far greater than those found in seawater, it’s the saltwater fish like tuna, mackerel and shark that end up posing a more serious health threat to humans who eat them. The answer, according to Duke University researchers, is in the seawater itself. The potentially harmful version of mercury — known as methylmercury — latches onto dissolved organic matter in freshwater, while it tends to latch onto chloride — the salt — in seawater, according to new a study by Heileen Hsu-Kim, assistant professor of civil and environmental engineering at Duke’s Pratt School of Engineering.
"The most common ways nature turns methylmercury into a less toxic form is through sunlight," Hsu-Kim said. "When it is attached to dissolved organic matter, like decayed plants or animal matter, sunlight more readily breaks down the methylmercury. However, in seawater, the methlymercury remains tightly bonded to the chloride, where sunlight does not degrade it as easily. In this form, methylmercury can then be ingested by marine animals."
Methylmercury is a potent neurotoxin that can lead to kidney dysfunctions, neurological disorders and even death. In particular, fetuses exposed to methylmercury can suffer from these same disorders as well as impaired learning abilities. Because fish and shellfish have a natural tendency to store methylmercury in their organs, they are the leading source of mercury ingestion for humans.
"The exposure rate of mercury in the U.S. is quite high," Hsu-Kim said. "A recent epidemiological survey found that up 8 percent of women had mercury levels higher than national guidelines. Since humans are on the top of the food chain, any mercury in our food accumulates in our body."
The results of Hsu-Kim’s experiments, which have been published early online in the journal Nature Geoscience, suggest that scientists and policymakers should focus their efforts on the effects of mercury in the oceans, rather than freshwater. Her research is supported by the National Institute of Environmental Health Science.
In the past, most of the scientific studies of effects of mercury in the environment have focused on freshwater, because the technology had not advanced to the point where scientists could accurately measure the smaller concentrations of mercury found in seawater.
Though the concentrations may be smaller in seawater, mercury accumulates more readily in the tissues of organisms that consume it. "Because sunlight does not break it down in seawater, the lifetime of methlymercury is much longer in the marine environment," Hsu-Kim said. "However, the Food and Drug Administration and the Environmental Protection Agency do not distinguish between freshwater and seawater."
Mercury enters the environment through many routes, but the primary sources are coal combustion, the refinement of gold and other non-ferrous metals, and volcanic eruptions. The air-borne mercury from these sources eventually lands on lakes or oceans and can remain in the water or sediments.
The key to the sun’s ability to break down methylmercury is a class of chemicals known as reactive oxygen species. These forms of oxygen are the biochemical equivalent of the bull in the china shop because of the way they break chemical bonds. One way these reactive oxygens are formed is by sunlight acting on oxygen molecules in the water.
"These reactive forms of oxygen are much more efficient in breaking the bonds within the methylmercury molecule," Hsu-Kim said. "And if the methylmercury is bonded to organic matter instead of chloride, then the break down reaction is much faster."
Interesting3:Life is confusing. When buying a product one has to consider whether it is green, inexpensive, actually works, and so forth and so on. There is also the life cycle of the product to consider. Is the product beneficial to the environment in the long run? For example, Marcal Manufacturing has just introduced new packaging to all of its Small Steps brand products this week, which places an environmental facts panel on the front of all product packaging.
The panel resembles a nutrition label for food products and highlights the environmental performance of its 100% recycled paper products. The Environmental Facts label includes information about the company’s use of recycled content (100%), how much chlorine bleach was used for whitening the paper products (0%) and the quantities of chemical additives such as fragrance and dyes (0%).
The packaging has just completed a nationwide roll out to grocery, drug, convenience and other major retail outlets. Many products claim to be good for the environment. The problem lies with our measure it and then prove it.
Some common principles to consider in determining whether a product is sustainable are as follows: Low environmental impact materials: choose non-toxic, sustainably produced or recycled materials which require little energy to process Energy efficiency: use manufacturing processes and produce products which require less energy Quality and durability: longer lasting and better functioning products will have to be replaced less frequently, reducing the impacts of producing replacements Design Impact Measures for total carbon footprint and life cycle assessment for any resource used are increasingly required and available.
Many are complex, but some give quick and accurate whole earth estimates of impacts. Marcal claims that it is the first in the industry to offer this level of transparency on product packaging. Yet unless all use the same comparisons, one cannot compare side by side.
Air Temperatures ranged between these warmest and coolest spots near sea level around – and on the highest mountains…as of 5pm Sunday evening:
Port Allen, Kauai – 86
Hilo, Hawaii – 78
Haleakala Crater – 55 (near 10,000 feet on Maui)
Mauna Kea summit – 45 (near 14,000 feet on the Big Island)
Precipitation Totals–The following numbers represent the largest precipitation totals (inches) during the last 24 hours on each of the major islands, as ofSunday afternoon:
3.51 Mount Waialeale, Kauai 0.30 Palehua, Oahu
0.11 Molokai
0.00 Lanai
0.00 Kahoolawe
0.38 Oheo Gulch, Maui
0.08 Kaupulehu, Big Island
Marine Winds – Here’s the latest (automatically updated)weather mapshowing two near 1032 millibar high pressure systems far to the north and northwest of the islands. Trade winds gradually increasing later Monday or Tuesday. Satellite and Radar Images:To view the cloud conditions we have here in Hawaii, please use the following satellite links, starting off with thisInfrared Satellite Imageof the islands to see all the clouds around during the day and night. This next image is one that gives close images of the islands only during the daytime hours, and is referred to as aClose-up visible image. This next image showsa larger view of the Pacific…giving perspective to the wider ranging cloud patterns in the Pacific Ocean. Finally, here’s aLooping IR satellite image, making viewable the clouds around the islands 24 hours a day. To help you keep track of where any showers may be around the islands, here’s the latest animatedradar image.
Hawaii’s Mountains – Here’s a link to the live webcam on the summit of near 14,000 foot Mauna Kea on the Big Island of Hawaii. The tallest peak on the island of Maui is the Haleakala Crater, which is near 10,000 feet in elevation. These two webcams are available during the daylight hours here in the islands…and when there’s a big moon rising just after sunset for an hour or two! Plus, during the nights and early mornings you will be able to see stars, and the sunrise too…depending upon weather conditions. Tropical Cyclone activity in the eastern and central Pacific– Here’s the latest weather information coming out of theNational Hurricane Center, covering the eastern north Pacific. You can find the latest tropical cyclone information for the central north Pacific (where Hawaii is located) by clicking on this link to the Central Pacific Hurricane Center. Here’s atracking mapcovering both the eastern and central Pacific Ocean. A satellite image, which shows the entire ocean area between Hawaii and the Mexican coast…can be found here. Of course, as we know, our hurricane season won’t begin again until June 1st here in the central Pacific.
Aloha Paragraphs
Leeward Maui…Wailea
Lighter than normal winds will remain around through Monday…then increasing in strength Tuesday onwards. Looking at this weather map, we see two moderately strong high pressure systems positioned far to the north and northwest. As the winds are lighter than usual now, we’ll continue to see advisory free conditions across our coastal and channel waters at the start of the new work week. It appears that some areas have been exposed to light southeast winds, which allowed some volcanic haze to form locally. As the trades pick up over the next several days, we’ll see small craft wind advisories going up over those windiest waters around Maui and the Big Island Tuesday or Wednesday.
The best chance of showers will be focused over Kauai…although the other islands will get some showers here and there too.The showers recently have been enhanced by an upper level trough of low pressure, especially over Kauai and to some extent the Big Island locally as well. Here’s an IRsatellite imageto check out the clouds around the islands. It shows a fair amount of clouds draped across the islands. As thislooping radar imageof the Hawaiian Islands points out, there are some showers around into Sunday night. We may see some increase in showers in the southern Big Island later Monday into Tuesday…which will be the leftover moisture from retired tropical cyclone Blas.
The eastern Pacific Ocean has two active tropical cyclones Sunday evening.Thissatellite imageshows dissipating tropical storm Celia, along with weakening tropical storm Darby as well. Celia continues to head generally towards the west, while Darby is heading towards the Mexican coast…as shown on thisgraphical track map. Neither of these storms are any danger to the Hawaiian Islands. Meanwhile, in the west Caribbean, we find the first tropical storm of the 2010 season, which has taken on the name Alex. This tropical storm had weakened, due to its interaction with Belize. It’s now increased back into a tropical storm…likely reaching hurricane strength before impacting the Mexican coastline.
It’s Sunday evening as I begin writing this last section of today’s narrative update. As noted above, our winds remain on the lighter side of normal for the time being. At the same time, we’ll see somewhat more than the normal amount of shower activity, especially near Kauai, and perhaps the Kau District of the Big Island. I was somewhat surprised to see how voggy it is here on Maui, with poor air visibilities Sunday evening. We had the quickest little shower this afternoon here in Kula, which lasted maybe 5-10 minutes at most. I had just brought my clothes in from drying on the line, as it got so dark just before the moisture arrived. I made a red sauce this afternoon, using organic egg plant, okra, mushrooms, onions, garlic, zucchini, tomatoes and basil. I’ll plate this after cooking pasta when I get home each evening during the upcoming work week. I’ll be back here early Monday morning with your next new weather narrative. I hope you have a great Sunday night until then! Aloha for now…Glenn.
Air Temperatures ranged between these warmest and coolest spots near sea level around – and on the highest mountains…as of 6pm Saturday evening:
Kahului, Maui – 82
Hilo, Hawaii – 77
Haleakala Crater – 50 (near 10,000 feet on Maui)
Mauna Kea summit – 41 (near 14,000 feet on the Big Island)
Precipitation Totals–The following numbers represent the largest precipitation totals (inches) during the last 24 hours on each of the major islands, as ofSaturday evening:
2.89 Mount Waialaele, Kauai 1.72 Moanalua RG, Oahu
0.13 Molokai
0.00 Lanai
0.00 Kahoolawe
0.11 Kula, Maui
0.09 Hilo airport, Big Island
Marine Winds – Here’s the latest (automatically updated)weather mapshowing two near 1030 millibar high pressure systems to the northeast and northwest of the islands. Trade winds gradually increasing later Sunday into Monday. Satellite and Radar Images:To view the cloud conditions we have here in Hawaii, please use the following satellite links, starting off with thisInfrared Satellite Imageof the islands to see all the clouds around during the day and night. This next image is one that gives close images of the islands only during the daytime hours, and is referred to as aClose-up visible image. This next image showsa larger view of the Pacific…giving perspective to the wider ranging cloud patterns in the Pacific Ocean. Finally, here’s aLooping IR satellite image, making viewable the clouds around the islands 24 hours a day. To help you keep track of where any showers may be around the islands, here’s the latest animatedradar image.
Hawaii’s Mountains – Here’s a link to the live webcam on the summit of near 14,000 foot Mauna Kea on the Big Island of Hawaii. The tallest peak on the island of Maui is the Haleakala Crater, which is near 10,000 feet in elevation. These two webcams are available during the daylight hours here in the islands…and when there’s a big moon rising just after sunset for an hour or two! Plus, during the nights and early mornings you will be able to see stars, and the sunrise too…depending upon weather conditions. Tropical Cyclone activity in the eastern and central Pacific– Here’s the latest weather information coming out of theNational Hurricane Center, covering the eastern north Pacific. You can find the latest tropical cyclone information for the central north Pacific (where Hawaii is located) by clicking on this link to the Central Pacific Hurricane Center. Here’s atracking mapcovering both the eastern and central Pacific Ocean. A satellite image, which shows the entire ocean area between Hawaii and the Mexican coast…can be found here. Of course, as we know, our hurricane season won’t begin again until June 1st here in the central Pacific.
As we move through this weekend, our winds will be picking up again into the new work week ahead.Looking at this most recent weather map, we see two moderately strong high pressure systems aligned to the northwest, through the northeast of the islands. An area of low pressure has weakened our trade winds a little this week, although as the trough moves away to the west…our winds will gradually be picking up going forward.
The best chance of showers this weekend will be focused over Kauai and Oahu…although the other islands will get some showers here and there too.Today’s locally generous showers were prompted by the arrival of an old cold front, which brought its showers to bear here and there. Here’s an IRsatellite imageto check out the clouds around the islands. It shows several bands of clouds draped across the leeward sides of the islands. As thislooping radar imageof the Hawaiian Islands points out, most of the rainfall is concentrating across Kauai and Oahu.
If we check out this IRsatellite imageof the whole central Pacific, we see an area of high cirrus clouds to the west and east of the islands.
The eastern Pacific Ocean has two active tropical cyclones Saturday.Thissatellite imageshows dissipating tropical storm Celia, along with tropical storm Darby. Celia continues to head generally towards the west, while Darby is sticking closer to the Mexican coast…as shown on thisgraphical track map. Celia has peaked in strength, and will be on a weakening trend through the remainder of its life cycle in the eastern Pacific. Meanwhile, Darby will be gradually losing strength through the next several days. Neither of these hurricanes are any danger to the Hawaiian Islands…here in the central Pacific. Meanwhile, in the west Caribbean, we find the first tropical storm of the 2010 season, called 01L, which has taken on the name Alex. It is moving Belize, and then into mainland Mexico thereafter…after crossing the southwestern part of the Gulf of Mexico as perhaps a hurricane briefly.
It’s Saturday as I begin writing this last section of today’s narrative update. As noted above, our trade winds remain on the lighter side of normal for the time being. At the same time, we’ll see an area of moisture riding in from the northeast. This moisture source will come under the influence of an upper level low pressure system, which has enhanced it somewhat…providing some localized rainfall to the state. Some of these showers turned out to be locally quite generous, especially on Kauai and Oahu.
~~~ Friday evening I saw the new film called Knight and Day (2010), starring Tom Cruise and Cameron Diaz…among others. I liked this film lots, and not just because it was another one of those countless action flicks that I regularly see. I happen to like Tom and Cameron, they are both good actors, and they were well suited to play together. It was a fast paced film, which I enjoyed of course. There were all the usual stunts, and shootings, and other special effects, which held my attention closely. The synopsis: Tom Cruise stars as an international super spy who accidentally gets involved with Cameron Diaz, an ordinary, everyday woman.
I would give it a good solid B grade, and would recommend it to those of you who like this sort of thing. Here’s the trailer for this film if you have any interest…I think most of you would enjoy seeing it.
~~~ It’s Saturday evening here in Kula, Maui, and quite cloudy. The air temperature was 64.4F degrees at 725pm. It rained here in Kula this afternoon, and turned out to be the wettest place on the island of Maui today, which isn’t common. I joined some friends for a half day of zen meditation in Haiku today, which was nice. I then drove over to a friend’s house who lives in Haiku as well, where she made me a late lunch, and a cup of coffee. We sat around and talked, and ended up cutting down a stalk of apple bananas. I wasn’t able to resist heading down to Baldwin Beach after that, for some time in the sun…and of course a nice swim in the warm ocean. Shopping was my next thing, before getting a take out dinner at my favorite Vietnamese restaurant in Paia. I’ll catch up with you again Sunday morning. I hope you have a great Saturday night until then, and check out that still very large moon tonight if its clear where you are! Aloha for now…Glenn.
Air Temperatures ranged between these warmest and coolest spots near sea level around – and on the highest mountains…as of 5pm Friday evening:
Port Allen, Kauai – 86
Hilo, Hawaii – 77
Haleakala Crater – 57 (near 10,000 feet on Maui)
Mauna Kea summit – 43 (near 14,000 feet on the Big Island)
Precipitation Totals–The following numbers represent the largest precipitation totals (inches) during the last 24 hours on each of the major islands, as ofFriday afternoon:
0.76 Mount Waialaele, Kauai
0.92 Moanalua RG, Oahu
0.11 Molokai
0.00 Lanai
0.00 Kahoolawe
0.17 West Wailuaiki, Maui
0.38 Kawainui Stream, Big Island
Marine Winds – Here’s the latest (automatically updated)weather mapshowing a 1032 millibar high pressure system to the north of the islands….moving west. Trade winds gradually dropping in strength Saturday into Sunday. Satellite and Radar Images:To view the cloud conditions we have here in Hawaii, please use the following satellite links, starting off with thisInfrared Satellite Imageof the islands to see all the clouds around during the day and night. This next image is one that gives close images of the islands only during the daytime hours, and is referred to as aClose-up visible image. This next image showsa larger view of the Pacific…giving perspective to the wider ranging cloud patterns in the Pacific Ocean. Finally, here’s aLooping IR satellite image, making viewable the clouds around the islands 24 hours a day. To help you keep track of where any showers may be around the islands, here’s the latest animatedradar image.
Hawaii’s Mountains – Here’s a link to the live webcam on the summit of near 14,000 foot Mauna Kea on the Big Island of Hawaii. The tallest peak on the island of Maui is the Haleakala Crater, which is near 10,000 feet in elevation. These two webcams are available during the daylight hours here in the islands…and when there’s a big moon rising just after sunset for an hour or two! Plus, during the nights and early mornings you will be able to see stars, and the sunrise too…depending upon weather conditions. Tropical Cyclone activity in the eastern and central Pacific– Here’s the latest weather information coming out of theNational Hurricane Center, covering the eastern north Pacific. You can find the latest tropical cyclone information for the central north Pacific (where Hawaii is located) by clicking on this link to the Central Pacific Hurricane Center. Here’s atracking mapcovering both the eastern and central Pacific Ocean. A satellite image, which shows the entire ocean area between Hawaii and the Mexican coast…can be found here. Of course, as we know, our hurricane season won’t begin again until June 1st here in the central Pacific.
Aloha Paragraphs
Localized showers into the weekend
As we move into the weekend, our winds will become lighter.Looking at this most recent weather map, we see a moderately strong 1032 millibar high pressure system to the north of the islands…moving towards the west slowly. A part of the weakening of our local trade winds, will be caused by the arrival of an upper level low pressure system. As this colder air aloft arrives, we will see this down shifting of the trade winds. This upper low should also increase the height of the clouds, which would enhance whatever showers that are falling from their bases. As this upper air feature glides away early in the new week ahead, our weather will snap back into what looks to be…yet another week of fairly normal early summer conditions for our islands.
This easing up of the trade winds won’t last long, as the trade winds are expected to increase again right after the weekend.This is the time of year when light winds aren’t common, so that it will be a brief period. The best chance of showers between now and Sunday, would be in two parts for the state, with Maui County getting the short end of the stick perhaps. The first opportunity for showers will have to do with the arrival of an old cold front, which will bring in the needed moisture for showers. This first area of showers would then move away downstream, likely by Sunday according to the models. The second chance of increased showers would be associated with whatever is left of old tropical cyclone Blas, traveling in the trade wind flow from the east. The chances aren’t all that high, although the models show this minor blob of moisture just clipping the southern part of the Big Island.
Here’s an IRsatellite imageto check out the clouds around the islands.
The eastern Pacific Ocean has two active tropical cyclones Friday night.Thissatellite imageshows hurricane Celia, along with hurricane Darby, to the east of Celia. Celia continues to head generally towards the west, while Darby is sticking close to the Mexican coast…as shown on thisgraphical track map. Celia has peaked in strength, and will be on a weakening trend through the remainder of its life cycle in the eastern Pacific. Meanwhile, Darby will peak soon, and be gradually losing strength through the next week. Neither of these hurricanes are any danger to the Hawaiian Islands…here in the central Pacific. Meanwhile, in the west Caribbean, we find the first tropical depression of the 2010 season, called 01L…which will take the name Alex, as it moves toward the Yucatan Peninsula of Mexico. The concern of course is what influence the storm will have once it gets into the Gulf of Mexico, and where it will go. Here’s the latest track map, and a satellite image of this area.
It’s Friday evening as I begin writing this last section of today’s narrative update. As noted above, our trade winds will be weaker this weekend. At the same time, we’ll see an area of moisture riding in from the northeast. This moisture source will come under the influence of an upper level low pressure system, which will enhance it somewhat…providing some localized rainfall to the state into the weekend. ~~~ Since its Friday, and the weekend starts for this Maui weatherman, I headed over to see a new film in Kahului. I thought I was going to see Jonah Hex (2010) starring James Brolin and Megan Fox…among others. The synopsis reads like this: A scarred bounty hunter is charged with tracking down his oldest enemy, who is preparing to unleash hell. I’m not all that sure what that means exactly, but I’ll take it as an action film for sure! Oops, I just checked the ratings this film is getting, and they don’t look that good, with a C grade from both the critics and the viewers.
~~~ As it turned out, I changed my mind, and saw instead the new film called Knight and Day (2010), starring Tom Cruise and Cameron Diaz…among others. It’s now almost 11pm, and I just got home from seeing it. I actually liked it lots, and not just because it was another of those numerous action flicks that I so regularly see. I happen to like Tom and Cameron, they are both good actors, and they were well suited to play together. It was a fast paced film, which I enjoyed of course. There were all the usual stunts, and shootings, and other special effects, which held my attention closely. The synopsis: Tom Cruise stars as an international super spy who accidentally gets involved with Cameron Diaz, an ordinary, everyday woman.
I would give it a good solid B grade, and would recommend it to those of you who like this sort of thing. Here’s the trailer for this film if you have any interest…I think most of you would enjoy seeing it.
~~~ I’ll be back early Saturday morning with your next new weather narrative. I hope you have a great Friday night until then! Aloha for now…Glenn.
Extra:Friday night is the June full moon, and a partial lunar eclipse, which begins at 12:16am Saturday morning, peaking at 1:38am…ending at 3am!
Air Temperatures ranged between these warmest and coolest spots near sea level around – and on the highest mountains…as of 5pm Thursday evening:
Barking Sands, Kauai – 85
Hilo, Hawaii – 74
Haleakala Crater – 55 (near 10,000 feet on Maui)
Mauna Kea summit – 46 (near 14,000 feet on the Big Island)
Precipitation Totals–The following numbers represent the largest precipitation totals (inches) during the last 24 hours on each of the major islands, as ofThursday afternoon:
0.53 Mount Waialaele, Kauai 0.34 Oahu Forest NWR, Oahu
0.01 Molokai
0.00 Lanai
0.00 Kahoolawe
1.32 West Wailuaiki, Maui 1.94 Waiakea Uka, Big Island
Marine Winds – Here’s the latest (automatically updated)weather mapshowing a 1031 millibar high pressure system to the north of the islands. Our trade winds will become lighter going into the weekend. Satellite and Radar Images:To view the cloud conditions we have here in Hawaii, please use the following satellite links, starting off with thisInfrared Satellite Imageof the islands to see all the clouds around during the day and night. This next image is one that gives close images of the islands only during the daytime hours, and is referred to as aClose-up visible image. This next image showsa larger view of the Pacific…giving perspective to the wider ranging cloud patterns in the Pacific Ocean. Finally, here’s aLooping IR satellite image, making viewable the clouds around the islands 24 hours a day. To help you keep track of where any showers may be around the islands, here’s the latest animatedradar image.
Hawaii’s Mountains – Here’s a link to the live webcam on the summit of near 14,000 foot Mauna Kea on the Big Island of Hawaii. The tallest peak on the island of Maui is the Haleakala Crater, which is near 10,000 feet in elevation. These two webcams are available during the daylight hours here in the islands…and when there’s a big moon rising just after sunset for an hour or two! Plus, during the nights and early mornings you will be able to see stars, and the sunrise too…depending upon weather conditions. Tropical Cyclone activity in the eastern and central Pacific– Here’s the latest weather information coming out of theNational Hurricane Center, covering the eastern north Pacific. You can find the latest tropical cyclone information for the central north Pacific (where Hawaii is located) by clicking on this link to the Central Pacific Hurricane Center. Here’s atracking mapcovering both the eastern and central Pacific Ocean. A satellite image, which shows the entire ocean area between Hawaii and the Mexican coast…can be found here. Of course, as we know, our hurricane season won’t begin again until June 1st here in the central Pacific.
Aloha Paragraphs
Decreasing trade winds…increased chance of localized showers
Trade winds will continue Thursday night, before backing off some Friday into the weekend…strengthening again early in the new week ahead.The small craft wind advisories have been pared back to only the major channels in the southern half of the state…and in a few isolated coastal waters around Maui and the Big Island Thursday night. This latest weather mapshows a moderately strong 1031 millibar high pressure system to the north of the Hawaiian Islands…the source of our current trade winds. As the trade winds ease up over the next 2-3 days, we’ll begin to feel at least somewhat muggy during the days, with chance of some afternoon interior showers along our leeward sides this weekend.
An old cold front will bring some added showers to the windward sides of Kauai and Oahu Friday and Saturday…and then an old tropical cyclone may bring an increase in showers to the Big Island end of the island chain Sunday and Monday.As this IRsatellite imageshows, most of the lower level clouds are upstream of the windward sides this evening.This looping radar imageshows scattered showers moving by to the south of the Big Island, although a few will fall elsewhere. Thislarger viewof the central Pacific shows thunderstorms far to the southwest of the islands. An area of high cirrus clouds are being carried our way from the west…on the upper winds aloft.
The eastern Pacific Ocean has two active tropical cyclones Thursday night.Thissatellite imageshows major hurricane Celia, along with hurricane Darby, to the east of Celia. Celia continues to head generally towards the west, while Darby is trying to do a circle…as shown on thisgraphical track map. Celia has become a major hurricane, with sustained winds of 160 mph, and gusts to near 195 mph! This makes intense hurricane Celia a category 5 hurricane, fortunately it is well away from any land. Meanwhile, Darby remains a hurricane near Mexico for the next several days. Neither of these hurricanes pose any danger to the Hawaiian Islands…here in the central Pacific.
It’s Thursday evening as I begin writing this last section of today’s narrative update. The trade winds peaked in strength on Wednesday, and started to come down in speed today. As the numbers below show, we still have some strong gusts continuing into the evening, although they are considerably lighter now than over the last few days: Kauai – 35 mph Oahu – 31 Molokai – 28
Lanai – 33 Kahoolawe – 24
Maui – 38 Big Island 33
Here in Kihei, Maui this evening, it’s clear to partly cloudy in general. There are still those clouds hugging the windward sides along the windward sides, after having showers last night. Glancing over towards the leeward sides, in Kihei and Lahaina, it looks clear. As noted above, the trade winds will become considerably lighter by the weekend. As this happens, our atmosphere will become muggy, and perhaps even hazy. The trade winds will rebound after the weekend, and blow the haze and humidity away. We’re may get lucky in the precipitation department, hopefully. The Kauai end of the island chain is forecast to see some increase in showers Friday into Saturday. Then, the Big Island side of the islands may receive the leftover showers from former tropical cyclone Blas as we move into Sunday and Monday. If these showers arrive as expected, it would be a boon for Maui and the Big Island, as these islands are so dry now. I’ll be back here again early Friday morning with your next new weather narrative from paradise. I hope you enjoy your Thursday night until then! Aloha for now…Glenn.
Interesting: It is getting more and more difficult to deny that global warming is occurring. The National Oceanic and Atmospheric Administration (NOAA) released a report recently about the state of the global climate, and the results were not pretty. It turns out the combined global land and ocean surface temperatures set a record in May. In fact, from March to May, it was the hottest spring on record. Furthermore, the whole first half of the year, from January to May was also the warmest on record.
In May, land and ocean temperatures were 1.24 degrees Fahrenheit (F) above the twentieth century average of 58.6 F. Land surface alone was 1.87 F above the average, and the oceans were 0.99 F above average. Most parts of the planet felt these warmer temperatures. The greatest anomalies were in eastern North America, eastern Brazil, Eastern Europe, south Asia, eastern Russia, and equatorial Africa.
Several spots that saw cooler temperatures were western North America, northern Argentina, interior Asia, and Western Europe. These temperature differences also occurred throughout the whole spring. Combined land and ocean temperatures were 1.31 F above the average. Land surface alone was 2.2 F above average, and ocean surface was 0.99 F above the average. Regionally high temperatures occurred in northern North America, northern Africa, Eastern Europe, south Asia, and parts of Australia, especially Tasmania.
The northeastern United States had its hottest spring on record. On the other hand, cooler temperatures were found in the western US and East Asia. Plus, Western Europe saw one of the driest springs on record. To add to the global climate woe, ice caps and glaciers have been melting more rapidly. Arctic sea ice had its smallest May footprint since records began in 1979. It melted fifty percent faster than its average May melting rate.
However, Antarctic sea ice cover extended to 7.3% above its May average. In the northern hemisphere, snow cover was at a record low. This includes the northern parts of North America and Eurasia, including Greenland. It seems like setting new high temperatures is the norm these days.
Efforts should be made to slow down global warming. But at the same time, people all over the world will have to adapt to a changing planet. There is a chance that our best efforts may not be enough to stop this cycle from continuing into the foreseeable future.
Interesting2:Earthquakes are often imagined as opening up large gaps in the land, sinking islands and the such. It is much harder in real life to see this change. NASA has recently released the first ever airborne radar images of the deformation in Earth’s surface caused by a major earthquake — the magnitude 7.2 temblor that rocked Mexico’s state of Baja California and parts of the American Southwest on April 4, 2010.
The data reveal that in the area studied, the quake moved the Calexico, Calif., region in a downward and southerly direction up to 31 inches. The Calexico earthquake was the third major quake to rattle the western hemisphere in less than three months in April 2010. The quake was more powerful than the 7.0 earthquake in Haiti. It was also a relatively shallow earthquake, at six miles underground, meaning there was less earth to absorb the shaking.
The quake affected about 20 million people primarily from being shaken and rattled. It is difficult to measure how much deformation occurs after an earthquake. Traditionally it requires detailed land based surveying and inspection of the terrain and then comparing it to earlier measurements (if any).
This traditional method of ground surveying can be difficult after an earthquake because the land surface has changed. Mapping ruptures typically means finding features that used to be continuous before the earthquake, like a road or fence. Because of the difficulties of ground surveying, researchers have begun to investigate how satellite imagery can aid ground surveys and rescue work by generating more immediate maps of earthquake deformation.
In theory, observing earthquake deformation should be as simple as comparing two optical satellite images that show the land surface before and after the earthquake. A science team at NASA’s Jet Propulsion Laboratory, Pasadena, Calif., used the Uninhabited Aerial Vehicle Synthetic Aperture Radar (UAVSAR) to measure surface deformation from the quake zone. The radar unit is flown at an altitude of 41,000 feet.
The April 4, 2010, quake was centered 32 miles south-southeast of Calexico, Calif., in northern Baja California. It occurred along a geologically complex segment of the boundary between the North American and Pacific tectonic plates. The quake, the region’s largest in nearly 120 years, was also felt in southern California and parts of Nevada and Arizona.
There have been thousands of aftershocks, extending from near the northern tip of the Gulf of California to a few miles northwest of the U.S. border. The area northwest of the main rupture, along the trend of California’s Elsinore fault, has been especially active, and was the site of a large, magnitude 5.7 aftershock on June 14, 2010.
"The goal of the ongoing study is to understand the relative hazard of the San Andreas and faults to its west like the Elsinore and San Jacinto faults, and capture ground displacements from larger quakes," said JPL geophysicist Andrea Donnellan, principal investigator of the UAVSAR project to map and assess seismic hazard in Southern California. Each UAVSAR flight serves as a baseline for subsequent quake activity.
The team estimates displacement for each region, with the goal of determining how much strain is partitioned between faults. When quakes do occur during the project, the team will observe their associated ground motions and assess how they may redistribute strain to other nearby faults. The resulting figures are color coordinated. Each color swath represents 4.7 inches of surface displacement.
Major fault lines are marked in red, and recent aftershocks are denoted by yellow, orange and red dots. The quake’s maximum ground displacements of up to 10 feet actually occurred well south of where the UAVSAR measurements stop at the Mexican border. UAVSAR is part of NASA’s ongoing effort to apply space based technologies, ground based techniques and complex computer models to advance our understanding of quakes and quake processes.
The radar flew over Hispaniola earlier this year to study geologic processes following January’s devastating Haiti quake. The data are giving scientists a baseline set of imagery in the event of future quakes. These images can then be combined with post-quake imagery to measure ground deformation, determine how much slip on faults is distributed, and learn more about fault zone properties.
Interesting3:Toxic contamination from pesticides, the burning of fossil fuels, agriculture, industrial operations and other sources are a continuing concern in national parks of the West, two new studies confirm. In research performed by an international group of scientists over several years, pollution was found in all eight of the national parks and preserves that were studied, in terrain ranging from the Arctic to southern California. Most of it was caused by regional agriculture or industry, but some had traveled thousands of miles from distant sources in Asia and elsewhere.
The two recent reports, both published in Environmental Science and Technology, reinforce previous research that has identified such problems, scientists say, and better quantify the extent of the concerns.
"As scientists we’re getting more used to these pollution problems," said Staci Simonich, an associate professor of environmental and molecular toxicology at Oregon State University, and lead investigator on both studies. "Pesticide pollution is now so routine that we’ve had to look at museum specimens to find baseline data that existed prior to pesticide use.
"But it still seems surprising that such remote and supposedly pristine areas are not all that pristine," she said. "You never really get used to that. And we’re now nailing down just where the real problems are and what is causing them."
The biggest concern, Simonich said, appears to be pesticides, which can bioaccumulate in the ecosystem and food web, and were most often linked to regional agricultural activities. Of the areas studied, the largest problems with pesticides were found in Sequoia, Rocky Mountain and Glacier National Park.
This research did not attempt to evaluate the full scope of environmental impacts, but scientists did observe some disturbing evidence of male fish at some high-elevation locations becoming "feminized" and developing eggs — a problem more commonly found at the outflow of wastewater treatment plants.
One of the studies also addressed polycyclic aromatic hydrocarbons, or PAHs — the often-toxic compounds formed from incomplete combustion of fossil fuels, as well as from burning or decay of forests or other biomass. Anything from automobile exhaust to a forest fire or industrial activity can cause PAH emissions. One measurement of PAH concentrations in a sample taken from Glacier National Park, near a local aluminum smelter, were off the charts — 60,000 times higher than most other samples.
Altogether, the scientists studied pollution issues at alpine, subarctic and arctic sites in Sequoia, Rocky Mountain, Glacier, Olympic, Mt. Rainier, Denali, and Gates of the Arctic National Park and Preserve, and Noatak National Preserve, from 2003-05. The research should provide a better understanding of the risks, including which pesticides are most likely to accumulate and may require improved regulation.
Among the other findings of the studies:
• Every national park and preserve studied had a somewhat different pollution signature, reflecting localized and regional inputs.
• Most of the pesticide and PAH pollution came from local and regional sources, although some traveled in short-term, episodic pulses from Asia and other very distant locations.
• The comparatively cold temperatures in these alpine or arctic ecosystems tend to concentrate both PAH levels and pesticides.
• The study concluded that "potential risks exist for indigenous people and subsistence food consumers that rely on fish and meat from cold ecosystems."
• Local pollution sources can be very important. One lake in Olympic National Park had PAH deposition 10 times higher than another not far away, possibly because it was closer to Seattle and nearby ship traffic in the Strait of Juan de Fuca.
• Large-scale biomass burning near Glacier National Park seemed much less important in PAH deposition than some nearby aluminum smelting and oil and natural gas drilling operations.
• The majority of pesticide contamination in U.S. national parks is due to regional pesticide use.
• The magnitude of pesticide deposition varies from year to year, but the geographic sources of it generally do not.
Air Temperatures ranged between these warmest and coolest spots near sea level around – and on the highest mountains…as of 5pm Wednesday evening:
Barking Sands, Kauai – 84
Hilo, Hawaii – 73
Haleakala Crater – 57 (near 10,000 feet on Maui)
Mauna Kea summit – 43 (near 14,000 feet on the Big Island)
Precipitation Totals–The following numbers represent the largest precipitation totals (inches) during the last 24 hours on each of the major islands, as ofWednesday afternoon:
1.90 Mount Waialaele, Kauai 0.11 Manoa Valley, Oahu
0.05 Molokai
0.00 Lanai
0.00 Kahoolawe
1.05 West Wailuaiki, Maui
0.95 Waiakea Uka, Big Island
Marine Winds – Here’s the latest (automatically updated)weather mapshowing a 1029 millibar high pressure system to the north of the islands. This will keep strong trade winds blowing through Thursday…beginning to ease up a little later Friday. Satellite and Radar Images:To view the cloud conditions we have here in Hawaii, please use the following satellite links, starting off with thisInfrared Satellite Imageof the islands to see all the clouds around during the day and night. This next image is one that gives close images of the islands only during the daytime hours, and is referred to as aClose-up visible image. This next image showsa larger view of the Pacific…giving perspective to the wider ranging cloud patterns in the Pacific Ocean. Finally, here’s aLooping IR satellite image, making viewable the clouds around the islands 24 hours a day. To help you keep track of where any showers may be around the islands, here’s the latest animatedradar image.
Hawaii’s Mountains – Here’s a link to the live webcam on the summit of near 14,000 foot Mauna Kea on the Big Island of Hawaii. The tallest peak on the island of Maui is the Haleakala Crater, which is near 10,000 feet in elevation. These two webcams are available during the daylight hours here in the islands…and when there’s a big moon rising just after sunset for an hour or two! Plus, during the nights and early mornings you will be able to see stars, and the sunrise too…depending upon weather conditions. Tropical Cyclone activity in the eastern and central Pacific– Here’s the latest weather information coming out of theNational Hurricane Center, covering the eastern north Pacific. You can find the latest tropical cyclone information for the central north Pacific (where Hawaii is located) by clicking on this link to the Central Pacific Hurricane Center. Here’s atracking mapcovering both the eastern and central Pacific Ocean. A satellite image, which shows the entire ocean area between Hawaii and the Mexican coast…can be found here. Of course, as we know, our hurricane season won’t begin again until June 1st here in the central Pacific.
Aloha Paragraphs
Trade winds…and south shore surf Thursday
Trade winds will continue, strengthening some into Thursday, before backing off some during the weekend…remaining somewhat lighter than normal into early next week.Small craft wind advisories are active in all our major channels…and in all coastal waters Wednesday afternoon. This latest weather mapshows a moderately strong 1029 millibar high pressure system to the north of the Hawaiian Islands…the source of our strengthening winds now. As usual, wind speeds are apt to drop down some tonight into early Thursday morning. All this wind, along with the low relative humidity will work together to keep a red flag warning in place until 6pm Thursday.
The windward sides will see a few showers…most notably during the night and early morning hours.As this IRsatellite imageshows, there are lots of clouds around the islands…although most of which are offshore from the windward sides of the islands.This looping radar imageshows scattered showers moving across the state…the majority of which are taking aim on the islands from Oahu down through the Big Island at the time of this writing. An area of clouds impacting the windward sides tonight may bring additional showers. Thislarger viewof the central Pacific shows thunderstorms far to the southwest of the islands, which may eventually send us high cirrus clouds on the upper wind flow out of the southwest.
The eastern Pacific Ocean has two active tropical cyclones Wednesday night.Thissatellite imageshows strengthening hurricane Celia, along with recently upgraded tropical storm Darby, to the east of Celia. Celia continues to head generally towards the west, while Darby heads northwest…as shown on thisgraphical track map. The good news continues to be that these tropical cyclones will have no bearing on the Hawaiian Islands…here in the central Pacific through at least the next week, if any at all. There may be a chance that we could get some of the leftover showers from Celia late next week.
It’s Wednesday evening as I begin writing this last section of today’s narrative update. The main thing now in our weather here in the islands, is the stronger than normal trade wind flow. As the numbers below show, we have some strong gusts Wednesday evening: Kauai – 35 mph Oahu – 42
Molokai – 42
Lanai – 18 – partially blocked from the strong trade winds Kahoolawe – 43
Maui – 45 Big Island 37
Looking out the window here in Kihei it’s quite cloudy, in just about all directions, and especially up the slopes of the Haleakala Crater. I’m about ready to jump in my car for the drive back upcountry to Kula. I must say, that I’m looking forward to getting home, and relaxing a little, as it’s been a big day at work. I’ll be up very early Thursday morning again though, back at my computer to produce your next new weather narrative, available here around 6am HST. I hope you have a great Wednesday night until then! Aloha for now…Glenn.
Interesting:A magnitude-5.0 earthquake struck at the Ontario-Quebec border region of Canada on Wednesday, the U.S. Geological Survey said, and homes and businesses were shaken from Canada’s capital in Ottawa on south to an arc of U.S. states. There were no immediate reports of injuries or damage. The midday quake was felt in Canada and in a number of U.S. states, including Indiana, Michigan, Ohio, Pennsylvania, West Virginia, Vermont, New Hampshire, New Jersey and New York.
The USGS said the quake occurred at a depth of about 12 miles (19.2 kilometers). The agency initially said the quake had a 5.5 magnitude, but later reduced it to a magnitude-5.0. The quake occurred at 1:41 p.m. EDT (1741 GMT), the USGS said.
The tremors, which lasted about 30 seconds, rattled buildings in Ottawa and Toronto, as well as government offices across the Ottawa River in Gatineau, Quebec. The Parliament building in Ottawa was evacuated, with workers sent home while the building was inspected. Workers also left buildings in Toronto.
The quake came just ahead of the weekend summit of G-20 and G-8 world leaders in Toronto and Huntsville, Ontario. Chris Cornell, 46, who works in downtown Toronto, said desks and furniture shook as he sat at his desk in a finance office. Shirley Pelletier, 27, said a prolonged tremor shook bookshelves and caused paintings on walls to shake in her office just outside downtown Toronto.
Residents of a number of states in the Midwest and Northeast reported feeling the earthquake. In Ohio, people reported the sound of plaster cracking in Cleveland and buildings in Cincinnati gently swaying. In Cleveland, James Haselden says his office in a renovated 19th century brick building swayed and he heard plastic cracking but saw no damage.
The Pittsburgh Post-Gazette reported on its website that the Canadian quake was felt by some residents in the western Pennsylvania area. The quake also was felt in New Jersey, where the Bergen County administration building in Hackensack was evacuated after employees reported they felt a tremor. Bergen County Police Lt. Christine Francois said numerous people in the Hackensack and Englewood areas called police to report earth tremors.
In Michigan, residents from suburban Detroit to Port Huron and Saginaw reported feeling the earthquake. Detroit police spokeswoman Yvette Walker told The Associated Press that police personnel on the upper floors of the downtown headquarters building reported feeling the quake.
In New York state, people from Buffalo to Albany and north to Massena on the St. Lawrence River said pets were startled and plates rattled when the quake hit. David French, 53-year-old state worker from Cicero, New York, said he was at his computer inside his home near Syracuse when he felt his chair shake. "I thought the chair was breaking or something," he said. "I looked over and my filing cabinet was moving."
The quake prompted several calls to state police in the Adirondacks area. "A little shake, nothing too big," is how Trooper Mark Revette described the temblor. "It happens. We get a couple of these a year." Kellie Tassone, 40, was at home on Oneida Lake in Cicero. "My dog picked his head up just before it happened and kind of looked at me," she said. Then the sliding door started to rattle "and the house was shaking."
The USGS said the two largest quakes in western Quebec occurred in 1935 at magnitude-6.1 and in 1732 at a magnitude of 6.2, where it caused significant damage in Montreal. The agency said earthquakes cause significant damage in the region about once a decade. Smaller earthquakes are felt three or four times a year.
Interesting2:There are many ships at work right now in the Gulf of Mexico responding to the devastating consequences of the Deepwater Horizon explosion. Some are skimming the water to collect oil, some are burning off the oil. Some are busy digging a relief well. However, there is at least one vessel that is using this tragedy as an opportunity to conduct scientific research. The National Oceanic and Atmospheric Administration’s (NOAA) ship, Thomas Jefferson, is using acoustic and fluorometric scanning to detect oil under the surface.
The ship set off from Galveston, Texas on an eight day mission into the Gulf of Mexico, and returned to port on June 11. The purpose was to investigate the distribution and presence of subsurface oil coming from the rig explosion. Water samples were collected and analyzed by agency officials and scientists from the University of New Hampshire and the Woods Hole Oceanographic Institution.
"NOAA is extremely concerned about the health of the Gulf of Mexico and the well-being of the millions of people who depend on these waters for their livelihoods and pleasure," said Jane Lubchenco, Ph.D., under secretary of commerce for oceans and atmosphere and NOAA administrator. "I’m pleased that agency and academic scientists continue to innovate and explore ways to bring the absolute best science to inform the response and recovery efforts."
First, the science team would sweep the underlying waters with acoustic and fluorometric sensors to detect aberrations in the water column. Then they would take water samples to determine if the aberration was actually oil. An acoustic sensor uses sound waves and is often referred to as SONAR which is used commonly in submarines. Passive acoustic sensors listen to the sounds in the water.
Active sensors emit pulses of sound and then listen for the echo. An oil plume would have different sound reverberation than the water. Fluorometric sensors use light waves to determine the shape of an oil plume.
A beam of light, usually ultraviolet light, is scanned throughout the water. The light can excite electrons of certain molecules and cause them to emit their own light at a lower energy. This is the same concept behind glow-in-the-dark posters or stars that can stick onto a wall. The oil would have different fluorescence than the water.
The Thomas Jefferson made several initial observations including:
1. Subsurface oil was found 7.5 nautical miles southwest of the wellhead at 1,100 meters in depth by observing high fluorescence and reduced dissolved oxygen.
2. An acoustic anomaly was also found in the same area.
3. Natural gas was also found in an area of known gas seepage southwest of the spill site.
4. Fluorometric sensors have shown to be an extremely effective method to detect water masses in shallow waters.
Another expedition is underway for the ship, Thomas Jefferson to gather more data in the coastal zone. Any information on subsurface masses discovered in the coastal zone would be shared with other researchers and emergency responders.
The situation in the Gulf requires an all-hands-on-deck approach, and NOAA is doing its part to provide accurate data on where the oil is. Knowing where to find oil is just as important as cleaning up the oil. The work is sure to be difficult and ongoing.
Interesting3:While there is room for improvement in every country, the U.S. stands out for not getting good value for its health care dollars, ranking last despite spending $7,290 per capita on health care in 2007 compared to the $3,837 spent per capita in the Netherlands, which ranked first overall. Provisions in the Affordable Care Act that could extend health insurance coverage to 32 million uninsured Americans have the potential to promote improvements to the United States’ standing when it comes to access to care and equity, according to Mirror Mirror On The Wall: How the Performance of the U.S. Health Care System Compares Internationally 2010 Update, by Commonwealth Fund researchers Karen Davis, Cathy Schoen, and Kristof Stremikis.
The United States’ low marks in the quality and efficiency dimensions demonstrate the need to quickly implement provisions in the new health reform law and stimulus legislation that focus on realigning incentives to reward higher quality and greater value, investment in preventive care, and expanding the use of health information technology.
"It is disappointing, but not surprising that, despite our significant investment in health care, the U.S. continues to lag behind other countries," said Commonwealth Fund President and lead author Karen Davis. "With enactment of the Affordable Care Act, however, we have entered a new era in American health care.
We will begin strengthening primary care and investing in health information technology and quality improvement, ensuring that all Americans can obtain access to high quality, efficient health care." Earlier editions of the report, produced in 2004, 2006, and 2007, showed similar results. This year’s version incorporates data from patient and physician surveys conducted in seven countries in 2007, 2008, and 2009.
Air Temperatures ranged between these warmest and coolest spots near sea level around – and on the highest mountains…as of 5pm Tuesday evening:
Barking Sands, Kauai – 85
Hilo, Hawaii – 76
Haleakala Crater – 52 (near 10,000 feet on Maui)
Mauna Kea summit – 45 (near 14,000 feet on the Big Island)
Precipitation Totals–The following numbers represent the largest precipitation totals (inches) during the last 24 hours on each of the major islands, as ofTuesday afternoon:
0.43 Mount Waialaele, Kauai 0.08 Manoa Valley, Oahu
0.03 Molokai
0.00 Lanai
0.01 Kahoolawe
0.26 West Wailuaiki, Maui 0.45 Kawainui Stream, Big Island
Marine Winds – Here’s the latest (automatically updated)weather mapshowing high pressure systems to the northeast of the islands. This will keep strong trade winds blowing through Thursday…locally strong and gusty at times. Satellite and Radar Images:To view the cloud conditions we have here in Hawaii, please use the following satellite links, starting off with thisInfrared Satellite Imageof the islands to see all the clouds around during the day and night. This next image is one that gives close images of the islands only during the daytime hours, and is referred to as aClose-up visible image. This next image showsa larger view of the Pacific…giving perspective to the wider ranging cloud patterns in the Pacific Ocean. Finally, here’s aLooping IR satellite image, making viewable the clouds around the islands 24 hours a day. To help you keep track of where any showers may be around the islands, here’s the latest animatedradar image.
Hawaii’s Mountains – Here’s a link to the live webcam on the summit of near 14,000 foot Mauna Kea on the Big Island of Hawaii. The tallest peak on the island of Maui is the Haleakala Crater, which is near 10,000 feet in elevation. These two webcams are available during the daylight hours here in the islands…and when there’s a big moon rising just after sunset for an hour or two! Plus, during the nights and early mornings you will be able to see stars, and the sunrise too…depending upon weather conditions. Tropical Cyclone activity in the eastern and central Pacific– Here’s the latest weather information coming out of theNational Hurricane Center, covering the eastern north Pacific. You can find the latest tropical cyclone information for the central north Pacific (where Hawaii is located) by clicking on this link to the Central Pacific Hurricane Center. Here’s atracking mapcovering both the eastern and central Pacific Ocean. A satellite image, which shows the entire ocean area between Hawaii and the Mexican coast…can be found here. Of course, as we know, our hurricane season won’t begin again until June 1st here in the central Pacific.
Aloha Paragraphs
Trade wind weather conditions Wednesday
Trade winds will continue, strengthening some Wednesday into Thursday, before backing off some Friday into the weekend…remaining somewhat lighter than normal into early next week.Small craft wind advisories are active in all our major channels, and in all coastal waters too Tuesday night…and will likely remain over those areas through Thursday. The winds have become strong enough over the Haleakala Crater on Maui, and the summits on the BigIsland…to keep the wind advisory active now as well. This advisory may become necessary in the Kohala area of the Big Island with time too. This latest weather mapshows high pressure systems to the northeast of the Hawaiian Islands…the source of our strengthening winds now. The forecast models point out a reasonably good chance of lighter winds this weekend, which may remain in place into early next well as well.
The windward sides will see a few showers…most notably during the night and early morning hours.As thisIRsatellite imageshows, there are scattered clouds around the islands…although most of which are offshore from the windward sides of the islands. Thislooping radar imageshows scattered showers moving through the state…the majority of which are upstream of the windward sides as we push through the night. Thislarger viewof the central Pacific shows an increase in thunderstorm activity far to the southwest of the islands, which may eventually send us high cirrus clouds on the upper wind flow out of the southwest. Otherwise, we’ll find lots of daytime sunshine, and good weather at our local beaches for the time being. The next chance of some more substantial precipitation would have to wait until perhaps late Friday into the weekend…especially over the Kauai and Oahu end of the island chain then.
It’s Tuesday evening as I begin writing this last section of today’s narrative update. We’ll find fairly normal weather conditions here in the islands this week, at least through Thursday. As far as rainfall goes, there will be some showers, although not all that many most of the time. There could be an increase in windward showers perhaps around Friday night into the weekend…as a trough of low pressure makes our overlying atmosphere more shower prone then. This increase in showers will depend, as always…on whether there will be a corresponding increase in clouds for the trough to work on. Other than that, the main thing through the next several days will be the stronger and gusty trade winds. The surf will become rougher and choppy along our east facing beaches, and rise from the south along our leeward beaches again by Thursday.
~~~ The eastern Pacific Ocean has two active tropical cyclones Tuesday night. Thissatellite imageshows strengthening hurricane Celia offshore from the Mexican coast, with recently formed tropical depression 5E to the east of Celia. Celia continues to head generally towards the west, while 5E heads northwest…as shown on thisgraphical track map. The good news continues to be that these tropical cyclones will have no bearing on the Hawaiian Islands…here in the central Pacific through at least the next week, if any at all. There may be a chance that we could get some of the leftover showers from Celia late next week.
~~~ Here in Kihei, Maui early this evening it’s mostly clear, and a little breezy. The big news here on Maui this afternoon was the two brush fires that broke out near Kahului. The roads around the airport were closed in places, which I understand snarled traffic considerably. I’m holding off on leaving Kihei for the drive back home to Kula, to let some of the traffic jam ease up. I’ll be back early Wednesday morning with your next new weather narrative, I hope you have a great Tuesday night until then! Aloha for now…Glenn. Interesting: It’s not just the crude that is causing problems in the gulf oil spill: Another petroleum byproduct, natural gas, is reported to be leaking in much greater concentrations than previously thought. And not only could the gas be suffocating sea life, but a new analysis warns that a giant, 1,000-year-old methane bubble could soon explode, taking out miles and miles of the ocean floor and causing a violent oil spill tsunami that would threaten the entire gulf coastline. How credible is this new threat?
The Trouble Methane Has Already Caused
Natural gas, primarily known for its role as a home heating agent, contains between 75 and 90 percent methane by volume. A heat-trapping greenhouse gas, it results as a byproduct in most deep-ocean drilling operations and is highly combustible, although drillers attempt to mitigate its dangerous potential by releasing it in controlled spurts, or "kicks," from a well. Tragically, one particularly strong, uncontrolled kick caused the April 20 explosion that sank BP’s Deepwater Horizon platform.
Since then, the oil that has leaked from the Macondo Prospect into the Gulf of Mexico (now pegged at a rate as high as 100,000 barrels per day) has contained about 40 percent methane, according to The Associated Press. The agency notes that this is far greater the 5 percent typically found in oil deposits, and has the potential to create dreaded oxygen-depleted "dead zones" throughout the ocean, wherein no sea life can survive for years. Already, scientists have observed methane concentrations up to 10,000 times higher than normal and corresponding oxygen depletion levels.
As environmentalists have pointed out, the methane released by the BP oil spill is also thought to be adding to global warming, as methane is a greenhouse gas 20 times more potent than carbon dioxide. BP says it’s burning much of the natural gas that bubbles up from the source of the leak, but does not account for the portion that has already escaped into the water. Other science writers have noted that methane does eventually dissolve uniformly in seawater and is consumed by microbes.
The Worst-Case Scenario
The frightening "low-probability" scenario described today by entrepreneur and philanthropist DK Matai at The Huffington Post includes the possibility of a "massive bubble trapped for thousands of years under the Gulf of Mexico sea floor" exploding and setting off a "tsunami [traveling] at a high speed of hundreds of miles per hour."
Matai continues: Florida might be most exposed to the fury of a tsunami wave. The entire Gulf coastline would be vulnerable, if the tsunami is manifest. Texas, Louisiana, Mississippi, Alabama and southern region of Georgia might experience the effects of the tsunami according to some sources.
He also warns of a "second tsunami via vaporization." This could result after the initial explosion displaced all the oil, gas and water around it, producing a gigantic, extremely hot (300-degree Fahrenheit) cavity, which would vaporize all the incoming water, turning it into steam and causing another rupture in the gulf floor. He notes that as time goes on and the gulf well remains unplugged, the "risk increases."
BP’s View
BP America spokesman Robert Wine told Surge Desk that Matai’s claims were unfounded, saying: "Of course there’s natural gas down there. That’s what’s coming up, that’s what we’ve been burning this whole time. It’s what caused the explosion in the first place, after all, so where does this idea of another bubble or explosion come from? It is a bit difficult to comment on the claims of unspecified geologists." No matter how unlikely a tsunami might be, we’ve already entered hurricane season, which has a much greater chance of ruining the gulf oil spill response effort.
Air Temperatures ranged between these warmest and coolest spots near sea level around the state – and on the highest mountains…as of 5pm Monday evening:
Port Allen, Kauai – 84
Molokai AP – 77
Haleakala Crater – 57 (near 10,000 feet on Maui)
Mauna Kea summit – 46 (near 14,000 feet on the Big Island)
Precipitation Totals–The following numbers represent the largest precipitation totals (inches) during the last 24 hours on each of the major islands, as ofMonday afternoon:
0.46 Mount Waialaele, Kauai 0.04 Manoa Valley, Oahu
0.02 Molokai
0.00 Lanai
0.00 Kahoolawe
0.40 West Wailuaiki, Maui 1.19 Kawainui Stream, Big Island
Marine Winds – Here’s the latest (automatically updated)weather mapshowing a large 1029 millibar high pressure system far to the northeast of the islands. This will keep moderately strong trade winds blowing through Wednesday…locally stronger and gusty during the afternoons. Satellite and Radar Images:To view the cloud conditions we have here in Hawaii, please use the following satellite links, starting off with thisInfrared Satellite Imageof the islands to see all the clouds around the state during the day and night. This next image is one that gives close images of the islands only during the daytime hours, and is referred to as aClose-up visible image. This next image showsa larger view of the Pacific…giving perspective to the wider ranging cloud patterns in the Pacific Ocean. Finally, here’s aLooping IR satellite image, making viewable the clouds around the islands 24 hours a day. To help you keep track of where any showers may be around the islands, here’s the latest animatedradar image.
Hawaii’s Mountains – Here’s a link to the live webcam on the summit of near 14,000 foot Mauna Kea on the Big Island of Hawaii. The tallest peak on the island of Maui is the Haleakala Crater, which is near 10,000 feet in elevation. These two webcams are available during the daylight hours here in the islands…and when there’s a big moon rising just after sunset for an hour or two! Plus, during the nights and early mornings you will be able to see stars, and the sunrise too…depending upon weather conditions. Tropical Cyclone activity in the eastern and central Pacific– Here’s the latest weather information coming out of theNational Hurricane Center, covering the eastern north Pacific. You can find the latest tropical cyclone information for the central north Pacific (where Hawaii is located) by clicking on this link to the Central Pacific Hurricane Center. Here’s atracking mapcovering both the eastern and central Pacific Ocean. A satellite image, which shows the entire ocean area between Hawaii and the Mexican coast…can be found here. Of course, as we know, our hurricane season won’t begin again until June 1st here in the central Pacific.
Aloha Paragraphs
Trade wind weather conditions into Tuesday
Trade winds will continue, strengthening some Tuesday through Thursday…then backing off Friday into the weekend.Small craft wind advisories are now active in those windiest areas across the entire state Monday night…and will likely remain over those areas through Thursday. This latestweather mapshows a moderately strong 1029 millibar high pressure system to the northeast of the Hawaiian Islands…the source of our winds now. The forecast models point out a reasonably good chance of considerably lighter winds this weekend, which may remain in place into early next well as well.
The windward sides will see a few showers…most notably during the night and early morning hours.As this IRsatellite imageshows, there are lots of scattered clouds around the islands…most of which are offshore from the islands as we push into the night. Thislooping radar imageshows scattered showers moving through the state…on the easterly trade winds. Thislarger viewof the central Pacific shows an increase in thunderstorm activity far to the southwest of the islands. Otherwise, we’ll find lots of daytime sunshine, and good weather at our local beaches for the time being.
It’s Monday evening as I begin writing this last section of today’s narrative update. We’ll find fairly normal weather conditions here in the islands this week, at least through Thursday. As far as rainfall goes, there will be some showers, although not all that many most of the time. There could be an increase in windward showers perhaps around Friday night into Saturday…as a trough of low pressure makes our overlying atmosphere more shower prone then.
~~~ The eastern Pacific Ocean has just one active tropical cyclone now, as former Blas has been given its final advisory. This satellite image shows strengthening hurricane Celia
offshore from the Mexican coast. Celia continues to head generally towards the west, as shown on this graphical track map. The good news is that this tropical cyclone, which will soon be referred to as a major hurricane, will haveno bearing on the Hawaiian Islands…here in the central Pacific through at least the next week, if any at all. There may be a chance that we could get some of the leftover showers from Celia later next week.
~~~ Here in Kihei, Maui this evening it’s generally clear to partly cloudy down near the beaches, and cloudy up the slopes of the Haleakala Crater. The trade winds are blowing as usual. As a matter of fact, starting Tuesday, there will be an active fire weather watch in effect across all of our south and west facing leeward coasts and slopes. This is a result of the expected gusty winds, which will become rather strong, and low humidity levels. Other than that, and the somewhat elevated surf along some of our south and west facing beaches, things will remain fairly normal. I’ll be back early Tuesday morning with your next new weather narrative. I hope you have a good Monday night until then! Aloha for now…Glenn
Extra: In one day, a full grown Oak tree expels 7 tons of water through its leaves. Interesting:In the summer of 2002, a week of heavy rains in Central Texas caused Canyon Lake — the reservoir of the Canyon Dam — to flood over its spillway and down the Guadalupe River Valley in a planned diversion to save the dam from catastrophic failure. The flood, which continued for six weeks, stripped the valley of mesquite, oak trees, and soil; destroyed a bridge; and plucked meter-wide boulders from the ground. And, in a remarkable demonstration of the power of raging waters, the flood excavated a 2.2-kilometer-long, 7-meter-deep canyon in the bedrock.
According to a new analysis of the flood and its aftermath — performed by Michael Lamb, assistant professor of geology at the California Institute of Technology (Caltech), and Mark Fonstad of Texas State University — the canyon formed in just three days. A paper about the research appears in the June 20 advance online edition of the journal Nature Geoscience.
Our traditional view of deep river canyons, such as the Grand Canyon, is that they are carved slowly, as the regular flow and occasionally moderate rushing of rivers erodes rock over periods of millions of years. Such is not always the case, however. "We know that some big canyons have been cut by large catastrophic flood events during Earth’s history," Lamb says.
Unfortunately, these catastrophic megafloods — which also may have chiseled out spectacular canyons on Mars — generally leave few telltale signs to distinguish them from slower events. "There are very few modern examples of megafloods," Lamb says, "and these events are not normally witnessed, so the process by which such erosion happens is not well understood."
Nevertheless, he adds, "the evidence that is left behind, like boulders and streamlined sediment islands, suggests the presence of fast water" — although it reveals nothing about the time frame over which the water flowed. This is why the Canyon Lake flood is so significant. "Here, we know that all of the erosion occurred during the flood," Lamb says.
"Flood waters flowed for several weeks, but the highest discharge — during which the bulk of the erosion took place — was over a period of just three days." Lamb and Fonstad reached this conclusion using aerial photographs of the region taken both before and after the flood, along with field measurements of the topography of the region and measurements of the flood discharge.
Then they applied an empirical model of the sediment-carrying capacity of the flood — that is, the amount of soil, rocks, boulders, and other debris carried by the flood to produce the canyon. The analysis revealed that the rate of the canyon erosion was so rapid that it was limited only by the amount of sediment the floodwaters could carry. This is in contrast to models normally applied to rivers where the erosion is limited by the rate at which the underlying rock breaks and is abraded.
The researchers argue that the rate of erosion was rapid because the flood was able to pop out and cart away massive boulders (a process called "plucking") — producing several 10- to 12-meter-high waterfalls that propagated upstream toward the dam, along with channels and terraces. The flood was able to pluck these boulders because the bedrock below the soil surface of the valley was already fractured and broken.
The abrasion of rock by sediment-loaded waters — while less significant in terms of the overall formation of the canyon — produced other features, like sculpted walls, plunge pools at the bases of the waterfalls, and teardrop-shaped sediment islands. The sediment islands are particularly significant, Lamb says, because "these are features we see on Earth and on Mars in areas where we think large flow events have occurred.
It’s nice that here we’re seeing some of the same features that we’ve interpreted elsewhere as evidence of large flow events." The results, Lamb says, offer useful insight into ancient megafloods, both on Earth and on Mars, and the deep canyons they left behind. "We’re trying to build models of erosion rates so we can go to places like Mars and make quantitative reconstructions of how much water was there, how long it lasted, and how quickly it moved," Lamb says. In addition, he says, "this is one of a few places where models for canyon formation can be tested because we know the flood conditions under which this canyon formed."
Interesting2:Scientists have found that the ocean temperature at Earth’s polar extremes has a significant impact thousands of miles away at the equator. Newcastle University’s Dr Erin McClymont is part of an international team of researchers who have published research in Science June 18, 2010 demonstrating a close link between the changes in the subpolar climate and the development of the modern tropical Pacific climate around two million years ago.
The team believes this solves another piece of the puzzle concerning oceanic behavior and its influence on climate. This research, led by the Institut de Ciència i Tecnologia Ambientals in Barcelona, studied the Northern Pacific and Southern Atlantic sea-surface temperatures from the Pliocene Era (3.65 million years ago) to the present day. Data obtained during the reconstruction indicates that the regions close to the poles of both oceans have played a fundamental role in the way the tropical climate has evolved.
The cooling and expansion of polar waters between 1.8 and 1.2 million years ago increased the temperature difference between the equator and the poles. This intensified atmospheric circulation and helped to develop the modern day ‘cold tongue’ in the east Pacific. Created by a shallow thermocline — the layer of ocean water in which temperatures fall rapidly — the cold tongue brings cold, deep waters to the surface in the east tropical Pacific.
Under the warmer climate of the Pliocene, the thermocline was deeper and the cold tongue was much smaller, creating a situation more like the ‘El Niño’ events that hit the Pacific every three to five years. "Our results show that the polar oceans play a key role in the global climate, and that one outcome of a rise in global temperature could be an increase in the depth of the thermocline and contraction of the cold tongue in the eastern Pacific," said Dr McClymont.
"The high-latitudes are currently experiencing large climate changes, and our data show that this could impact on tropical climates as we saw in the Pliocene." The study of Pliocene climate has been the subject of intense research as this era represents the most recent climatic period in Earth’s history when average temperatures were significantly higher than today over a sustained period. As a result, the Pliocene is thought to be the closest predictor of Earth’s climate in the future.
Interesting3:The secret life of water just got weirder. For years water has been known to exist in 15 phases — not just the merry threesome of solid, liquid and gas from grade school science. Now, University of Utah chemists have confirmed the coexistence of ice and liquid after water crystallizes at very low temperatures. They describe their work in the June 21 issue of the Journal of Chemical Physics, which is published by the American Institute of Physics (AIP).
It takes more than a swizzle stick and a cocktail shaker to do this kind of ice research. It takes a temperature of 180 K, an extremely cold temperature typical of the upper atmosphere called the "no-man’s land" of water because of the curious blurring of two water phases — liquid and ice — that occurs there. "This blurring is what’s interesting," says Valeria Molinero, who led the research.
"Our findings show that what goes on there is important to the behavior of water and to the formation of clouds." Molinero and graduate student Emily Moore discovered that at 180 K rapid ice crystallization makes it difficult to follow the process. Because the molecules move too quickly to observe directly in the lab, their investigation used computer simulations.
By targeting this critical temperature zone, their work might be important for understanding cloud formations that regulate global radiation and hence climate change. While this is a boon for understanding supercooled water and its role in cloud formation, it’s a breakthrough for those dreaming of a No Man’s Land Physics Fun Park. One day, they just might play hockey while swimming.
Interesting4:The millions upon millions of gallons of oil hemorrhaging into the Gulf of Mexico every day is a crude reminder of the many ways humans are fouling the planet. As forests are cleared, cities and suburbs paved and expanded, as the air and sea warm and become increasingly polluted with cancer-causing chemicals and garbage, and with species dropping like flies, the planet’s health is being challenged in ways that have not occurred in its entire 4.5-billion-year existence.
Can Earth survive? The simple answer is a resounding "yes." When humans are gone, as the fossil record suggests will happen eventually, Earth will clean itself up and take on yet another new look,just as it has done many times in the past. In many ways, Earth’s existence has been tested far more dramatically in the past than by anything humans have thrown at it. From its origins as a giant lava ball to an epoch that engulfed the entire planet in ice a mile deep, this planet has seen it all. Our planet was even purple for awhile, scientists say.
"As far as the solid Earth, I doubt if it cares much about life on Earth," said Richard Carlson, a geochemist at the CarnegieInstitution of Washington in D.C. "So volcanoes, plate tectonics,earthquakes, etc. likely would go on as before." The Earth may care little, but humans certainly have reason to figure out how to better survive the planet’s changes, whether natural or caused by people.
Some like it hot
Earth is thought to have formed from protoplanetary bodies colliding during the chaotic early days of the solar system. Barely 30 million to 50 million years later, a catastrophic smashup took place between the young planet and a smaller Mars-sized object, reshaping the world dramatically around 4.5 billion years ago. That early violence helped spawn the moon. More giant impacts between 4.1 billion and 3.9 billion years ago may have shaped the continents and possibly even re-melted the solidifying planetary crust, scientists say.
More recently, super-volcanoes that dwarf anything seen in recorded history wreaked additional havoc. One series of eruptions around 65 million years ago spewed lava across an area more than twice the size of Texas. But the world has not ended in fire just yet, and it even survived a "snowball Earth" period between 710 million and 640 million years ago that put ordinary ice ages to shame. Geologists have found evidence that sea ice and glaciers reached all the way to the equator during that period.
Despite all the upheaval, life managed to not only survive but thrive. A thick organic haze of methane and nitrogen may have helped out by keeping the planet unfrozen early on, scientists suggest. The rise of life on Earth may not have shaken things up in a geological sense, but it did give a makeover to the planet’s chemistry. Now humans represent the latest to alter the balance of life and chemistry on the planet during our relatively short existence.
Turn and face the strain
Species are going extinct at a rate between 1,000 and 10,000 times higher than the expected natural extinction rate based on the fossil record, according to the International Union for the Conservation of Nature, which is charged with officially declaring endangered or extinct species.
Forests that once covered continents such as Europe now look like shadows of their former selves after hundreds of years of land clearing. Deforestation has begun to slow in the last decade, but an area of forest the size of Vermont and New Hampshire combined is still destroyed each year, said a recent report by the U.N. Food and Agriculture Organization.
All major fisheries have collapsed due to overfishing, and rising carbon dioxide levels raise the specter of moremass extinction among marine life due to ocean acidification – not unlike what has happened previously during the Earth’s history. Humans have even changed the atmosphere, as in the case of chlorofluorocarbons(CFCs) used as refrigerants. The ozone-destroying chemicals could have created a world where a permanent ozone layer hole yawned above Antarctica and people sunburned within minutes, if not for the Montreal Protocol that banned CFCs in 1989.
Such changes may have proved ruinous for humans, but Earth itself would have shrugged them off. "If these [major chemical changes in the atmosphere] were big enough to kill off humanity, the atmosphere likely would recover pretty quickly, at least on geologic time scales." Similarly, the Earth has stoically endured climate change far beyond anything experienced by humans. But history shows that human civilization remains vulnerable to even minor shifts in climate patterns.
For instance, a cooler Pacific Ocean has been connected with drier climate and drought conditions that led to famines in Medieval Europe, and perhaps the disappearance of cliff-dwelling natives of the American West. Now global warming driven by greenhouse gases may lead to even wilder climate fluctuations in different parts of the world.
Rates of increasing carbon dioxide are approximately 100 times greater than most changes previously seen during geologic time, according to researchers on the Ocean Carbon & Biogeochemistry website. Whether or not humans choose to deal with greenhouse gases, Earth’s history shows that they inevitably face a running battle with climate change. Species that couldn’t adapt in the past have died, and odds are that humanity’s number will be up at some point.
The things we leave behind
"There will definitely be minute traces of us around, but I suspect most of the stuff that says we were here will be buried by geology," said Alan Weisman, a journalist and author of the book "The World Without Us" (Thomas Dunne Books, 2007). Many of humanity’s most visible achievements would vanish quickly. Buildings would crumble and decay within just 10,000 to 15,000 years. A bronze bust could survive for millions of years, Weisman said, even if it toppled and ended up buried, as would be likely.
Some more lasting effects on the Earth might come from the chemicals that would leak from their tanks within decades, or nano-particles being engineered every day inside labs. "We’ve created some chemical molecules that nothing in nature knows how to break down yet," Weisman pointed out. "Some, nature will figure out. Microbes will figure out how to do plastic."
A more deadly legacy for life after humans comes from more than 440 nuclear power plants. Overheating would cause about half to burn and the rest to suffer meltdowns, releasing radioactivity into the air and nearby water. Unattended refineries and chemical plants could also start burning and in turn releasing chemicals. The equivalent of hundreds of Chernobyl disasters "would probably start forcing evolution in pretty dramatic ways," Weisman said.
Still, the Earth had already experienced nuclear fission almost 2 billion years ago. Several uranium deposits at Oklo in the Republic of Gabon, a southwestern region of Africa, showed evidence of having operated as natural nuclear reactors for several hundred thousand years.
Earth also has experience dealing with oil spills, given along history of natural oil seepage in places such as the Gulf of Mexico. Wild microbes that have evolved to break down oil no doubt found an unusually bountiful feast in recent months because of the Gulf oil gusher from the BP oil rig disaster. That "horrifying" event may register as just a blip on the Earth’s radar. But it still seems like a very long-term mess for the humans who have to live with it, Weisman noted. "The oil sucks," Weisman said. "You can quote me on that."


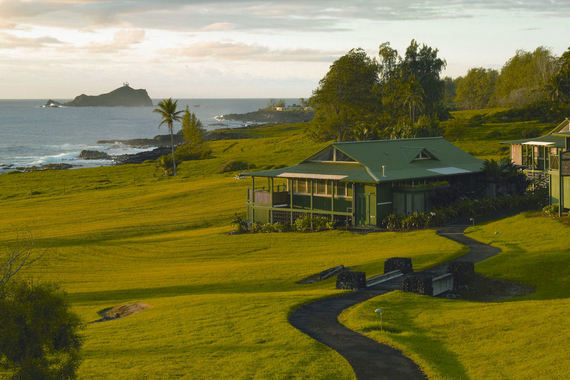


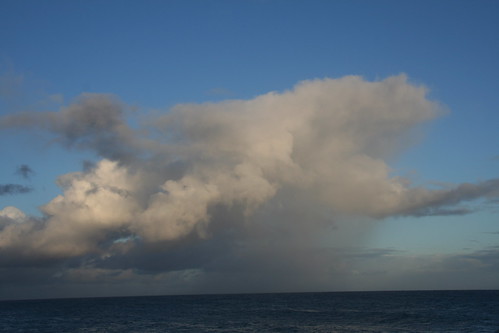
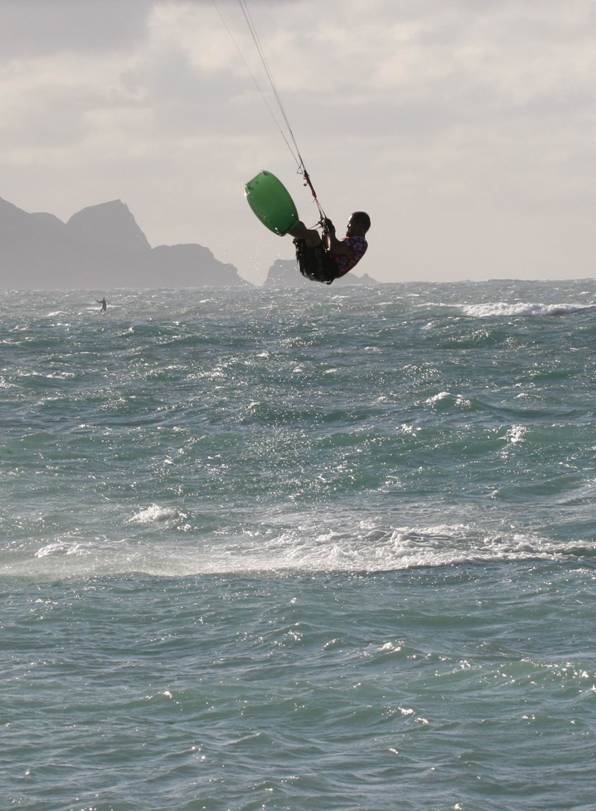
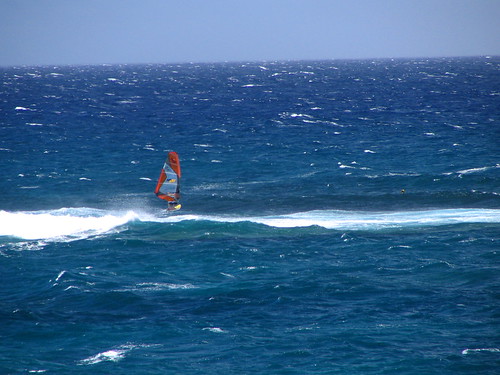


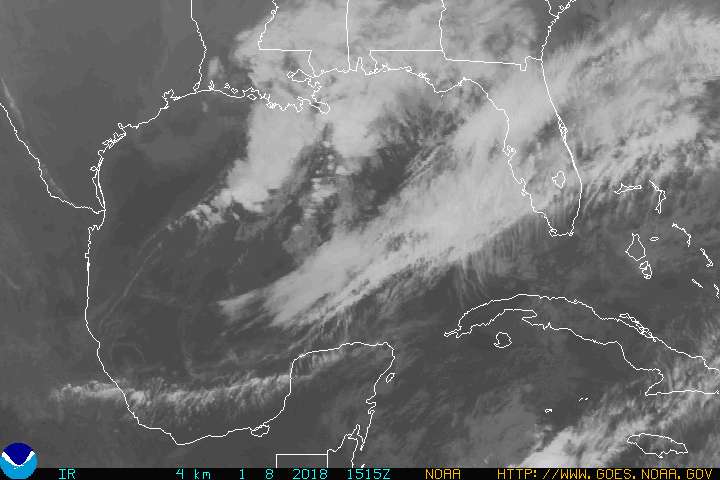