


March 1-2, 2010
Air Temperatures – The following maximum temperatures were recorded across the state of Hawaii Monday afternoon:
Lihue, Kauai – 73
Honolulu, Oahu – 78
Kaneohe, Oahu – 76
Kaunakakai, Molokai – 76
Kahului, Maui – 77
Hilo, Hawaii – 77
Kailua-kona – 88
Air Temperatures ranged between these warmest and coolest spots near sea level around the state – and on the highest mountains…at 5pm Monday evening:
Kailua-kona – 85F
Lihue, Kauai – 70
Haleakala Crater – 50 (near 10,000 feet on Maui)
Mauna Kea summit – 39 (near 14,000 feet on the Big Island)
Precipitation Totals – The following numbers represent the largest precipitation totals (inches) during the last 24 hours on each of the major islands, as of Monday afternoon:
0.19 Kapahi, Kauai
0.26 Hakipuu Mauka, Oahu
0.30 Molokai
0.00 Lanai
0.00 Kahoolawe
2.37 West Wailuaiki, Maui
5.92 Honokaa, Big Island
Marine Winds – Here’s the latest (automatically updated) weather map showing a 1034 millibar high pressure system to the north-northwest of Hawaii…moving eastward. This high pressure system, and its associated ridges, will keep strong and gusty winds in place through Wednesday.
Satellite and Radar Images: To view the cloud conditions we have here in Hawaii, please use the following satellite links, starting off with this Infrared Satellite Image of the islands to see all the clouds around the state during the day and night. This next image is one that gives close images of the islands only during the daytime hours, and is referred to as a Close-up visible image. This next image shows a larger view of the Pacific…giving perspective to the wider ranging cloud patterns in the Pacific Ocean. Finally, here’s a Looping IR satellite image, making viewable the clouds around the islands 24 hours a day. To help you keep track of where any showers may be around the islands, here’s the latest animated radar image.
Hawaii’s Mountains – Here’s a link to the live webcam on the summit of near 14,000 foot Mauna Kea on the Big Island of Hawaii. The tallest peak on the island of Maui is the Haleakala Crater, which is near 10,000 feet in elevation. These two webcams are available during the daylight hours here in the islands…and when there’s a big moon rising just after sunset for an hour or two! Plus, during the nights and early mornings you will be able to see stars, and the sunrise too…depending upon weather conditions.
Tropical Cyclone activity in the eastern and central Pacific – Here’s the latest weather information coming out of the National Hurricane Center, covering the eastern north Pacific. You can find the latest tropical cyclone information for the central north Pacific (where Hawaii is located) by clicking on this link to the Central Pacific Hurricane Center. Here’s a tracking map covering both the eastern and central Pacific Ocean. A satellite image, which shows the entire ocean area between Hawaii and the Mexican coast…can be found here.
Aloha Paragraphs
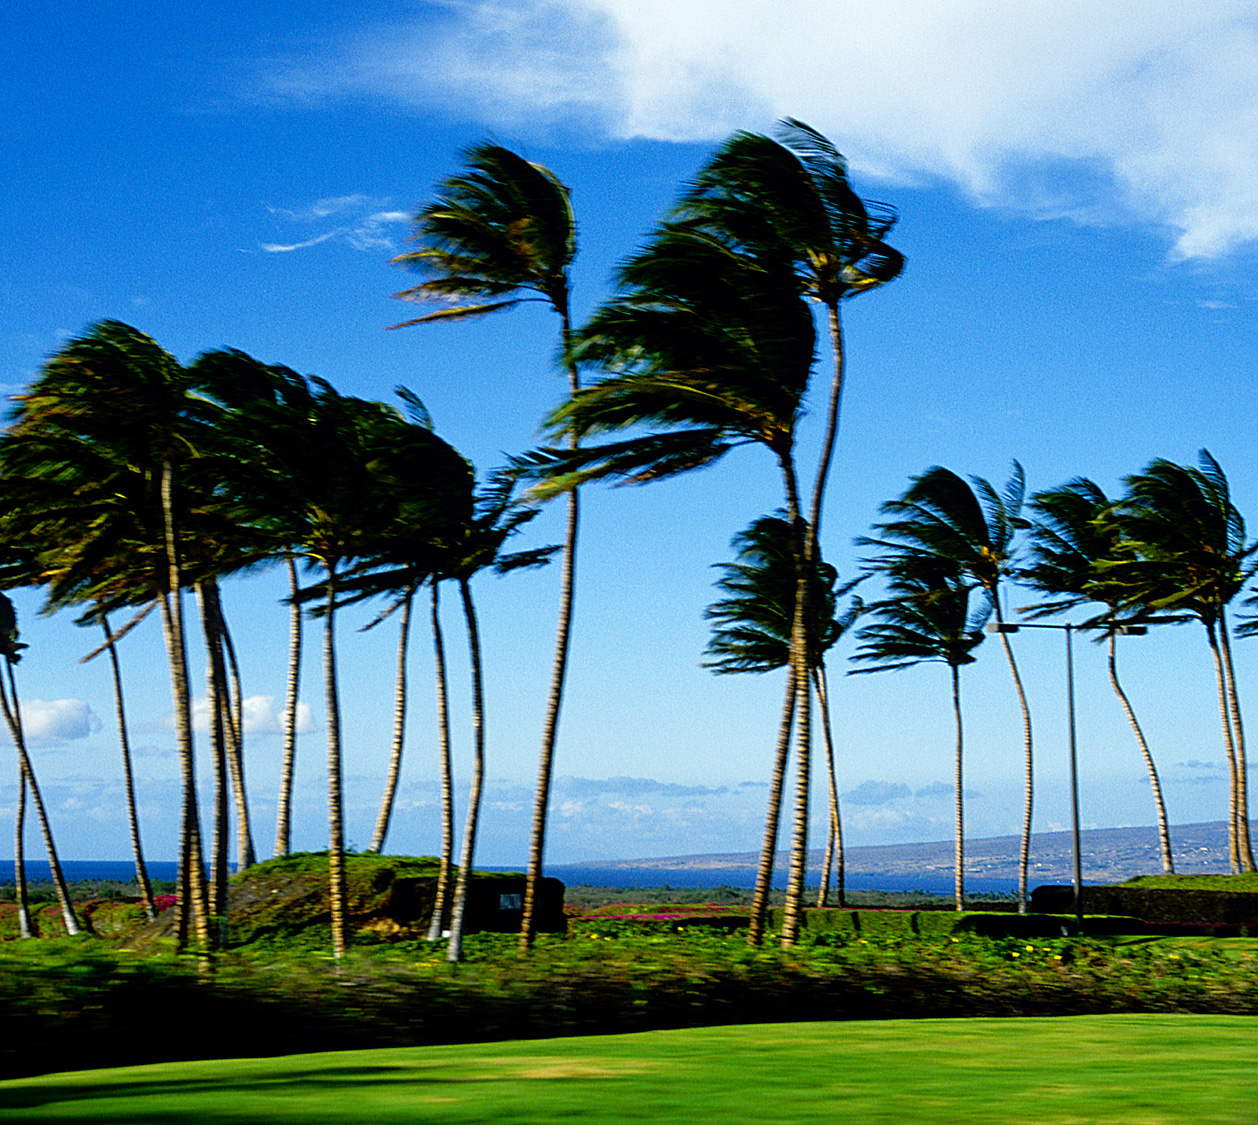
Blustery winds for several more days
To say the least, windy weather will be our most influential weather element over all the
The pressure gradient across the islands remains steep Monday evening, with strong and gusty winds having prompted many different kinds of advisories and warnings. The entire marine environment, at least in the coastal zones, are covered by small craft wind advisories. There are a couple of areas in the southern part of the state, including the Alenuihaha Channel, that have relatively unusual gale warning flags up now too. Another unusual aspect of this windy episode is the wind advisories that are covering the state now as well…these apply to the islands themselves. Speaking of the islands, we also have a red flag warning over those leeward areas from Kauai down through the
In the rainfall department, the recent cold front, which wasn’t expected to bring all that much precipitation…actually did. As it turned out, the
It’s Monday evening, as I begin writing the last section of today’s narrative. Windy weather dominates our Hawaiian Island weather picture as we move into Monday night. The strongest wind gusts as of around 5pm Monday included: 37 mph on Kauai; 38 on Oahu; 35 on Molokai; 51 mph on Lanai; 40 on Kahoolawe; 35 on Maui; and 60 mph on the Big Island! These are big numbers, and are evidence of the type of strong to very strong winds blowing across our islands at the moment. All this wind helped to keep our air temperatures on the cool side, that is in most areas. High temperatures topped out in the 70F’s across the board, except in one sea level location…which was the incredibly warm 88 degrees in Kona! There are no official records for the Kona airport of the Big Island, but I’m pretty sure that this would be close to it…if there were. ~~~ I’m about ready to head out into the wind tunnel outside, giving a friend a ride into Kahului to pick up her pickup truck at the service center. This will put me into some pretty good traffic, but I feel its good to help my friends out when I can. I’ll then head up the mountain to Kula, and should be back home in good time to sneak in my evening walk, before it gets dark. I’ll be back onlineagain early Tuesday morning with you next new weather narrative. I hope you have a great Monday night until then! Aloha for now…Glenn.
Just for the record: During the month of February, there were 329,305 hits on this website, which is getting pretty close to 1/3 of a million views. At the same time, there were 3,316 google clicks on my website, by you folks! The combination of which certainly verifies that I’m not writing to myself here! I want to thank each of you for your readership…it demonstrates also, that we have a good weather relationship going here! At the same time, this evening, I just did a google search on the key words Hawaii Weather, and this website came up at the top of the list! Something seems to be working out well here, and again…thanks for your support! Glenn
Interesting: The key to life as we know it is water, a tiny molecule with some highly unusual properties, such as the ability to retain large amounts of heat and to lose, instead of gain, density as it solidifies. It behaves so differently from other liquids, in fact, that by some measures it shouldn’t even exist. Now scientists have made a batch of new discoveries about the ubiquitous liquid, suggesting that an individual water molecule’s interactions with its neighbors could someday be manipulated to solve some of the world’s thorniest problems — from agriculture to cancer.
The work, led by Pradeep Kumar, a fellow at Rockefeller University’s Center for Studies in Physics and Biology who looks at the role of water in biology, makes it possible to measure how interaction between water molecules affect any number of properties in a system. It also paves the way for understanding how water can be manipulated to facilitate or prevent substances from dissolving in it, an advance that could impact every corner of society, from reforming agricultural practices to improving chemotherapy drugs whose side effects arise from their solubility or insolubility in water.
Interesting2: An asteroid strike may not only account for the demise of ocean and land life 65 million years ago, but the fireball’s path and the resulting dust, darkness and toxic metal contamination may explain the geographic unevenness of extinctions and recovery, according to Penn State geoscientists. "Our results shed light on the causes of nannoplankton extinction, how productivity was restored, the factors that controlled the origination of new species, and, ultimately, how phytoplankton influenced restoration of the entire marine ecosystem," the researchers report in this month’s issue of Nature Geoscience.
The researchers, using 823 samples from 17 drilling sites in both the Northern and Southern Hemispheres, analyzed the community structure of calcareous — shelled — nannoplankton. Included in their study were two sites — one in the Pacific and one in the South Atlantic — with reliable, accurate dating. "At the Cretaceous-Paleogene boundary, 93 percent of the nannoplankton went extinct," said Timothy J. Bralower, head and professor of geosciences. "Nannoplankton are the base of the food chain in the ocean.
If they go extinct, other, larger organisms that feed on them have problems." Scientists have collected large amounts of data on nannoplankton from this time period, but, according to Bralower, each sampling was looked at separately, and no one compiled the separate sampling results. Bralower, working with Shijun Jiang, postdoctoral fellow now at Florida State University and Mark E. Patzkowsky, associate professor of geosciences; Lee R. Kump, professor of geosciences, and Jonathan D. Schueth, graduate student in geosciences, all of Penn State, found that extinction level correlates with latitude.
The highest rate of extinctions is in the Northern Hemisphere with decreasing extinction levels in the Southern Hemisphere. Analysis of the signature of the asteroid that initiated the extinction event shows that the asteroid came into our atmosphere in the southeast and traveled toward the northwest ultimately colliding with Earth on the tip of the Yucatan Peninsula in Mexico. "This agrees with the fact that North American land plants were hammered and there was an especially sever mass extinction on that continent," said Bralower.
The initial dust and debris from the impact crater hit the Northern Hemisphere first and hardest. Low-diversity opportunistic organisms that appear when other nannoplankton disappear persisted in the Northern Hemisphere for 40 thousand years after the impact and this hemisphere then took 270 thousand years to recover. In the south, only intermediate levels of extinction occurred and greater diversity persisted, which agrees with the minor land plant changes in the Southern Hemisphere.
The darkness caused by the collision would impair photosynthesis and reduce nannoplankton reproduction. While full darkness did not occur, the effects in the north would have lasted for up to six months. However, with ample sunlight and large amounts of nutrients in the oceans, the populations should have bounced back, even in the North, but they did not. The researchers suggest that toxic metals that where part of the asteroid, heavily contaminated the Northern oceans and were the major factor inhibiting recovery.
"Metal loading is a great potential mechanism to delay recovery," said Bralower. "Toxic levels in the parts per billions of copper, nickel, cadmium and iron could have inhibited recovery." On the one hand, the researchers considered an impact scenario causing perpetual winter and ocean acidification to explain the slow recovery, but neither explains the lag between Southern and Northern Hemispheres. Trace metal poisoning, on the other hand, would have been severe near the impact in the Northern Hemisphere.
When the high temperature debris from the impact hit the water, copper, chromium, aluminum, mercury and lead would have dissolved into the seawater at likely lethal levels for plankton. Iron, zinc and manganese — normally micronutrients — would reach harmful levels shortly after the impact. Other metal sources might be acid-rain leached soils or the effects of wildfires. Metals like these can inhibit reproduction or shell formation.
The toxic metals probably exceeded the ability of organic compounds to bind them and remove them from the system. Because nannoplankton are the base of the food chain, larger organisms concentrate any metals found in nannoplankton making the metal poisoning more effective. With the toxic metals remaining in the oceans and the lack of sunlight, the length of time for recovery might increase. "We still do not really know why some things die out, while others hang on by a shoestring and eventually recover," said Bralower.
Interesting3: The Chile earthquake — at a magnitude of 8.8 — was much stronger than the one that hit Haiti, but casualties and damages appear to be far less. Why? The earthquake that struck Chile was far stronger than the one that struck Haiti in January. But, initial reports show that damage was much more contained.
While the death toll of 214 is only preliminary and is expected to grow, it’s still a thousand times lower than that of Haiti’s. One emergency official quoted by Reuters said the number of deaths was unlikely to increase dramatically. Because of its long history with earthquakes, which has contributed to an earthquake "consciousness" in Chile, and infrastructure that is built to higher standards, many hope that Chile will be spared the vast destruction that struck Haiti, even as it deals with one of its worst natural disasters in decades.
"Chile has a long story of earthquakes, but I think this was the worst ever," says Paula Saez, an aid worker at World Vision in Chile. The 8.8-magnitude quake that struck about 200 miles south of Santiago, is being billed as one of the world’s largest in a century, but it will most likely not go down as one of the deadliest. In part, that’s because Chile sits in the "ring of fire" earthquake zone and is accustomed to massive temblors, including the largest on record, which hit in 1960 and registered 9.5.
A few more days until full damage is known The government says that it might be another 72 hours before the real extent of the damage is known, as telecommunications are down in Concepcion, the city closest to the epicenter of the quake. Also, the earthquake impacted many rural areas, where the population is dispersed and hard to account for. In downtown Santiago, a sense of calm prevailed, after initial panic. Residents began collecting debris that had fallen on the streets and attempted to reopen businesses by midday.
Interesting4: On February 27, 2010 a magnitude 8.8 earthquake struck Maule, Chile causing widespread damage and casualties. The quake ranks as one of the ten strongest earthquakes ever recorded and was the most powerful earthquake worldwide since the 2004 Sumatran quake that triggered the massive Indian Ocean tsunami.
The Maule was the strongest earthquake to strike Chile since the magnitude 9.5 which hit Valdivia on May 22, 1960. A tsunami warning from the Maule quake has been issued for the U.S. west coast, British Columbia, and Alaska. The tsunami amplitude is expected to be minor.
May 22, 1960: Magnitude 9.5 earthquake killed 1,655, injured 3,000, left 2,000,00 homeless, and caused $550 million damage in southern Chile; while the ensuing tsunami caused 61 deaths, $75 million damage in Hawaii; 138 deaths and $50 million damage in Japan; 32 dead and missing in the Philippines; and $500,000 damage to the west coast of the United States.
March 27, 1964: Magnitude 9.2 quake in Prince William Sound, Alaska, and ensuing tsunami killed 128 people (tsunami 113, earthquake 15) and caused about $311 million in property loss. Anchorage, about 120 kilometers northwest of the epicenter, sustained the most severe property damage.
Dec. 26, 2004: Magnitude 9.1 quake off the Indonesian island of Sumatra triggered a tsunami that killed an estimated 228,000 people in 12 countries. Aug. 13, 1868: Magnitude 9.0 quake in Arica, Peru (now Chile) triggered tsunamis that killed more than 25,000 people in South America.
Nov. 4, 1952: Magnitude 9.0 earthquake in Kamchatka, USSR triggered a tsunami that caused property damage but no deaths in Hawaii.
Jan. 26, 1700: Magnitude 9.0 earthquake in the Cascadia subduction zone from mid-Vancouver Island in British Columbia along the Pacific Northwest coast.
Nov. 25, 1833: Magnitude 9.0 quake near Sumatra, Indonesia and ensuing tsunami caused extensive loss of life on the island.
Feb. 27, 2010: Magnitude 8.8 in Maule, Chile. Damage and loss of life presently unknown.
Jan. 31, 1906: Magnitude 8.8 off the coast of Ecuador and Colombia generated a strong tsunami that killed 500 to 1500 in coastal areas.
Nov. 1, 1755: Magnitude 8.7 quake in Lisbon, Portugal and ensuing tsunami killed an estimated 60,000 people and destroyed much of Lisbon.
Feb 4, 1965: Magnitude 8.7 quake in the Rat Islands, Alaska caused a 10.7-m-high tsunami on Shemya Island and no loss of life.
Jul. 8, 1730: Magnitude 8.7 quake in Valparasio, Chile, killed at least 3,000 people.
Mar. 28, 2005: Magnitude 8.7 quake quake off northern Sumatra island in Indonesia.
Deadliest earthquakes Jan. 23, 1556: 8 magnitude quake in Shaanxi, China, 830,000 deaths.
Jul. 27, 1976: 7.5 magnitude quake in Tangshan, China, 255,000-655,000 deaths
Aug. 8, 1138: Quake near Syria, Aleppo killed 230,000.
Dec. 26, 2004: Magnitude 9.1 quake off Sumatra killed 227,898 people.
Jan. 12, 2010: Magnitude 7.0 quake near Haiti killed 222,521 people (official estimate).
Frank Parrino Says:
Congratulations on the success of this website. Our visits here have increased right along w/ these gusty winds these last few days. Leeward Molokai really getting blasted yesterday,last night and this morning. Do us a favor and use your influence to pull them back just a smidge!~~~Hi Frank, good to hear from you again there on windy Molokai. I’ll look into moderating these gusty winds, hang in there…or should I say hang on! Aloha, Glenn
Helen Says:
March is certainly coming in like a lion !!
.
Aloha ,Helen
PS Congratulations on the success of your website; it is such a great resource. :)~~~Thanks Helen, Aloha, Glenn
Max Says:
Hey Glenn,
Where can I find access to wind readings at different stations in Hawaii? I live in Kohala Ranch, and as you mentioned above, the winds have been violent here for the last 18 hours. My friend, who has an at-home anemometer, recorded a wind gust of 63mph yesterday around 5pm.
Even now in the early morning the winds are still whipping through the palm trees at maybe 50mph in the highest gusts.
Honestly, I love it! It’s about time we got some exciting weather.~~~Hi Max, you can find the hourly wind observations by going here: http://www.prh.noaa.gov/data/HFO/OSOHFO
I know what you mean, all this wind and stuff is very interesting! Hang on there my friend, Aloha, Glenn