


November 12-13, 2009
Air Temperatures – The following maximum temperatures were recorded across the state of Hawaii Thursday afternoon:
Lihue, Kauai – 81
Honolulu, Oahu – 84
Kaneohe, Oahu – 82
Kaunakakai, Molokai – 83
Kahului, Maui – 83
Hilo, Hawaii – 83
Kailua-kona – 82
Air Temperatures ranged between these warmest and coolest spots near sea level around the state – and on the highest mountains…at 5pm Thursday evening:
Barking Sands, Kauai – 83F
Hilo, Hawaii – 72
Haleakala Crater – 43 (near 10,000 feet on Maui)
Mauna Kea summit – 32 (near 14,000 feet on the Big Island)
Precipitation Totals – The following numbers represent the largest precipitation totals (inches) during the last 24 hours on each of the major islands, as of Thursday afternoon:
0.41 Kokee, Kauai
0.16 Hakipuu Mauka, Oahu
0.00 Molokai
0.00 Lanai
0.01 Kahoolawe
0.24 Kahakuloa, Maui
1.78 Hilo airport, Big Island
Marine Winds – Here’s the latest (automatically updated) weather map showing a strong 1036 millibar high pressure system far to the north-northeast of the islands. Winds will veer from the southeast…with returning easterly trade winds into the weekend.
Satellite and Radar Images: To view the cloud conditions we have here in Hawaii, please use the following satellite links, starting off with this Infrared Satellite Image of the islands to see all the clouds around the state during the day and night. This next image is one that gives close images of the islands only during the daytime hours, and is referred to as a Close-up visible image. This next image shows a larger view of the Pacific…giving perspective to the wider ranging cloud patterns in the Pacific Ocean. Finally, here’s a Looping IR satellite image, making viewable the clouds around the islands 24 hours a day. To help you keep track of where any showers may be around the islands, here’s the latest animated radar image.
Hawaii’s Mountains – Here’s a link to the live webcam on the summit of near 14,000 foot Mauna Kea on the Big Island of Hawaii. The tallest peak on the island of Maui is the Haleakala Crater, which is near 10,000 feet in elevation. These two webcams are available during the daylight hours here in the islands…and when there’s a big moon rising just after sunset for an hour or two! Plus, during the nights and early mornings you will be able to see stars, and the sunrise too…depending upon weather conditions.
Tropical Cyclone activity in the eastern and central Pacific – Here’s the latest weather information coming out of the National Hurricane Center, covering the eastern north Pacific. You can find the latest tropical cyclone information for the central north Pacific (where Hawaii is located) by clicking on this link to the Central Pacific Hurricane Center. Here’s a tracking map covering both the eastern and central Pacific Ocean. A satellite image, which shows the entire ocean area between Hawaii and the Mexican coast…can be found here.
Aloha Paragraphs
Heavy showers and thunderstorms into Friday
A complicated weather pattern has unfolded across the Aloha state Thursday, with lots of cold air aloft. In addition, we have tropical moisture streaming north and westward across the islands, feeding heavy rainfall locally. The islands have finally seen some of the well advertised generous precipitation. This satellite image shows the big picture, with all the thunderstorms around now. This satellite image shows a closer look at that those thunderstorms roaming around all of the islands…as we head into the night hours. This looping radar image shows lots of precipitation embedded in these clouds, over our islands as well.
This cold air has triggered snowfall for the
This shift in wind direction will have a rather definite impact on our rainfall. Starting Friday, at least on the
There’s lots of action around the Hawaiian Islands as we move into Thursday night. If you had a chance to check out the satellite image above, you see that there are an exceptional amount of rainy clouds around. We’re not through with the rain yet, with still that chance of flooding rainfall into Friday. Here’s a good looping satellite image showing all the dynamics around the Hawaiian Islands. Be careful when you’re out driving, as roads are dangerous where those heavy downpours occur. As we move into the weekend, the focus for showers will move over to the windward sides. The trade winds are expected to become strong and gusty starting later Friday into Saturday and Sunday. These trades will carry lots of showers our way, although the leeward sides, at least in some places, will find less threat of showers then. We can look forward to better weather after the weekend. ~~~ By the way, it finally started snowing atop Mauna Kea on the Big Island…according to all the ice and snow on the camera lens on this current webcam picture…viewable during the light of day. ~~~ I’m just now leaving Kihei, and I’m getting reports of lots of lightning and thunder around now, which I can’t wait to witness first hand. I’ll catch up with you later depending upon what all comes down over the next few hours, or…certainly by early Friday morning. ~~~ Oh my gosh, when I got home it has been thundering and lightning like crazy! I just heard the most magnificent clap(s) of thunder I can remeber in a long time. Wow!! I hope you have a great Thursday night! Aloha for now…Glenn.
Interesting: You don’t have to look far to see just how much concrete humans use. Everything from highways to high-rise and bridges to runways around the world are made with the energy-intensive, carbon-spewing material. Contributing at least 5 percent of global carbon dioxide (CO2) emissions, the cement industry is ripe for changes to lower its impact. Cement, the glue that binds concrete, is one of the most carbon-intensive materials out there: It produces one ton of CO2 for every ton of cement made.
The main culprit responsible for the industry’s emissions is Portland cement, the most commonly used type of cement, which is created through an energy-intensive process of crushing raw materials and heating them to up to 3,000 degrees Fahrenheit. Many companies are reducing the amount of Portland cement needed in concrete by replacing some of it with fly ash, a byproduct of coal-fired power plants. In addition to eliminating some of the emissions and raw materials associated with Portland cement, fly ash makes concrete stronger and easier to work with.
Interesting2: Ken Salazar, Secretary of the Interior, Assistant Secretary for Fish and Wildlife and Parks Tom Strickland, and U.S. Fish and Wildlife Service Director Sam Hamilton announced that the brown pelican, a species once decimated by the pesticide DDT, has recovered and is being removed from the list of threatened and endangered species under the Endangered Species Act. The brown pelican was first declared endangered in 1970. Since then, thanks to a ban on DDT and efforts by states, conservation organizations, private citizens and many other partners, the bird has recovered. There are now more than 650,000 brown pelicans found across Florida and the Gulf and Pacific Coasts, as well as in the Caribbean and Latin America.
"After being hunted for its feathers, facing devastating effects from the pesticide DDT and suffering from widespread coastal habitat loss, the pelican has made a remarkable recovery," Strickland said at a press conference in New Orleans to announce the delisting. "We once again see healthy flocks of pelicans in the air over our shores." The pelican’s recovery is largely due to the federal ban on the general use of the pesticide DDT in 1972.
This action was taken after former U.S. Fish and Wildlife Service biologist Rachel Carson published Silent Spring and alerted the nation to the widespread dangers associated with unrestricted pesticide use. In the southwest, the Texas Parks and Wildlife Department, The Nature Conservancy and numerous other conservation organizations helped purchase important nesting sites and developed monitoring programs to ensure pelican rookeries were thriving.
Louisiana, long known as the "pelican state," and the Florida Game and Fresh Water Fish Commission jointly implemented a restoration project. A total of 1,276 young pelicans were captured in Florida and released at three sites in southeastern Louisiana during the 13 years of the project. Past efforts to protect the brown pelican actually led to the birth of the National Wildlife Refuge System more than a century ago in central Florida. German immigrant Paul Kroegel, appalled by the indiscriminate slaughter of pelicans for their feathers, approached President Theodore Roosevelt.
This led Roosevelt to create the first National Wildlife Refuge at Pelican Island in 1903, when Kroegel was named the first refuge manager. Today, the system has grown to 550 national wildlife refuges, many of which have played key roles in the recovery of the brown pelican.
Interesting3: Australia’s koalas could be wiped out within 30 years unless urgent action is taken to halt a decline in population, according to researchers. Development, climate change and bushfires have all combined to send the numbers of wild koalas plummeting. A recent survey showed the population could have dropped by more than half in the past six years. Previous estimates put the number of koalas at more than 100,000 – but the latest calculations suggest there could now be as few as 43,000.
In one area in northern Queensland estimated to have 20,000 koalas a decade ago, a team of eight people could not find a single animal in four days of searching. As well as problems caused by deforestation, hotter, drier conditions attributed to global warming had reduced the nutritional value of their staple food, eucalyptus leaves, leading to malnutrition. Many have been killed by the sexually transmitted disease chlamydia.
Interesting4: Georgia Tech City and Regional Planning Professor Brian Stone is publishing a paper in the December edition of Environmental Science and Technology that suggests policymakers need to address the influence of global deforestation and urbanization on climate change, in addition to greenhouse gas emissions. According to Stone’s paper, as the international community meets in Copenhagen in December to develop a new framework for responding to climate change, policymakers need to give serious consideration to broadening the range of management strategies beyond greenhouse gas reductions alone.
"Across the U.S. as a whole, approximately 50 percent of the warming that has occurred since 1950 is due to land use changes (usually in the form of clearing forest for crops or cities) rather than to the emission of greenhouse gases," said Stone. "Most large U.S. cities, including Atlanta, are warming at more than twice the rate of the planet as a whole — a rate that is mostly attributable to land use change. As a result, emissions reduction programs — like the cap and trade program under consideration by the U.S. Congress — may not sufficiently slow climate change in large cities where most people live and where land use change is the dominant driver of warming."
Interesting5: Exposure to air pollution can damage newborns’ lungs and assault their immune systems, making babies more vulnerable to disease. Chronic exposure to air pollution, the study found, increases a baby’s chance of developing bronchiolitis — a lung infection that is the most common cause of hospitalizations in the first year of life. The findings suggest that parents and pediatricians need to work together to reduce infants’ exposure to traffic and other sources of dirty air, said study author Catherine Karr, an academic pediatrician at the University of Washington, Seattle. That’s true no matter where families live, she added.
Interesting6: The United States, Canada, and Mexico agreed this week to work together to protect wilderness areas across North America. The cooperation agreement establishes an intergovernmental committee to exchange research and approaches that address challenges such as climate change, fire control, and invasive species in land, marine, and coastal protected areas throughout the continent.
"This agreement will allow for the exchange of successful experiences, monitoring, and training of human resources, as well as the financing of projects that will protect and recover wild areas," said Mexican President Felipe Calderón at the opening ceremony of the Ninth World Wilderness Congress in Mérida, Mexico.
The three nations have long cooperated on wilderness management – programs have straddle the U.S.-Canadian border since 1910 and the U.S.-Mexican border since the 1930s. Yet the memorandum of understanding is the first multinational agreement on wilderness protection, according to Vance Martin, president of the Wild Foundation.
Interesting7: Just months – that’s how long it took for Europe to be engulfed by an ice age. The scenario, which comes straight out of Hollywood blockbuster The Day After Tomorrow, was revealed by the most precise record of the climate from palaeohistory ever generated. Around 12,800 years ago the northern hemisphere was hit by the Younger Dryas mini ice age, or "Big Freeze". It was triggered by the slowdown of the Gulf Stream, led to the decline of the Clovis culture in North America, and lasted around 1300 years.
Until now, it was thought that the mini ice age took a decade or so to take hold, on the evidence provided by Greenland ice cores. Not so, say William Patterson of the University of Saskatchewan in Saskatoon, Canada, and his colleagues. The group studied a mud core from an ancient lake, Lough Monreagh, in western Ireland. Using a scalpel they sliced off layers 0.5 to 1 millimetre thick, each representing up to three months of time. No other measurements from the period have approached this level of detail.
Carbon isotopes in each slice revealed how productive the lake was and oxygen isotopes gave a picture of temperature and rainfall. They show that at the start of the Big Freeze, temperatures plummeted and lake productivity stopped within months, or a year at most. "It would be like taking Ireland today and moving it up to Svalbard" in the Arctic, says Patterson, who presented the findings at the BOREAS conference in Rovaniemi, Finland, on 31 October.
"This is significantly shorter than what has been suggested before, but it is plausible," says Derek Vance of the University of Bristol, UK. Hans Renssen, a climate researcher at Vrije University in Amsterdam, the Netherlands, says recent findings from Greenland ice cores indicate the Younger Dryas event may have happened in one to three years. Patterson’s results confirm this was a very sudden change, he says. The mud slices from the end of the Big Freeze show that it took around two centuries for the lake and climate to recover.
Ken Says:
Love to check in on your lovely weather…while I’m freezing to death. :)~~~Ken, our weather will be lovely through most of the rest of this week, if not all week. Try and stay warm, and it will even be a little cool at night here in the islands now. Thanks for your chilly note! Aloha, Glenn
Helen Says:
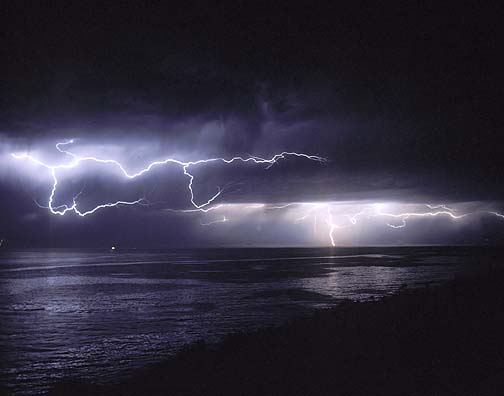
Mahalo Glenn you came back just in time. I was hoping you would have a picture of the lightning over the ocean.
So majestic !~~~Hi Helene, you’re absolutely right…I came back just in time – smile! Aloha, Glenn
Eliza Says:
Hi Glenn – Well, the Gods and Goddesses are having a pleasant bowling match in the skies above upper Ha`iku. Mostly since 130p or so. Rare are rain showers as well as seeing the flashes of lightning.
Ahhh, the ever changing fun of weather! Smiles ~ Eliza~~~Hi Eliza, thanks for your fun on the spot report. The latest radar sure shows some heavy rain from your area all the way out to Hana and Kipahulu. Just very cloudy here in Kihei…a few sprinkles so far. Enjoy!! Aloha, Glenn
Dori Thorngren Says:
Hi Glenn,
Are you still on MCC channel 55 at 7:45 AM M-F? You weren’t on today.~~~Dori, I discontinued doing the show almost a year ago, you must be here on vacation. I’d recommend using my website, as apparently you did, as I keep this site updated on a daily basis, unless I’m on vacation that is. I hope you have a great time here on Maui. Aloha, Glenn
John Franzen Says:
Welcome back to Hawaii Glenn. Glad you had a good trip. Hope you had a good Veteran’s day. I was also drafted & sent to Nam (Jan69). I lead a Blessed life. I was in Infantry humping the bush for many months but never fired my rifle the whole year. I was in a recon platoon. Our job was just to find out things. For the first few months we had a great Lt named Tony. If he thought we were headed for contact we would pick a different direction.
I could go on & on of course.
John~~~Hi John, thanks for your welcome back, I did have a great trip, and a good Veterans Day too. I was in the bush too, although our unit got into many fire fights, which was quite an experience…to say the absolute least! I could go on and on as well, although the truth is that I rarely think about that period in my life. Glad you came back safe and sound! Aloha, Glenn