

March 1-2, 2009
Air Temperatures – The following maximum temperatures were recorded across the state of Hawaii Sunday afternoon:
Lihue, Kauai – 74
Honolulu, Oahu – 79
Kaneohe, Oahu – 75
Kahului, Maui – 74
Hilo, Hawaii – 76
Kailua-kona – 81
Air Temperatures ranged between these warmest and coolest spots near sea level – and on the highest mountains…at 4 p.m. Sunday afternoon:
Kailua-kona – 78F
Hilo, Hawaii – 71
Haleakala Crater – 45 (near 10,000 feet on Maui)
Mauna Kea summit – 32 (near 14,000 feet on the Big Island)
Precipitation Totals – The following numbers represent the largest precipitation totals (inches) during the last 24 hours on each of the major islands, as of Sunday afternoon:
0.50 Mount Waialeale, Kauai
0.21 Oahu Forest NWR, Oahu
0.06 Molokai
0.09 Lanai
0.00 Kahoolawe
0.88 Puu Kukui, Maui
0.27 Kamuela Upper, Big Island
Weather Chart – Here’s the latest (automatically updated) weather map showing a strong 1036 millibar high pressure system located far to the north-northwest of the islands. This high pressure system will cause strong and gusty ENE winds Monday and Tuesday.
Satellite and Radar Images: To view the cloud conditions we have here in Hawaii, please use the following satellite links, starting off with the Infrared Satellite Image of the islands to see all the clouds around the state during the day and night. This next image is one that gives close images of the islands only during the daytime hours, and is referred to as a Close-up visible image. This next image shows a larger view of the Pacific…giving perspective to the wider ranging cloud patterns in the Pacific Ocean. Finally, here’s a looping IR satellite image, making viewable the clouds around the islands 24 hours a day. To help you keep track of where any showers may be around the islands, here’s the latest animated radar image.
Hawaii’s Mountains – Here’s a link to the live webcam on the summit of near 14,000 foot Mauna Kea on the Big Island of Hawaii. The tallest peak on the island of Maui is the Haleakala Crater, which is near 10,000 feet in elevation. These two webcams are available during the daylight hours here in the islands…and when there’s a big moon rising just after sunset for an hour or two! Plus, during the nights and early mornings you will be able to see stars, and the sunrise too…depending upon weather conditions.
Aloha Paragraphs
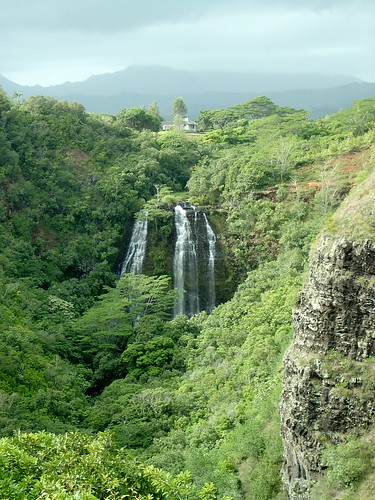
A beautiful waterfall on Kauai
The strong and gusty winds will last through the next several days, although begin to moderate as we move into the middle of the upcoming new week. Looking at this latest weather map, we find a still strong, although reduced 1038 millibar high pressure system in the area north-northwest of Hawaii Sunday. These blustery NE winds, with their associated wind chill, will keep cooler than normal weather in place during the days. The NWS in Honolulu has small craft wind advisories active across all of Hawaii’s coasts and channel waters, along with a high surf advisory for surf breaking along our east facing beaches. The NWS office is keeping its wind advisory active for the entire state of Hawaii.
NWS wind advisory: STRONG NORTHEAST WINDS OF 15 TO 30 MPH WITH GUSTS TO 50 MPH WILL CONTINUE THROUGH MONDAY EVENING. THE HIGHEST WIND SPEEDS WILL OCCUR WHERE THE WIND BLOWS THROUGH VALLEYS, OVER RIDGES, AROUND HEADLANDS AND DOWNSLOPE ON THE SOUTHWEST, LEEWARD SIDES OF THE ISLANDS. THE STRONGEST WINDS MAY BE VERY LOCALIZED.
Showers will fall at times along the windward coasts and slopes…carried over into the leeward sides briefly on the gusty winds. The showers arriving along the north and east sides of the islands, will generally be of the small drop variety. There will be periods of gray clouds and quickly passing drizzle and mist, and that cool air along the windward sides…with high temperatures restricted to the 70F’s at sea level…except in Kona, on the Big Island. This cooler than normal weather will remain anchored over the islands through the next several days.
The strong and gusty NE winds will remain the primary weather feature everywhere through the next several days. The winds are generally the lightest during the morning hours, which increase during the late morning through early evening hours. The following numbers represented the strongest gusts (mph) on each of the islands at around 4pm Sunday afternoon:
Kauai: 38
Oahu: 39
Molokai: 32
Maui: 42
Kahoolawe: 38
Lanai: 39
Big Island: 48
It’s Sunday morning here in Kula, Maui, as I begin writing this last section of today’s weather narrative. As noted in the paragraphs above, the cool weather is hanging on over us, and will hold on for several more days. Our local weather will remain cool and windy, with passing light showers at times too…although most of those will occur along our windward sides. As we move into the new week ahead, we will continue to see the windy weather, making for inordinately blustery weather in many places across the Aloha State. It looks as if our winds will turn more easterly around mid-week, allowing warmer weather to return. The latest computer models show that the trade winds, during the second half of the upcoming week, will turn wetter.
The windward sides will remain cloudy with light showers falling at times, while the leeward sides will find high clouds dimming our sunshine Sunday. As this looping satellite image shows, we have quite a few cloud lines, or shower bands, being pushed our way on the the strong and gusty winds. These will bring those passing showers, most notably during the night and morning hours. At the same time, we see high clouds being carried our way on the higher level winds, coming in from the west. These cirrus clouds will dim and filter our sunshine at times too.
At a little 8am Sunday morning, there are misty clouds banked up against the windward sides…while the high clouds reside above. The air temperature is 47.5F degrees up here in Kula, with partly cloudy skies, and not a breath of air moving. This of course is in contrast to the stronger winds blowing elsewhere. I actually slept in a bit this morning, finally peeling myself out of bed at 730am, which is very late for this early rising Maui weatherman. It felt good, mostly because of the early hour I usualy rise through the rest of the week. I hope you had a good Saturday night, and were able to get up at whatever time pleased you. Sunday is a day of rest, although for me, I plan to change the oil on my car, among other domestic chores. I’ll be back later in the day, to add more detail to this page, and if you’re inclined, please stop back by. Aloha for now…Glenn.
And number 2!!
Interesting: Global airlines be forewarned: June 2010 could be a busy month for invasive plants, insects and animals seeking free rides to distant lands. A new study forecasts when climate factors such as temperature, humidity and rainfall will match at geographically distant airline departure and destination points, which could help to shuffle invasive species, and the diseases they may carry, across the globe along existing flight routes.
The findings provide a framework that could help people who monitor airline flights — and the people, baggage and cargo aboard — to plan more efficiently and accurately for detecting and intercepting invasives. Andy Tatem, who holds a joint position at the Emerging Pathogens Institute and the University of Florida’s geography department, said his model uses the latest forecast data for climate change and air traffic volumes.
“The problem is that as the global transport networks expand, we’re getting more and more invasive species and pathogens coming from different parts of the world that have survived isolated for thousands of years,” said Tatem, who joined UF in January. “But now they have this high-speed link going between different regions of the world.”
The study was published online Jan. 22 in the journal Ecography, and the work was performed in his previous position at the University of Oxford. Tatem predicts a peak risk will be reached in June 2010, when multiple factors converge to create a month when the climate factors at many flight origin and destination airports would be most similar. “The model shows us that climatic shifts are not greatly significant over the next few years,” Tatem said.
“But the great increase in traffic volumes from expanding economies in India and China are likely to have a significant effect on moving species. This gives us much more of a detailed idea on the importance of key risk factors and how these change over time, compared to previous work we did in 2007.”
Interesting2: A new map of the Earth’s gravitational force based on satellite measurements makes it much less resource intensive to find new oil deposits. The map will be particularly useful as the ice melts in the oil-rich Arctic regions. Ole Baltazar, senior scientist at the National Space Institute, Technical University of Denmark (DTU Space), headed the development of the map.
The US company Fugro, one of the world’s leading oil exploration companies, is one of the companies that have already made use of the gravitational map. The company has now initiated a research partnership with DTU Space. “Ole Baltazar’s gravitational map is the most precise and has the widest coverage to date,” says Li Xiong, Vice President and Head Geophysicist with Fugro.
“On account of its high resolution and accuracy, the map is particularly useful in coastal areas, where the majority of the oil is located.” Ole Baltazar’s map shows variations in gravitational force across the surface of the Earth and knowledge about these small variations is a valuable tool in oil exploration.
Subterranean oil deposits are encapsulated in relatively light materials such as limestone and clay and because these materials are light, they have less gravitational force than the surrounding materials. Ole Baltazar’s map is based on satellite measurements and has a hitherto unseen level of detail and accuracy. With this map in your hands, it is, therefore, easier to find new deposits of oil underground.
Interesting3: A study by researchers at Johns Hopkins University found an association between increasing levels of indoor particulate matter pollution and the severity of asthma symptoms among children. The study, which followed a group of asthmatic children in Baltimore, Md., is among the first to examine the effects of indoor particulate matter pollution. Particulate matter is an airborne mixture of solid particles and liquid droplets.
The solid particles come in numerous shapes and sizes and may be composed of different chemical components. Fine particles measure 2.5 microns or less in size (approximately 1/30th the diameter of a human hair) and can penetrate deep into the body’s respiratory system. Coarse particles fall between 2.5 and 10 microns in diameter.
These larger particles can also enter the respiratory system and can be produced indoors through activities such as cooking and dusting. The U.S. Environmental Protection Agency (EPA) regulates outdoor levels of fine particle pollution, but does not have a standard for coarse particle pollution. There are no regulations for indoor pollution.
Interesting4: Climate researchers expected to see wet/dry periods in Brazil’s Nordeste region similar to the rest of South America in the past 9,000 years. But the area experienced the opposite, drought when rain was expected. Using stalagmite data, researchers identify unexpected air circulation as the cause. Until recently, researchers studying climate history in Brazil’s dry Nordeste region expected it to have wet and dry periods similar to the rest of South America.
But over the past 9,000 years, the region has shown just the opposite, drought when rain was expected, and vice versa. Geoscientists from the University of Massachusetts Amherst and the University of Sao Paolo, Brazil, with others, report this week that they’ve identified the cause as a surprising air circulation pattern.
As Stephen Burns, a UMass Amherst geoscientist explains, “In general, the Northern Hemisphere tropics have been getting drier and the Southern Hemisphere tropics have been getting wetter as maximum summer solar heating shifts southward.
But Northeast Brazil has been acting like a Northern Hemisphere site and it’s been getting steadily drier from about 9,000 years ago to today.” Millions of people there must cope with severely disruptive, recurring droughts, Burns and colleagues point out. A more accurate model of past conditions could help predict what to expect in the future.
Interesting5: Mexico City is one of the largest urban agglomerates in the World and as such suffers from extreme atmospheric contamination. It contributes 1.5% of the worlds total greenhouse gas emissions. In fact, conditions are so bad that around 4,000 people die every year as a direct result of air contamination and last year the Human Right Commission of the District Federal declared the city in “violation of the right to a healthy environment.”
The project “Sustainable Housing Units” seeks to tackle air pollution with design and engineering measures for residential building, so that residents may one day breathe more easily and see more clearly in a restored and vegetative urban environment.
Over the last decade some major environmental problems have emerged and received considerable coverage in public media. These situations, such as the extinction of many bird species from the contamination levels, have motivated actions from civil society groups, international organization, and more recently, the Mayor’s Office of Mexico City.
This latest project seeks to achieve a greener and healthier urban environment for citizens through innovative measures such as the installation of “vertical gardens,” rain water filters, and solar panels in buildings.
Interesting6: Global climate rapidly shifted from a relatively ice-free world to one with massive ice sheets on Antarctica about 34 million years ago. What happened? What changed? A team of scientists led by Yale geologists offers a new perspective on the nature of changing climatic conditions across this greenhouse-to-icehouse transition — one that refutes earlier theories and has important implications for predicting future climate changes. Detailed in the February 27 issue of Science, their data disproves a long-held idea that massive ice growth in the Antarctic was accompanied by little to no global temperature change.
This report shows that before the Southern Hemisphere ice expansion, high-latitude temperatures were at least about 18?F warmer than previously estimated and that there was a 10 – 20F degree drop in surface-water temperature during the climate transition. "Previous reconstructions gave no evidence of high-latitude cooling," according to senior author Mark Pagani, professor of geology and geophysics at Yale. "Our data demonstrate a clear temperature drop in both hemispheres during this time."
Interesting7: A blast of hot, northerly winds sent temperatures soaring and helped to spark another outbreak of brushfires in southeastern Australia’s state of Victoria Friday. Earlier this month, the state suffered through the tragic "Black Saturday" fires that claimed the lives of 210 people and destroyed more than 2,000 homes. Much of western Victoria withered under 100-degree heat Friday.
The state capital, Melbourne, was as hot as 96 degrees, or fully 20 degrees above average. Late in the day and during the evening, a cold front brought significant cooling to the region. However, stiff southwesterly winds in the wake of the front stoked the blazes. Furthermore, stray thunderstorms triggered by the cold front dropped little or no beneficial rain and, instead, produced lightning strikes that started new fires.
By Friday evening, firefighters were battling four major infernos and several smaller, but still dangerous blazes. Along with high heat, dry weather has played a major role in the recent spate of wildfires. Melbourne, for example, received merely 0.15 of an inch of rain this year through Friday, whereas the average rainfall during this time is about 3.5 inches. This is likely to be the driest January-February period on record in the city. At the moment, the first two months of 1893 hold that distinction with 0.44 of an inch of rain.
Interesting8: Commercial ships emit almost half as much particulate pollutants into the air globally as the total amount released by the world’s cars, according to a new study led by the National Oceanic and Atmospheric Administration and the University of Colorado at Boulder. The study is the first to provide a global estimate of maritime shipping’s total contribution to air particle pollution based on direct emission measurements.
The authors estimate ships emit about 1,100 tons of particle pollution globally each year. Ship pollutants affect both global climate and the health of people living along coastlines, according to the study authors. The findings appear online the week of Feb. 23 in the Journal of Geophysical Research.
"Since more than 70 percent of shipping traffic takes place within 250 miles of the coastline, this is a significant health concern for coastal communities," said lead study author Daniel Lack, a researcher with the NOAA-supported CU Cooperative Institute for Research in Environmental Sciences based at NOAA’s Earth System Research Laboratory in Boulder.Earlier research by one of the study’s co-authors, James Corbett of the University of Delaware, linked particle pollution to premature deaths among coastal populations.
Commercial ships emit both particle pollution and carbon dioxide, but they have opposite effects on the climate, said the researchers. The particles have a global cooling effect that is at least five times greater than the global warming effect from the ships’ CO2 emissions.


