


Air Temperatures – The following maximum temperatures (F) were recorded across the state of Hawaii Thursday…along with the minimums Thursday:
81 – 69 Lihue, Kauai
83 – 71 Honolulu, Oahu
83 – 59 Molokai AP
84 – 62 Kahului, Maui
84 – 71 Kailua Kona
83 – 65 Hilo, Hawaii
Here are the latest 24-hour precipitation totals (inches) for each of the islands, as of Thursday evening:
0.81 N Wailea ditch, Kauai
0.38 Poamoho RG 1, Oahu
0.04 Puu Alii, Molokai
0.00 Lanai
0.00 Kahoolawe
0.10 Kula 1, Maui
1.16 Honaunau, Big Island
The following numbers represent the strongest wind gusts (mph)…as of Thursday evening:
18 Waimea Heights, Kauai – SW
15 Waianae Valley, Oahu – SE
12 Molokai – NE
13 Lanai – SW
13 Kahoolawe – SE
13 Kaupo Gap, Maui – S
18 Puu Mali, Big Island – W
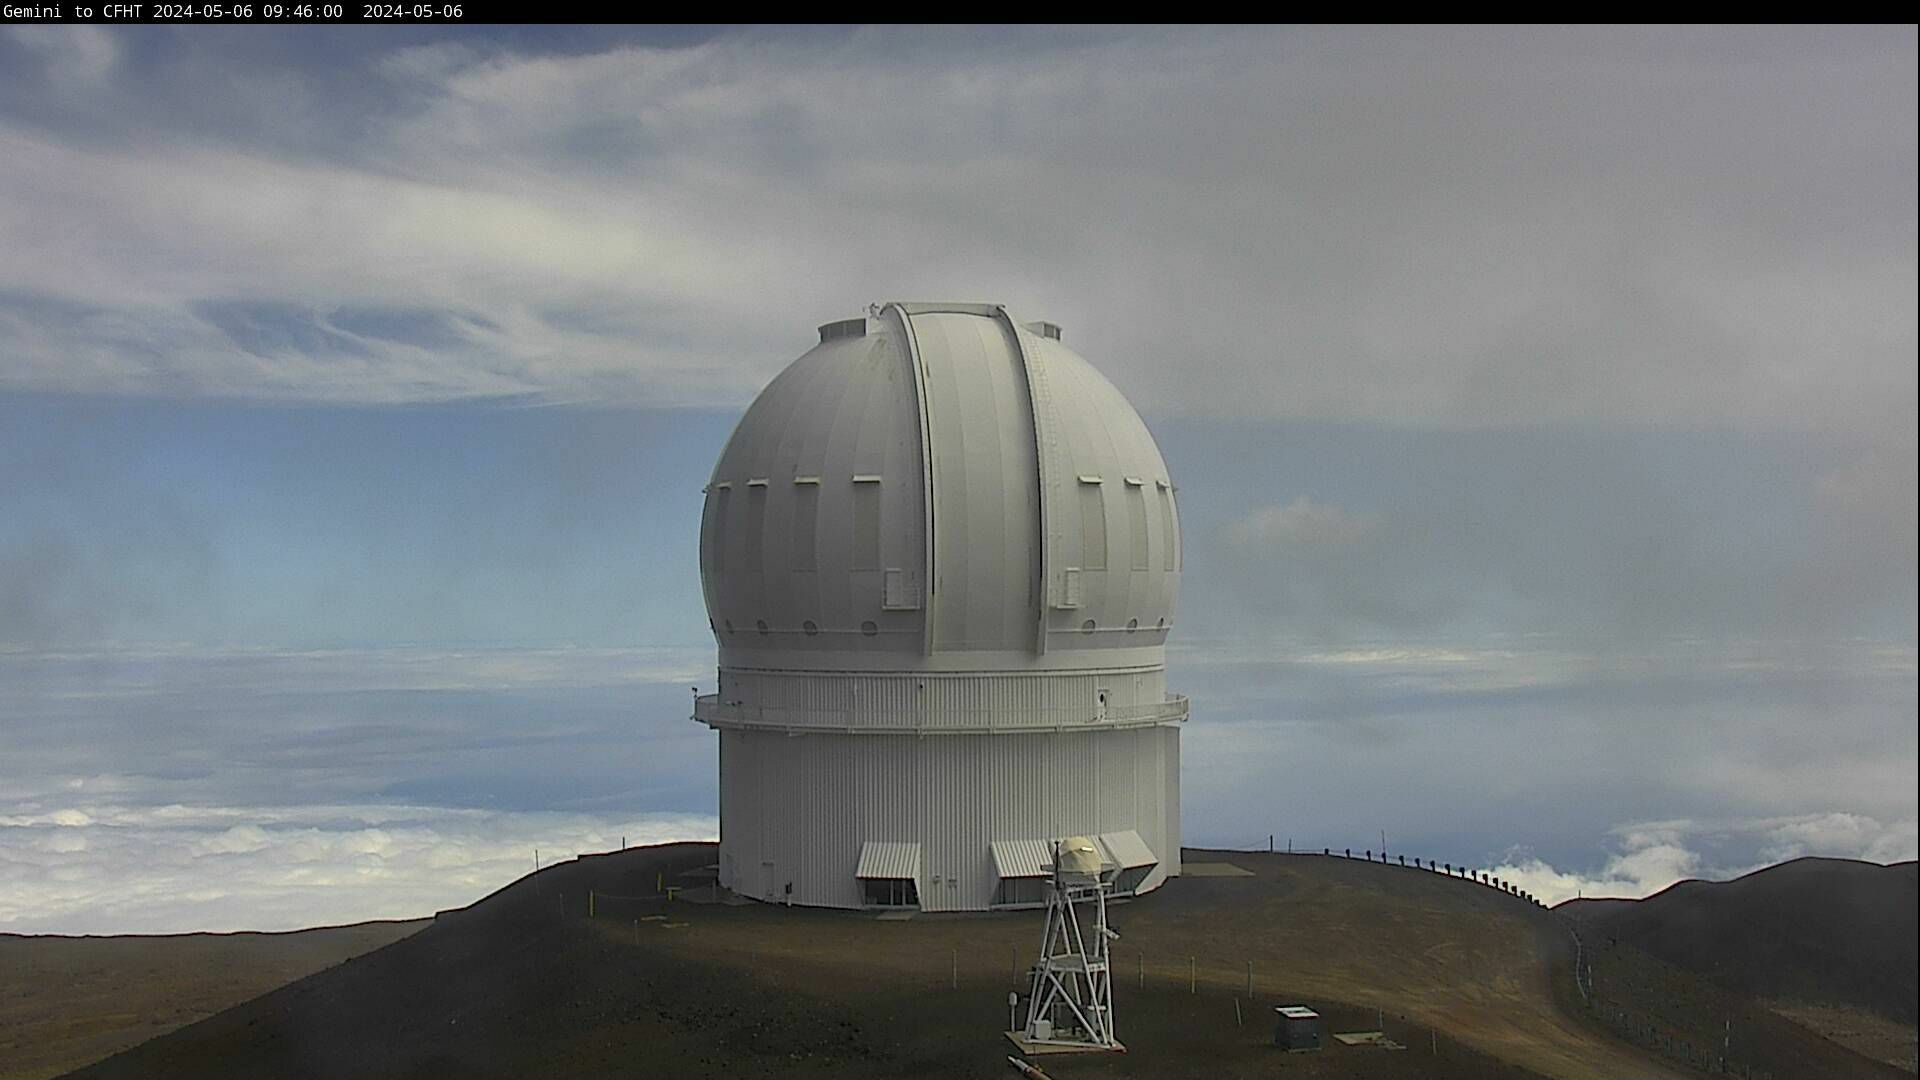
Hawaii’s Mountains – Here’s a link to the live web cam on the summit of near 13,800 foot Mauna Kea on the Big Island of Hawaii. This web cam is available during the daylight hours here in the islands…and when there’s a big moon shining down during the night at times. Plus, during the nights you will be able to see stars, and the sunrise and sunset too… depending upon weather conditions.
Aloha Paragraphs

A weak cold front approaching from the northwest

Mostly clear to partly cloudy, with cloudy periods…cirrus south
and north – looping version of this satellite photo

Showers are falling over the nearby ocean…spreading
over the islands in just a few places
Here’s the looping radar image for the Hawaiian Islands
~~~ Hawaii Weather Narrative ~~~
Lighter and variable winds into Friday, then gradually strengthening north to northeast breezes…through the weekend into next week. Here’s the latest weather map, showing the Hawaiian Islands, and the rest of the North Pacific Ocean, along with a real-time wind profiler of the central Pacific. We find high pressure systems located to the northwest and northeast of the state. There’s also a cold front approaching from the northwest. The forecast has light and variable Friday…bringing sultry and hazy weather our way. We’ll see gradually returning north to northeasterly winds during the weekend into early next week. This unusual break in our trade winds will be brought about by an approaching cold front. This front goes against our climatological norm for this time of year, although satellite imagery continues to show it taking aim on our islands. Winds will come in from the north to northeast in the wake of the frontal passage…keeping our temperatures somewhat cooler than normal for several days.
We’re moving into a new weather situation, with clear mornings giving way to afternoon clouds around the mountains…showers locally. The models continue to insist that a late season cold front will push down into the state. It looks like it will arrive over Kauai Friday morning at some point, then Oahu later in the day, Maui County Friday evening, and then dissipate over the Big Island later Saturday. As the winds come in from the north to northeast, with the frontal passage, and in its wake, we’ll see most of the front’s showers being deposited along the north and northeast facing coasts and slopes. These areas will pick up some passing showers through the weekend, and on into the early part of the new week. I’ll be back with more updates on all of the above, I hope you have a great Thursday night wherever you’re spending it! Aloha for now…Glenn.
Here on Maui...early Thursday morning before sunrise, skies are completely cloud free! The air temperature here in Kula at 535am was 48 degrees, 67 at the Kahului AP, 64 degree reading out in Hana, and 45 degrees at the Haleakala Crater. / Now in the late morning hour, I’m beginning to see some light volcanic haze beginning to arrive. Clouds forming over the mountains are much slower in forming today, than they did yesterday.
~~~ It’s now late afternoon, and despite the modest increase in clouds, it has remained mostly dry…certainly here in the upcountry area. This certainly was a contrast to a rather wet day up here yesterday. A rather mellow day, with the lighter winds now blowing, and like this morning, I expect another cooler than normal start for the day on Friday. There may be enough streaks of high cirrus above, that we may see a little color at sunset this evening.
~~~ We’re into the early part of the evening now, under partly cloudy skies, along with light volcanic haze too. I expect these clouds to evaporate fairly soon after sunset, with returning clear to partly cloudy skies overnight. If these clouds do go away, we’ll be able to see that sliver of a moon again tonight, with that large planet fairly close by. The air temperature here in Kula at 555pm was 68.9 degrees, with 81 degrees still showing down at the airport in Kahului. Meanwhile, out in Hana it was 77…and 57 up at the Haleakala Crater at the same time.
World-wide tropical cyclone activity:
>>> Atlantic Ocean: The last regularly scheduled Tropical Weather Outlook of the 2014 Atlantic hurricane season…has occurred. Routine issuance of the Tropical Weather Outlook will resume on June 1, 2015. During the off-season, Special Tropical Weather Outlooks will be issued as conditions warrant.
Here’s a satellite image of the Atlantic Ocean
>>> Caribbean Sea: The last regularly scheduled Tropical Weather Outlook of the 2014 Atlantic hurricane season…has occurred. Routine issuance of the Tropical Weather Outlook will resume on June 1, 2015. During the off-season, Special Tropical Weather Outlooks will be issued as conditions warrant.
>>> Gulf of Mexico: The last regularly scheduled Tropical Weather Outlook of the 2014 Atlantic hurricane season…has occurred. Routine issuance of the Tropical Weather Outlook will resume on June 1, 2015. During the off-season, Special Tropical Weather Outlooks will be issued as conditions warrant.
Here’s a satellite image of the Caribbean Sea…and the Gulf of Mexico.
>>> Eastern Pacific: There are no active tropical cyclones
TROPICAL WEATHER OUTLOOK
NWS NATIONAL HURRICANE CENTER MIAMI FL
For the eastern North Pacific…east of 140 degrees west longitude:
1. A large area of cloudiness and disorganized thunderstorms
associated with a tropical wave is located about 1350 miles
southwest of the southern tip of Baja California.  Environmental
conditions are becoming more conducive for development of
this system during the next several days while it moves west-
northwestward.
* Formation chance through 48 hours...low...near 30 percent
* Formation chance through 5 days...medium...60 percent
2. Shower activity associated with a broad area of low pressure
located about 2000 miles southwest of the southern tip of Baja
California has become more concentrated this morning. Some
development of this system is possible during the next couple of
days while the low moves slowly northwestward.  After that time,
development is less likely due to the proximity of the disturbance
to its northeast.
* Formation chance through 48 hours...low...near 20 percent * Formation chance through 5 days...medium...50 percent
This NHC image shows these two disturbances described above
Here’s a wide satellite image that covers the entire area between Mexico, out through the central Pacific…to the International Dateline.
Here’s the link to the National Hurricane Center (NHC)
>>> Central Pacific: The central north Pacific hurricane season has officially ended. Routine issuance of the tropical weather outlook will resume on June 1, 2015. During the off-season, special tropical weather outlooks will be issued as conditions warrant.
Here’s a link to the Central Pacific Hurricane Center (CPHC)
>>> Northwest Pacific Ocean:There are no active tropical cyclones
>>> South Pacific Ocean: There are no active tropical cyclones
>>> North and South Indian Oceans: There are no active tropical cyclones
Here’s a link to the Joint Typhoon Warning Center (JTWC)
Interesting: US Exposure to Extreme Heat is on the Rise – U.S. residents’ exposure to extreme heat could increase four- to six-fold by mid-century, due to both a warming climate and a population that’s growing especially fast in the hottest regions of the country, according to new research.
The study, by researchers at the National Center for Atmospheric Research (NCAR) and the City University of New York (CUNY), highlights the importance of considering societal changes when trying to determine future climate impacts.
“Both population change and climate change matter,” said NCAR scientist Brian O’Neill, one of the study’s co-authors. “If you want to know how heat waves will affect health in the future, you have to consider both.”
Extreme heat kills more people in the United States than any other weather-related event, and scientists generally expect the number of deadly heat waves to increase as the climate warms. The new study, published May 18 in the journal Nature Climate Change, finds that the overall exposure of to these future heat waves would be vastly underestimated if the role of population changes were ignored.
The total number of people exposed to extreme heat is expected to increase the most in cities across the country’s southern reaches, including Atlanta, Charlotte, Dallas, Houston, Oklahoma City, Phoenix, Tampa, and San Antonio.
The research was funded by the National Science Foundation, which is NCAR’s sponsor, and the U.S. Department of Energy.
CLIMATE, POPULATION, AND HOW THEY INTERACT
For the study, the research team used 11 different high-resolution simulations of future temperatures across the United States between 2041 and 2070, assuming no major reductions in greenhouse gas emissions. The simulations were produced with a suite of global and regional climate models as part of the North American Regional Climate Change Assessment Program.
Using a newly developed demographic model, the scientists also studied how the U.S. population is expected to grow and shift regionally during the same time period, assuming current migration trends within the country continue.
Total exposure to extreme heat was calculated in “person-days” by multiplying the number of days when the temperature is expected to hit at least 95 degrees by the number of people who are projected to live in the areas where extreme heat is occurring.
The results are that the average annual exposure to extreme heat in the United States during the study period is expected to be between 10 and 14 billion person-days, compared to an annual average of 2.3 billion person-days between 1971 and 2000.
Of that increase, roughly a third is due solely to the warming climate (the increase in exposure to extreme heat that would be expected even if the population remained unchanged). Another third is due solely to population change (the increase in exposure that would be expected if climate remained unchanged but the population continued to grow and people continued to moved to warmer places). The final third is due to the interaction between the two (the increase in exposure expected because the population is growing fastest in places that are also getting hotter).
“We asked, ‘Where are the people moving? Where are the climate hot spots? How do those two things interact?'” said NCAR scientist Linda Mearns, also a study co-author. “When we looked at the country as a whole, we found that each factor had relatively equal effect.”
At a regional scale, the picture is different. In some areas of the country, climate change packs a bigger punch than population growth and vice versa.
For example, in the U.S. Mountain region—defined by the Census Bureau as the area stretching from Montana and Idaho south to Arizona and New Mexico—the impact of a growing population significantly outstrips the impact of a warming climate. But the opposite is true in the South Atlantic region, which encompasses the area from West Virginia and Maryland south through Florida.
Exposure vs. vulnerability
Regardless of the relative role that population or climate plays, some increase in total exposure to extreme heat is expected in every region of the continental United States. Even so, the study authors caution that exposure is not necessarily the same thing as vulnerability.
“Our study does not say how vulnerable or not people might be in the future,” O’Neill said. “We show that heat exposure will go up, but we don’t know how many of the people exposed will or won’t have air conditioners or easy access to public health centers, for example.”
The authors also hope the study will inspire other researchers to more frequently incorporate social factors, such as population change, into studies of climate change impacts.
“There has been so much written regarding the potential impacts of climate change, particularly as they relate to physical climate extremes,” said Bryan Jones, a postdoctoral researcher at the CUNY Institute for Demographic Research and lead author of the study. “However, it is how people experience these extremes that will ultimately shape the broader public perception of climate change.”