


Air Temperatures – The following maximum temperatures (F) were recorded across the state of Hawaii Thursday…along with the minimum temperatures Thursday:
77 – 66 Lihue, Kauai
76 – 71 Honolulu, Oahu
72 – 64 Molokai AP
79 – 69 Kahului, Maui
79 – 71 Kailua Kona
78 – 68 Hilo, Hawaii
Here are the latest 24-hour precipitation totals (inches) for each of the islands, as of Thursday evening:
4.43 Kilohana, Kauai
3.94 Tunnel RG, Oahu
3.95 Puu Alii, Molokai
0.06 Lanai
0.10 Kahoolawe
1.86 Puu Kukui, Maui
0.59 Keaumo, Big Island
The following numbers represent the strongest wind gusts (mph)…as of Thursday evening:
36 Barking Sands, Kauai – N
31 Waianae Valley -NNE
27 Molokai – NW
37 Lanai – NE
32 Kahoolawe – NW
27 Kapalau, Maui – NNE
31 Kealakomo, Big Island – N
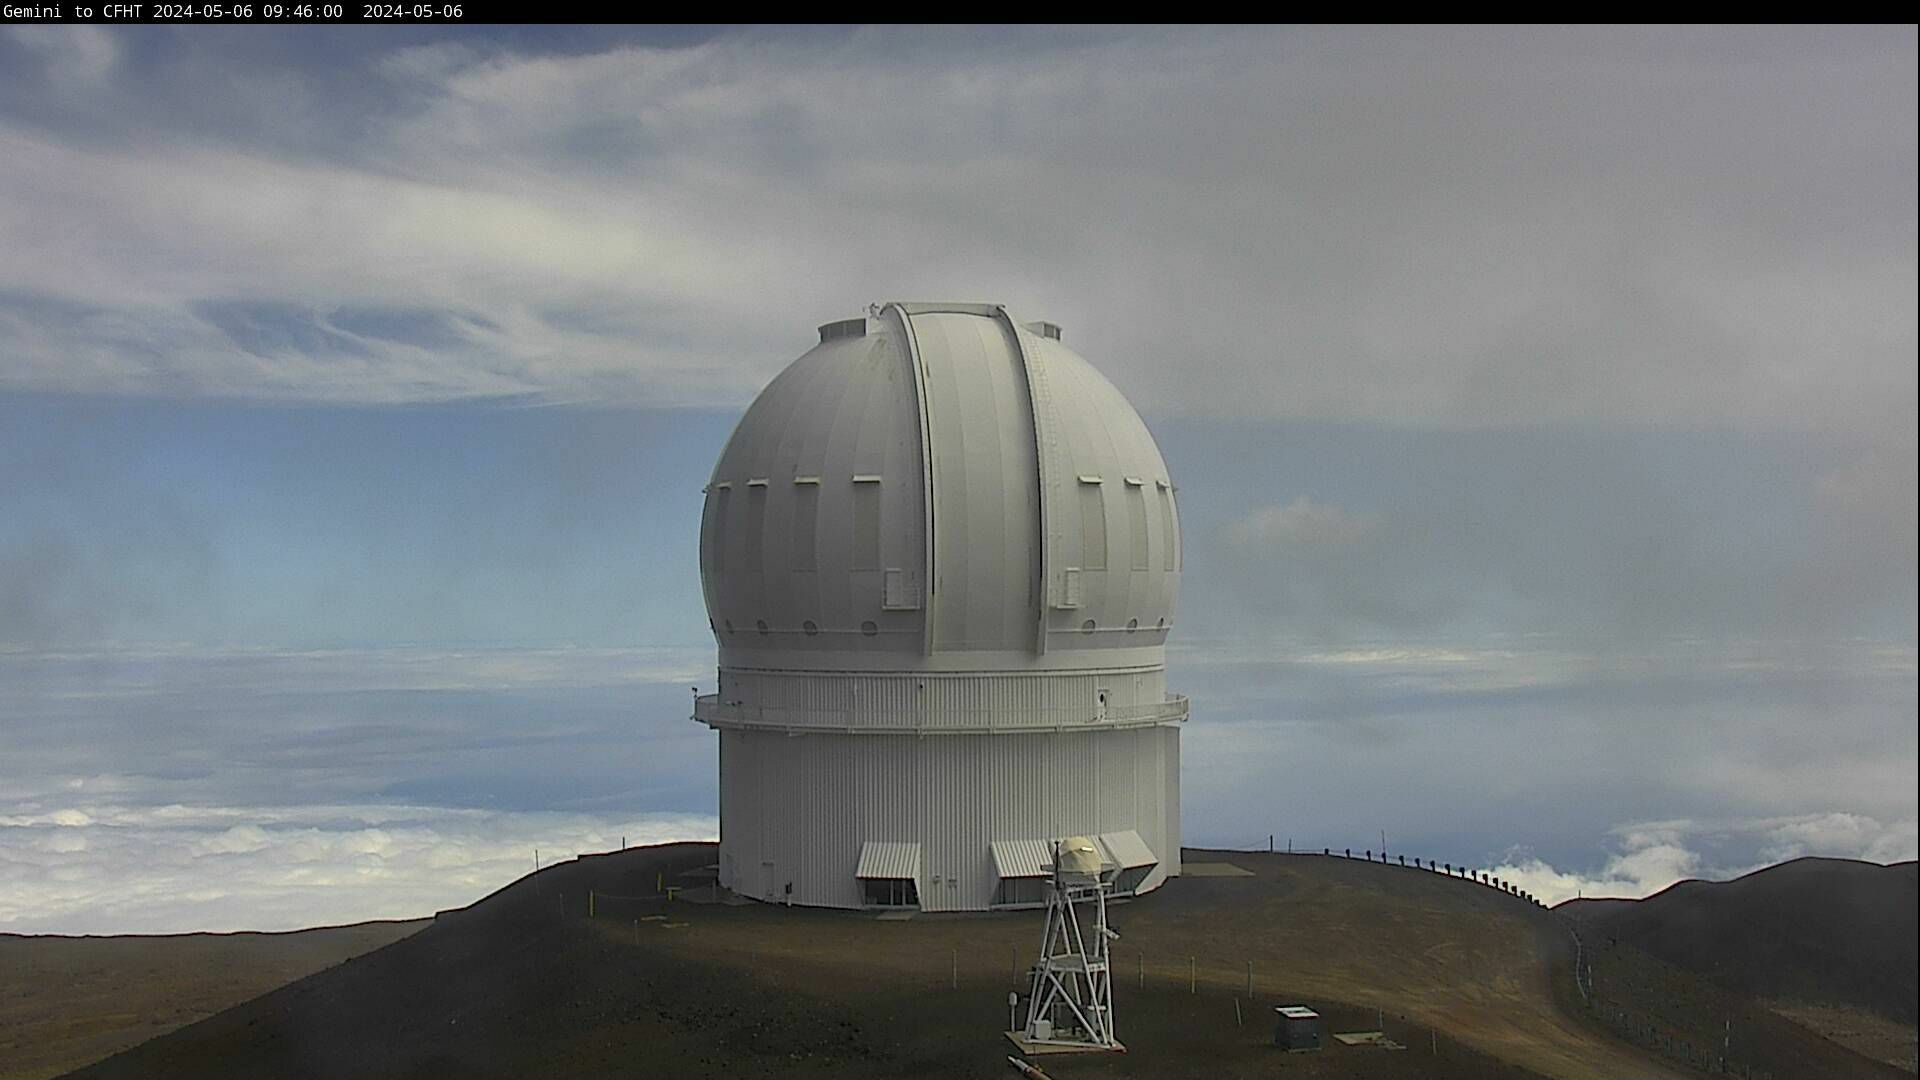
Hawaii’s Mountains – Here’s a link to the live web cam on the summit of near 13,800 foot Mauna Kea on the Big Island of Hawaii. This web cam is available during the daylight hours here in the islands…and when there’s a big moon shining down during the night at times. Plus, during the nights you will be able to see stars, and the sunrise and sunset too… depending upon weather conditions.
Aloha Paragraphs

Clearing high and middle level clouds…still lots
of lower level clouds in many areas of the state
Thick high clouds continue moving east…with low clouds
being carried onto the windward sides, thanks to the cool
north to northeast winds

Fewer showers are falling, mostly along the windward coasts and
slopes…although being carried over into the leeward sides locally
Here’s the looping radar image for the Hawaiian Islands.
~~~ Hawaii Weather Narrative ~~~
>The Mauna Kea Summit…on the Big Island of Hawaii<
Small Craft Advisory…strong north to northeast
winds across windiest coasts and channel waters
Flood Advisory…West Maui Mountains and the
northern sections of Maui – until 7am
Wind Advisory…Big Island summits
Celebrating the March Full Moon
Cool north to northeasterly winds prevail…gusty at times locally. Here’s the latest weather map, showing the Hawaiian Islands, and the rest of the North Pacific Ocean, along with a real-time wind profiler of the central Pacific. We find high pressure systems far to the northwest and northeast of the islands. At the same time, we have a surface low pressure system to the northeast of the islands, which is moving away towards the northeast. This gale low has a trailing trough of low pressure near the Big Island. These cool north to northeast breezes will prevail through the rest of this week, rather blustery at times locally. The extended outlook calls for more chilly northerly breezes, although become lighter Sunday into early next week.
Generally fewer showers for the time being…most of those will fall along the windward sides. The atmosphere is becoming less shower prone, at least along our leeward sides, which will remain the case over the next several days. The cooler than normal winds will bring showers to our windward sides…although certainly less intense than what we’ve experienced lately. There are some weather models that are pointing towards another possible increase in showers later this Sunday into Monday, and then again next Wednesday into Thursday…stay tuned. I’ll be back with more updates on all of the above, I hope you have a great Thursday wherever you’re spending it! Aloha for now…Glenn.
Here on Maui: The skies are still cloudy here on Maui before sunrise…with generally light rain falling locally. The winds are less strong early this morning, with a low temperature of 56.8 degrees here at my weather tower in Kula. It was 67 degrees down at the Kahului airport near the ocean, with 63 degrees at the Hana airport, and 37 degrees atop the Haleakala Crater at the same time. The warmest low temperature around the state was 70 degrees at both Honolulu and Kaneohe…both on the island of Oahu. / Looking down into the central valley at around 11am, it’s cloudy and looks like light showers are being carried along in the cool northerly breezes.
~~~ It’s now 130pm in the early afternoon, under partly to mostly cloudy skies. The winds are locally gusty, coming out of the cool northerly direction. It’s been wet along the windward sides, with drizzle and mist spraying over into the leeward sides here and here. Upcountry Kula, where I live, is windy, lightly showering, and a cool 62 degrees.
~~~ We’ve pushed into the early evening hours now, under partly to mostly cloudy skies. There’s lots of lower level clouds banked up against the windward sides, with partly cloudy skies over the leeward sides. Those windward biased clouds are dropping some showers, while the leeward sides are seeing some high cirrus flying by above. The air flow into our area is coming from the north, and if we follow the isobars northward…we see the source of these winds up in the Gulf of Alaska, and even the Bering Sea. This air has modified lots between up there, and down here in the tropics, although it still has a late winter chill to it. It appears that our weather will remain cooler than normal through the rest of this week, right on into early next week, which is interesting. BTW, it should be a nice colorful sunset this evening.
World-wide tropical cyclone activity:
>>> Atlantic Ocean: The last regularly scheduled Tropical Weather Outlook of the 2014 Atlantic hurricane season…has occurred. Routine issuance of the Tropical Weather Outlook will resume on June 1, 2015. During the off-season, Special Tropical Weather Outlooks will be issued as conditions warrant.
Here’s a satellite image of the Atlantic Ocean
>>> Caribbean Sea: The last regularly scheduled Tropical Weather Outlook of the 2014 Atlantic hurricane season…has occurred. Routine issuance of the Tropical Weather Outlook will resume on June 1, 2015. During the off-season, Special Tropical Weather Outlooks will be issued as conditions warrant.
>>> Gulf of Mexico: The last regularly scheduled Tropical Weather Outlook of the 2014 Atlantic hurricane season…has occurred. Routine issuance of the Tropical Weather Outlook will resume on June 1, 2015. During the off-season, Special Tropical Weather Outlooks will be issued as conditions warrant.
Here’s a satellite image of the Caribbean Sea…and the Gulf of Mexico.
>>> Eastern Pacific: The last regularly scheduled Tropical Weather Outlook of the 2014 North Pacific hurricane season…has occurred. Routine issuance of the Tropical Weather Outlook will resume on May 15, 2015. During the off-season, Special Tropical Weather Outlooks will be issued as conditions warrant.
Here’s a wide satellite image that covers the entire area between Mexico, out through the central Pacific…to the International Dateline.
Here’s the link to the National Hurricane Center (NHC)
>>> Central Pacific: The central north Pacific hurricane season has officially ended. Routine issuance of the tropical weather outlook will resume on June 1, 2015. During the off-season, special tropical weather outlooks will be issued as conditions warrant.
Here’s a link to the Central Pacific Hurricane Center (CPHC)
>>> Northwest Pacific Ocean: There are no active tropical cyclones
>>> South Pacific Ocean: There are no active tropical cyclones
>>> North and South Indian Oceans: Tropical cyclone 15S is now active in the Mozambique Channel, here’s the graphical track map…along with a satellite image.
Here’s a link to the Joint Typhoon Warning Center (JTWC)
Interesting: Combined Arctic ice observations show decades of loss – It’s no surprise that Arctic sea ice is thinning. What is new is just how long, how steadily, and how much it has declined. University of Washington researchers compiled modern and historic measurements to get a full picture of how Arctic sea ice thickness has changed.
The results, published this month in The Cryosphere, show a thinning in the central Arctic Ocean of 65 percent between 1975 and 2012. September ice thickness, when the ice cover is at a minimum, is 85 percent thinner for the same 37-year stretch.
“The ice is thinning dramatically,” said lead author Ron Lindsay, a climatologist at the UW Applied Physics Laboratory. “We knew the ice was thinning, but we now have additional confirmation on how fast, and we can see that it’s not slowing down.”
The study helps gauge how much the climate has changed in recent decades, and helps better predict an Arctic Ocean that may soon be ice-free for parts of the year.
The project is the first to combine all the available observations of Arctic sea ice thickness. The earlier period from 1975 to 1990 relies mostly on under-ice submarines. Those records are less common since 2000, but have been replaced by a host of airborne and satellite measurements, as well as other methods for gathering data directly on or under the ice.
“A number of researchers were lamenting the fact that there were many thickness observations of sea ice, but they were scattered in different databases and were in many different formats,” Lindsay said. The U.S. National Oceanic and Atmospheric Administration funded the effort to compile the various records and match them up for comparison.
The data also includes the NASA IceSat satellite that operated from 2003 to 2008, IceBridge aircraft-based measurements that NASA is conducting until its next satellite launches, long-term under-ice moored observations in the Beaufort Sea from the Woods Hole Oceanographic Institution, and other measures from aircraft and instruments anchored to the seafloor.
The older submarine records were unearthed for science by former UW professor Drew Rothrock, who used the U.S. Navy submarine measures of ice thickness to first establish the thinning of the ice pack through the 1990s. Vessels carried upward-looking sonar to measure the ice draft so they knew where they could safely surface. Further analysis of those records found a 36 percent reduction in the average thickness in the quarter century between 1975 and 2000.
Maggie Says:
Aloha from soggy Haiku. There are some press reports today tha a weak El Niño is forming. While they discuss the likely impact on mainland weather (not much this year), they are silent on the impact here in Hawaii. Any thoughts? ~~~ Hi Maggie, yes I saw that bit of news about a weak El Nino having become established here in the Pacific. It’s late in the winter to see much influence in terms of our rainy season. As for how it will influence our summer hurricane season, it may make for a slightly more active season this year. Otherwise, I don’t think it will play a large part in our local weather conditions. Good question, Aloha, Glenn