November 2009
Monthly Archive
Posted by Glenn
[2] Comments
November 20-21, 2009
Air Temperatures – The following maximum temperatures were recorded across the state of Hawaii Friday afternoon:
Lihue, Kauai – 80
Honolulu, Oahu – 85
Kaneohe, Oahu – 81
Kaunakakai, Molokai – 82
Kahului, Maui – 83
Hilo, Hawaii – 77
Kailua-kona – 85
Air Temperatures ranged between these warmest and coolest spots near sea level around the state – and on the highest mountains…at 5pm Friday evening:
Barking Sands, Kauai – 83F
Hilo, Hawaii – 75
Haleakala Crater – 52 (near 10,000 feet on Maui)
Mauna Kea summit – 34 (near 14,000 feet on the Big Island)
Precipitation Totals – The following numbers represent the largest precipitation totals (inches) during the last 24 hours on each of the major islands, as of Friday afternoon:
0.45 Mount Waialaele, Kauai
0.02 Wilson Tunnel, Oahu
0.00 Molokai
0.00 Lanai
0.00 Kahoolawe
0.57 Puu Kukui, Maui
1.03 Mountain View, Big Island
Marine Winds – Here’s the latest (automatically updated) weather map showing a 1027 millibar high pressure system to the north-northeast of the islands. Winds will be locally strong and gusty from the trade wind direction through Sunday…lighter in those less exposed areas.
Satellite and Radar Images: To view the cloud conditions we have here in Hawaii, please use the following satellite links, starting off with this Infrared Satellite Image of the islands to see all the clouds around the state during the day and night. This next image is one that gives close images of the islands only during the daytime hours, and is referred to as a Close-up visible image. This next image shows a larger view of the Pacific…giving perspective to the wider ranging cloud patterns in the Pacific Ocean. Finally, here’s a Looping IR satellite image, making viewable the clouds around the islands 24 hours a day. To help you keep track of where any showers may be around the islands, here’s the latest animated radar image.
Hawaii’s Mountains – Here’s a link to the live webcam on the summit of near 14,000 foot Mauna Kea on the Big Island of Hawaii. The tallest peak on the island of Maui is the Haleakala Crater, which is near 10,000 feet in elevation. These two webcams are available during the daylight hours here in the islands…and when there’s a big moon rising just after sunset for an hour or two! Plus, during the nights and early mornings you will be able to see stars, and the sunrise too…depending upon weather conditions.
Tropical Cyclone activity in the eastern and central Pacific – Here’s the latest weather information coming out of the National Hurricane Center, covering the eastern north Pacific. You can find the latest tropical cyclone information for the central north Pacific (where Hawaii is located) by clicking on this link to the Central Pacific Hurricane Center. Here’s a tracking map covering both the eastern and central Pacific Ocean. A satellite image, which shows the entire ocean area between Hawaii and the Mexican coast…can be found here.
Aloha Paragraphs

Close up of Hawaii’s state bird…the Nene
The breezy trade winds will continue through the weekend, well into the new work week ahead. The small craft wind advisories remain in place over the major channels, Maalaea Bay on Maui, and in some coastal zones on the Big Island Friday night. Looking ahead, there is no definite end in sight for the trade wind flow. There will be minor fluctuations in strength, but they are forecast to remain active through most of the new week ahead. Wind speeds in general will continue in the moderately strong, although those windier areas will find stronger and gusty conditions.
Generally fair weather conditions will prevail, with just the usual few windward showers falling…mostly during the nights and early mornings. As this IR satellite image shows, the bulk of whatever showers that are being carried our way on the trade winds, are heading towards the Big Island. This larger satellite picture shows some high cirrus clouds approaching from the west…as well as to the south and southeast.The overlying atmosphere remains fairly dry and stable now. Looking ahead, there aren’t any cold fronts that are slated to push down into our area. There aren’t any upper level troughs of low pressure heading our way either. This leaves us with just those occasional passing showers along our windward sides…with favorably inclined weather for our leeward beaches.
It’s early Friday evening here in Kihei, Maui, as I begin writing this last section of today’s narrative. Friday was another nice day here in the islands, with lots of clear blue skies most areas. Showers were few and far between, with the leeward areas warm and sunny for the most part. I anticipate that this weekend will continue this pattern, although we may begin to see some sun dimming high cirrus clouds filter overhead at times over the next several days. ~~~ I’m going to see a new film this evening, called Bright Star (2009). Bright Star is a drama/romance film that is based on the last three years of the life of poet John Keats. It stars Ben Whishaw as Keats, and Abbie Cornish as his muse Fanny Brawne. Here’s a trailer of this good looking film. ~~~ Then, as I’ve been mentioning the last couple of days, I’m going dancing in Paia with some friends from here at the Pacific Disaster Center. It will be a late night for sure, so don’t expect my next narrative update at the crack of dawn as usual. It may be a little later in the morning, but who knows ahead of time anyway. I hope you have a great Friday night, and a good Saturday morning until we meet again soon! Aloha for now…Glenn.
Interesting: The diversity of life on Earth is undergoing an "immense and hidden" tragedy that requires the scale of global response now being deployed to tackle climate change, according to one of the world’s most eminent biologists. Prof Edward Wilson, an ecologist who has been described as "Darwin’s natural heir" and hailed by novelist Ian McEwan as an "intellectual hero" and "inspirational" writer, told the Guardian that the threat was so grave he is pushing for the creation of an international body of experts modeled on the UN’s Intergovernmental Panel on Climate Change (IPCC).
The IPCC, which is credited with convincing world leaders that the threat from climate change is real, includes about 2,500 scientific expert reviewers from more than 130 countries and was awarded the Nobel peace prize in 2007 along with Al Gore. Wilson’s proposed organization – which he names the Barometer of Life – would report to governments on the threats posed to species around the world.
Wilson said the problem of biodiversity loss had been "eased off centre stage" because of the focus on climate change. "We don’t hear as much public concern, protestation and plans by political leaders to save the living environment. It doesn’t get anything like the attention the physical environment has," he said.
Since the beginning of the last century, 183 species are known to have become extinct, including the Tasmanian tiger, the Caribbean monk seal and the toolache wallaby. But this number is a gross underestimate of the true number of extinctions, according to the International Union for Conservation of Nature species program.
Wilson was speaking ahead of the 150th anniversary of the publication of the Origin of Species on Tuesday. The 80-year-old scientist will deliver a lecture via video link to an audience at London’s Royal Institution on Darwin’s legacy and "the future of biology".
Interesting2: Roughly 15,000 years ago, at the end of the last ice age, North America’s vast assemblage of large animals — including such iconic creatures as mammoths, mastodons, camels, horses, ground sloths and giant beavers — began their precipitous slide to extinction. And when their populations crashed, emptying a land whose diversity of large animals equaled or surpassed Africa’s wildlife-rich Serengeti plains then or now, an entirely novel ecosystem emerged as broadleaved trees once kept in check by huge numbers of big herbivores claimed the landscape.
Soon after, the accumulation of woody debris sparked a dramatic increase in the prevalence of wildfire, another key shaper of landscapes. This new picture of the ecological upheaval of the North American landscape just after the retreat of the ice sheets is detailed in a study published November 19 in the journal Science.
The study, led by researchers from the University of Wisconsin-Madison, uses fossil pollen, charcoal and dung fungus spores to paint a picture of a post-ice age terrain different from anything in the world today.
The work is important because it is "the clearest evidence to date that the extinction of a broad guild of animals had effects on other parts of these ancient ecosystems," says John W. Williams, a UW-Madison professor of geography and an expert on ancient climates and ecosystems who is the study’s senior author.
What’s more, he says, the detailing of changes on the ice age landscape following the crash of keystone animal populations can provide critical insight into the broader effects of animals disappearing from modern landscapes.
Interesting3: A nutritionist in Nigeria says that malnutrition and iron deficiency in schoolchildren could be reduced in her country by baking up snail pie. In a research paper to be published in the International Journal of Food Safety, Nutrition and Public Health, she explains snail is not only cheaper and more readily available than beef but contains more protein.
Ukpong Udofia of the Department of Home Economics, at the University of Uyo, has looked at the moisture levels, protein content, and iron composition of the flesh of the giant West African land snail and compared it to beef steak.
Snail pie is much more nutritious than a beef pie, she says. Udofia and her research team baked pies of both varieties and asked young mothers and their children to try the tasty meal.
Most of them preferred the taste and texture of the pies baked with the snail Archachatina marginata to those made with beef. The kids and their mothers judged the snail pies to have a better appearance, texture, and flavor.
"Snail pie is recommended as a cheap source of protein and iron for school-age children and young mothers and could contribute in the fight against iron deficiency anemia," Udofia says.
"The land snail is a readily available and affordable source of animal protein, inhabits a lot of the green forest and swamps of most developing countries including Nigeria," Udofia adds, "It is also increasingly cultivated, although in the West it is more familiar as an unusual pet than a pie.
Iron deficiency and a lack of protein in the diet affect young mothers and their children in many developing countries including Nigeria, according to the World Health Organization leading to serious health problems.
There is no quick fix for the problem of malnutrition in such countries, but alternative to high-cost meat products could help. Snail meat contains protein, fat (mainly polyunsaturated fatty acid), iron, calcium, magnesium, phosphorus, copper, zinc, vitamins A, B6, B12, K and folate.
It also contains the amino acids arginine and lysine at higher levels than in whole egg. It also contains healthy essential fatty acids such as linoleic and linolenic acids. The high-protein, low-fat content of snail meat makes it a healthy alternative food.
Interesting4: Sustainable farming, initially adopted to preserve soil quality for future generations, may also play a role in maintaining a healthy climate, according to researchers at the Department of Energy’s Oak Ridge and Los Alamos national laboratories. ORNL and LANL scientists are exploring the large potential of the earth’s soils to sequester carbon, with estimates claiming that new land-use practices could greatly reduce U.S. carbon emissions by as much as 25 percent.
But exactly which practices are the most effective is still unclear, and a research paper published in the Soil Science Society of America Journal shines some light on this topic by introducing an easy-to-use field-portable approach to measure the carbon content of soils.
"This is a tool one could use to measure changes in soil carbon over time and try to establish whether soil carbon stocks are increasing or decreasing as a result of land-use practices," said lead author Madhavi Martin of ORNL’s Environmental Sciences Division.
"Although it is possible to measure these properties in the laboratory, the simplicity and portability of the device allow researchers exponentially greater flexibility to conduct their investigations." The paper describes the adaptation of Laser Induced Breakdown Spectroscopy, or LIBS, a technique that once made Martin something of a celebrity when she used it confirm the common origin of two separate pieces of firewood — evidence that eventually led to a confession in a 2006 Texas murder case.
LIBS works by measuring the light emitted when a small portion of the sample is annihilated with a laser pulse, a flash that provides an elemental fingerprint of virtually any substance under examination. The challenge for the authors was configuring the experimental design to ensure accurate measurements of carbon regardless of soil characteristics.
To accomplish this, the authors acquired a varied set of soil samples with different sand, silt and clay compositions from the Natural Resources Conservation Service and tested them against numerous laser wavelength and energies.
Posted by Glenn
No Comments
November 19-20, 2009
Air Temperatures – The following maximum temperatures were recorded across the state of Hawaii Thursday afternoon:
Lihue, Kauai – 80
Honolulu, Oahu – 84
Kaneohe, Oahu – 76
Kaunakakai, Molokai – 82
Kahului, Maui – 82
Hilo, Hawaii – 81
Kailua-kona – 84
Air Temperatures ranged between these warmest and coolest spots near sea level around the state – and on the highest mountains…at 5pm Thursday evening:
Honolulu, Oahu – 83F
Hilo, Hawaii – 76
Haleakala Crater – 46 (near 10,000 feet on Maui)
Mauna Kea summit – 32 (near 14,000 feet on the Big Island)
Precipitation Totals – The following numbers represent the largest precipitation totals (inches) during the last 24 hours on each of the major islands, as of Thursday afternoon:
0.29 Mount Waialaele, Kauai
2.11 Maunawili, Oahu
0.11 Molokai
0.00 Lanai
0.00 Kahoolawe
1.49 Puu Kukui, Maui
1.05 Mountain View, Big Island
Marine Winds – Here’s the latest (automatically updated) weather map showing a 1027 millibar high pressure system to the north-northwest of the islands…with a weaker 1023 millibar cell far to the east-northeast. Winds will be locally strong and gusty from the trade wind direction through Saturday…lighter in those less exposed areas.
Satellite and Radar Images: To view the cloud conditions we have here in Hawaii, please use the following satellite links, starting off with this Infrared Satellite Image of the islands to see all the clouds around the state during the day and night. This next image is one that gives close images of the islands only during the daytime hours, and is referred to as a Close-up visible image. This next image shows a larger view of the Pacific…giving perspective to the wider ranging cloud patterns in the Pacific Ocean. Finally, here’s a Looping IR satellite image, making viewable the clouds around the islands 24 hours a day. To help you keep track of where any showers may be around the islands, here’s the latest animated radar image.
Hawaii’s Mountains – Here’s a link to the live webcam on the summit of near 14,000 foot Mauna Kea on the Big Island of Hawaii. The tallest peak on the island of Maui is the Haleakala Crater, which is near 10,000 feet in elevation. These two webcams are available during the daylight hours here in the islands…and when there’s a big moon rising just after sunset for an hour or two! Plus, during the nights and early mornings you will be able to see stars, and the sunrise too…depending upon weather conditions.
Tropical Cyclone activity in the eastern and central Pacific – Here’s the latest weather information coming out of the National Hurricane Center, covering the eastern north Pacific. You can find the latest tropical cyclone information for the central north Pacific (where Hawaii is located) by clicking on this link to the Central Pacific Hurricane Center. Here’s a tracking map covering both the eastern and central Pacific Ocean. A satellite image, which shows the entire ocean area between Hawaii and the Mexican coast…can be found here.
Aloha Paragraphs

Eroded Koolau Mountains…Oahu
The trade winds will remain locally on the strong and gusty side for the time being, although falling back into the more moderate realms as we move into the weekend…through the first half of the new week ahead. The wind speeds have dropped enough Thursday evening, that small craft wind advisories have been pared back to just the major channels, and a few other places on Maui and the Big Island. Our winds will begin to mellow-out a little as we move into the weekend and beyond, although not very much as is now the case. These gusty winds have dropped enough upstream as well, so that the NWS forecast office in Honolulu has dropped the high surf advisory along our east facing shores.
Showers will continue to fall mainly along our windward coasts and slopes…although less now in general. This IR satellite image shows fewer than the usual cumulus and stratocumulus clouds being carried our way on the trade wind flow. This larger satellite view shows patches of incoming trade wind moisture stretching well east and ENE of the islands. There looks like there might be an area of high cirrus clouds approaching us from the west too. The overlying atmosphere is quite stable now, and drier too. There will continue to be a few off and on showers however, but considerably less than earlier in the week. The gusty trade winds may try to carry a few showers over into the leeward sides of the islands on the smaller islands. Looking further ahead, some of the computer models want to bring increased precipitation into our area around next Tuesday or Wednesday…we’ll have to wait and see what happens over the next several model runs.
It’s early Thursday evening here in Kihei, Maui, as I begin writing this last paragraph of today’s narrative. Thursday turned out to be quite a nice day, with hardly any showers falling for a change. The winds were still quite breezy, but not as much as the last 2-3 days. Taking a look at the top gust around the state at 5pm, we find as usual, Maalaea Bay on Maui sporting the strongest winds…with 37 mph. Skies are quite clear for a change, although there are some partly cloudy conditions in many areas. ~~~ I’m about ready to head upcountry again, taking the drive home to Kula now. I’m looking forward to getting back up there so I can take my evening walk, have dinner, and then beginning reading. Did I ever tell you that I don’t have a TV, haven’t had one for many years actually? At any rate, tomorrow is Friday already, and as I mentioned this morning, I’m going out dancing in Paia tomorrow night, with some friends from work…which should be great! ~~~ Ok then, or as we say here in the islands, kden, I’ll catch up with you again early Friday morning, when I’ll have your next new weather narrative from paradise ready for your reading. I hope you have nice Thursday night until then! Oh yeah, one more thing, have you noticed the slender crescent moon these evenings, before it sinks into the western horizon, it’s pretty awesome! Aloha for now…Glenn.
Interesting: Was there a Stone Age apocalypse or not? One narrative has it that about 13,000 years ago a comet blasted North America, wiping out the continent’s mega-fauna – as well as its early settlers. It’s a compelling story, offering a simple explanation to the mystery of why mammoths, mastodons, and Clovis humans vanished. But it’s a controversial theory, and new research suggests the impact was far too small to have done any serious damage. Doubts center on the speed of extinctions, the fate of the Clovis culture, and the presence of supposed impact signatures. But advocates of the comet-blast theory say they will present their own new data at the American Geophysical Union (AGU) meeting in San Francisco, where they will share the stage with skeptics.
"Nothing special happened at 12,900 years ago," says John Williams of the University of Wisconsin-Madison. His data, reported in Science this week, suggest that large mammals were already rare well before the purported impact. Williams and his colleagues searched layered lake-bottom deposits in Indiana and New York State for the spores of the fungus Sporormiella found in the dung of large plant-eating mammals such as mammoths and horses. From a decline in the spore counts, they conclude that the mega-fauna population dropped steadily between 14,800 and 13,700 years ago, making them rare 800 years before any comet strike. Williams says the data rule out a sudden, impact-driven extinction.
However, geologist and impact-advocate James Kennett at the University of California, Santa Barbara, calls that "a classic case of over-interpretation" because the data comes from only a small area and not from different sites across the whole of North America. Some anthropologists are also unhappy and with the sudden extinction theory, taking issue with claims that an impact wiped out the Clovis people.
It’s true that distinctive Clovis-style artifacts disappear and sites were abandoned at the start of a dramatic cooling event which began about 13,000 years ago called the Younger Dryas. But the people didn’t die, says Vance Holliday of the University of Arizona in Tucson. "An artifact style was replaced by another style. You see that all over the world." Moreover, early North Americans were highly mobile hunter-gatherers who occupied sites only briefly before moving on. What’s more, the geological layer representing the Younger Dryas is missing the sort of extraterrestrial material that was a hallmark of the impact that wiped out the dinosaurs.
Isotope geochemist Mukul Sharma of Dartmouth College in Hanover, New Hampshire, says he has been unable to find any significant amount of platinum-group elements with the distinctive isotopic signature showing that they came from space. Sharma will detail his findings at the AGU meeting. Yet something did crash into the Pacific Ocean around the period in question. In a separate AGU paper, Sharma will report finding traces of extraterrestrial osmium on the floor of the mid-Pacific dating from between 16,000 and 8000 years ago. Some Younger Dryas deposits do contain residues similar to those from the 1908 Tunguska explosion over Siberia, says Adrian Melott of the University of Kansas, Lawrence. He reckons the North American event was "something maybe a couple of orders of magnitude bigger than Tunguska" – but still perhaps only one-hundredth the scale of the proposed comet blast.
Interesting2: We love to sit. Be it on a couch, in a car, at a desk, in front of a screen or at the dinner table, the average adult spends over 90% of his waking hours with his butt firmly ensconced in a chair. This ubiquitous habit has not only taken over a good portion of our day, but it often goes uninterrupted for several hours. The other side of this ugly statistic is that only 1% to 5% of those waking hours is spent performing moderate to physical activity with only 0.5% to 1% of this activity being sustained for at least 10 minutes.
This society of sitters has prompted health experts to examine the consequences of going from the breakfast table, to the car, to a desk, back to the table and finally to the couch in front of the TV. What they found isn’t pretty. Each two-hour increase in daily time spent sitting is associated with a 5% to 23% increase in the risk of obesity and a 7% to 14% increase in the risk of type 2 diabetes. An enhanced probability of metabolic syndrome and ovarian cancer are also consequences of prolonged sitting.
According to a study published in the July 2008 edition of Current Cardiovascular Risk Results, the health consequences that develop from too much sitting are very different from those that result from too little exercise. In fact, the authors of the study have gone as far as labelling prolonged sitting as "a distinct health hazard." If that’s not scary enough, experts also suggest that future trends in communication, transportation and workplace technology could lead to even more time spent sitting.
For the most part, we seem relatively happy spending most of our day seated. That is until we have to let our belt out a notch or two or our bodies start to protest from all the inactivity. A study in the Journal of Occupational and Environmental Medicine showed that workers who spent 95% of their day sitting increased their risk of neck pain. How do you conquer the effects of prolonged sitting? Exercise helps, but it’s only a small part in the battle to reduce the amount of time spent in a chair.
Experts suggest that even regular exercisers can be chronic sitters. Look at the average day in the life of active Canadians and you can understand their point. They arrive to work at 9 a.m. and sit at their desk until noon, only to return after a 60-minute workout to spend another four hours back at their desk. Add the seated hours spent travelling to and from work and in front of a TV or computer screen and you can see how the time spent sitting dwarfs the time spent exercising.
To further solidify their point, researchers evaluated the health of men and women who reported exercising five days a week for 30 minutes, a standard that is generally considered active enough to benefit health and fitness. What they found was surprising. Waist size, blood pressure and cholesterol levels were all negatively affected by time spent sitting. Also worth noting is that the results were more pronounced in women than in men.
In fact, the results were so significant, the researchers labeled this unique subset of the population "active couch potatoes." So, if regular exercise doesn’t counteract the ill effects of sitting, what does? That’s easy. Get up and move. Often. To be clear, I’m not talking about just exercising at your desk or hitting the stairs for an impromptu workout. Simple activities like standing up to answer the phone, walking down the hall to fill a water bottle and walking to a colleague’s office instead of sending an email, have shown to increase daily activity and reduce weight gain.
Research indicates that people who take frequent breaks during long periods of sedentary activity will have a waist circumference that, on average, is 5.9 centimeters less than that of people who are less inclined to get out of their chair. More and more companies are in tune with the consequences of a sedentary work force and are hailing the benefits of moving more in the workplace.
There’s also a call by some health experts to set up new health guidelines that suggest how often our sitting habit needs to be interrupted. That doesn’t mean you need to wait for a set of guidelines before getting off your butt on a regular basis. Start kicking the sitting habit now. Budget five minutes of every hour to get out of your chair. Stand, stretch or go for a walk. And if your boss asks what you’re doing away from your desk, invite him to stand alongside you while you explain the consequences of being an active couch potato.
Interesting3: Indoor smoking bans have forced smokers at bars and restaurants onto outdoor patios, but a new University of Georgia study in collaboration with the Centers for Disease Control and Prevention suggests that these outdoor smoking areas might be creating a new health hazard. The study, thought to be the first to assess levels of a nicotine byproduct known as cotinine in nonsmokers exposed to second-hand smoke outdoors, found levels up to 162 percent greater than in the control group.
The results appear in the November issue of the Journal of Occupational and Environmental Hygiene. "Indoor smoking bans have helped to create more of these outdoor environments where people are exposed to secondhand smoke," said study co-author Luke Naeher, associate professor in the UGA College of Public Health.
"We know from our previous study that there are measurable airborne levels of secondhand smoke in these environments, and we know from this study that we can measure internal exposure. "Secondhand smoke contains several known carcinogens and the current thinking is that there is no safe level of exposure," he added. "So the levels that we are seeing are a potential public health issue."
Athens-Clarke County, Ga., enacted an indoor smoking ban in 2005, providing Naeher and his colleagues and ideal environment for their study. The team recruited 20 non-smoking adults and placed them in one of three environments: outside bars, outside restaurants and, for the control group, outside the UGA main library. Immediately before and after the six-hour study period, the volunteers gave a saliva sample that was tested for levels of cotinine, a byproduct of nicotine and a commonly used marker of tobacco exposure.
The team found an average increase in cotinine of 162 percent for the volunteers stationed at outdoor seating and standing areas at bars, a 102 percent increase for those outside of restaurants and a 16 percent increase for the control group near the library. Naeher acknowledges that an exposure of six-hours is greater than what an average patron would experience but said that employees can be exposed for even longer periods.
"Anyone who works in that environment — waitresses, waiters or bouncers — may be there for up to six hours or longer," Naeher said. "Across the country, a large number of people are occupationally exposed to second-hand smoke in this way." Studies that measured health outcomes following indoor smoking bans have credited the bans with lowering rates of heart attacks and respiratory illness, but Naeher said that the health impacts of outdoor second-hand smoke are still unknown.
Interesting4: Cigarettes are "widely contaminated" with bacteria, including some known to cause disease in people, concludes a new international study conducted by a University of Maryland environmental health researcher and microbial ecologists at the Ecole Centrale de Lyon in France. The research team describes the study as the first to show that "cigarettes themselves could be the direct source of exposure to a wide array of potentially pathogenic microbes among smokers and other people exposed to secondhand smoke."
Still, the researchers caution that the public health implications are unclear and urge further research. "We were quite surprised to identify such a wide variety of human bacterial pathogens in these products," says lead researcher Amy R. Sapkota, an assistant professor in the University of Maryland’s School of Public Health.
"The commercially-available cigarettes that we tested were chock full of bacteria, as we had hypothesized, but we didn’t think we’d find so many that are infectious in humans," explains Sapkota, who holds a joint appointment with the University’s Maryland Institute for Applied Environmental Health and the department of epidemiology and biostatistics.
"If these organisms can survive the smoking process — and we believe they can — then they could possibly go on to contribute to both infectious and chronic illnesses in both smokers and individuals who are exposed to environmental tobacco smoke," Sapkota adds. "So, it’s critical that we learn more about the bacterial content of cigarettes, which are used by more than a billion people worldwide." The study will appear in an upcoming edition of the journal Environmental Health Perspectives.
Posted by Glenn
No Comments
November 18-19, 2009
Air Temperatures – The following maximum temperatures were recorded across the state of Hawaii Wednesday afternoon:
Lihue, Kauai – 80
Honolulu, Oahu – 84
Kaneohe, Oahu – 81
Kaunakakai, Molokai – 81
Kahului, Maui – 81
Hilo, Hawaii – 79
Kailua-kona – 82
Air Temperatures ranged between these warmest and coolest spots near sea level around the state – and on the highest mountains…at 5pm Wednesday evening:
Barking Sands, Kauai – 85F
Hilo, Hawaii – 72
Haleakala Crater – missing (near 10,000 feet on Maui)
Mauna Kea summit – missing (near 14,000 feet on the Big Island)
Precipitation Totals – The following numbers represent the largest precipitation totals (inches) during the last 24 hours on each of the major islands, as of Wednesday afternoon:
0.94 Mount Waialaele, Kauai
0.32 Manoa Valley, Oahu
0.11 Molokai
0.00 Lanai
0.00 Kahoolawe
2.42 Puu Kukui, Maui
1.49 Glenwood, Big Island
Marine Winds – Here’s the latest (automatically updated) weather map showing a 1031 millibar high pressure system far to the north-northwest of the islands. Winds will be locally strong and gusty from the trade wind direction.
Satellite and Radar Images: To view the cloud conditions we have here in Hawaii, please use the following satellite links, starting off with this Infrared Satellite Image of the islands to see all the clouds around the state during the day and night. This next image is one that gives close images of the islands only during the daytime hours, and is referred to as a Close-up visible image. This next image shows a larger view of the Pacific…giving perspective to the wider ranging cloud patterns in the Pacific Ocean. Finally, here’s a Looping IR satellite image, making viewable the clouds around the islands 24 hours a day. To help you keep track of where any showers may be around the islands, here’s the latest animated radar image.
Hawaii’s Mountains – Here’s a link to the live webcam on the summit of near 14,000 foot Mauna Kea on the Big Island of Hawaii. The tallest peak on the island of Maui is the Haleakala Crater, which is near 10,000 feet in elevation. These two webcams are available during the daylight hours here in the islands…and when there’s a big moon rising just after sunset for an hour or two! Plus, during the nights and early mornings you will be able to see stars, and the sunrise too…depending upon weather conditions.
Tropical Cyclone activity in the eastern and central Pacific – Here’s the latest weather information coming out of the National Hurricane Center, covering the eastern north Pacific. You can find the latest tropical cyclone information for the central north Pacific (where Hawaii is located) by clicking on this link to the Central Pacific Hurricane Center. Here’s a tracking map covering both the eastern and central Pacific Ocean. A satellite image, which shows the entire ocean area between Hawaii and the Mexican coast…can be found here.
Aloha Paragraphs

Path to the beach…windward Oahu
Little change is expected in our local weather circumstances for the time being. The trade winds will be the main player in our HawaiianIsland weather picture through the rest of this week…into at least the early part of next week. The GFS computer model shows relatively clear sailing through the next 132 hours, with just the usual windward bias for showers. The trade winds will remain locally on the strong and gusty side through the next several days, although falling back into the more moderate realms by the weekend…and even lighter thereafter. The winds remain strong enough at mid-week, that small craft wind advisories remain active across the marine zones statewide. These gusty winds are potent enough upstream, to keep the high surf advisory level surf coming our way along the east facing shores.
In the rainfall department, amounts have dropped off quite a bit, at least compared to what we saw this past weekend into Monday. Looking upstream of the islands, to the east-northeast in this case, we see the usual cumulus and stratocumulus clouds being carried our way on the trade wind flow. This IR satellite image shows an area of high cirrus clouds to the southeast of the Big Island as well, which doesn’t seem to be shifting northwest at this time. Back to the lower level clouds, this larger perspective satellite view shows patches of incoming trade wind moisture. The overlying atmosphere however is more stable now than it was just a few days ago. This in turn suggests that the generosity of the showers along our windward sides have trended back towards the drier side of the precipitation spectrum. There will continue to be off and on showers however, but just not so many. The gusty trade winds will try to carry a few showers over into the leeward sides of the islands…only on the smaller islands though.
It’s early Wednesday evening here in Kihei, Maui, as I begin writing this last paragraph of today’s narrative. The trade winds remained very active today, accompanied by those frequent windward biased showers that fell. Looking out the window before I take the drive back upcountry to Kula, I see lots of blue skies, although there are plenty of clouds around too. I’m sure that you’ve noticed how early the sun is setting these days, and we don’t even have daylight savings time (HST) here in the islands. I honestly don’t mind all that much, as there’s something about turning on the lights in my car before arriving home…that I enjoy somehow. I must admit, that it’s a little more difficult to drag myself out on the street to take my walk in the almost total dark though, before starting my dinner. This is why I’m leaving right now, so that I can do just that. I’ll be back early Thursday morning with your next new weather narrative, I hope you have a great Wednesday night until then! Aloha for now…Glenn.
Interesting: It is humanity’s oldest enemy. Despite all our science, a sixth of people in the developing world are chronically hungry. At a summit in Rome this week, world leaders reaffirmed a pledge to end hunger "at the earliest possible date". The UN Food and Agriculture Organization (FAO) wanted them to promise to end hunger by 2025, but the delegates declined.
They said instead that they would keep trying to meet their previous goal: to halve chronic hunger from 20 per cent of people in developing countries to 10 per cent by 2015. But can they? Based on their performance so far, the FAO considers it "unlikely". That, agricultural experts say, is because governments have broken their promises and slashed aid budgets for agriculture.
The hungry poor fell to 16 per cent in 2007, mainly thanks to Asia’s economic boom, but recession and soaring food prices pushed it back to 17 per cent in 2008. "Ending hunger by 2025 is not realistic," says Joachim von Braun of IFPRI, a food-policy institute in Washington DC. "Halving it might be, but it requires sustained action."
It gets worse: global population is set to grow to 9.1 billion by 2050, while global warming will have a serious impact on farming. What can be done? The FAO says feeding 9 billion people will require a near-doubling in food production. All nations will have to take part, but attention will be focused on poor countries, where there is most room for improvement and where better farming will give poor farmers income to buy food.
The FAO says farming investment in poor countries must grow from $142 billion per year to $209 billion. Agricultural research must also increase. The Consultative Group on International Agricultural Research (CGIAR) – the international, mainly government-funded labs that perform farm research for poor countries – says agricultural R&D spending for developing countries needs to grow from $5.1 billion to $16.4 billion per year by 2025. Its researchers say that in theory, given funds, they can boost agriculture enough to double food production, although global warming may make this impossible.
Interesting2: Water is in short supply around the world, and demand for water is growing at the rate of 6% per year. The increasing demand is due to growing populations and increased agricultural production to feed those hungry mouths. “Water’s getting a lot of attention, and it has everything to do with sustainability,” says Jeff Tjornehoj, senior research analyst with fund-tracking firm Lipper.
“There’s an expectation that critical water needs are not being met, and that it’s only going to get worse in future.” In fact, meeting water needs is getting a lot of attention from investors around the world. Big business conglomerates like Siemens and General Electric are getting into the potable water business, as are other less known businesses around the globe.
In fact, on a strictly financial basis, a growing number of mutual funds now specialize in water, having ballooned to $1.8 billion in total assets, up by 40 percent in size in the last six months. In terms of eco friendly technology, there is a lot being done on this front as well.
As more cities, businesses, and universities become "green" oriented, water saving measures are becoming increasingly targeted in building plans. Re-use of "gray" (runoff from sinks and showers) water for irrigating garden spaces is likely to become not just an option for LEED or ILBI certification, but a requirement.
Underground water storage systems are already awarded substantial points in the LEED certification system, while it is required in the ILBI certification system. Many states and local governments are also allowing tax credits and grant funding to install underground water storage systems for both home and commercial property construction and retrofits.
Areas that have an abundance of water are increasingly becoming more and more reluctant to pipe or aqua-duct their water supplies to over populated areas that do not have adequate rainfall for their water needs. This is not only big business for some big investors – it is green business that is likely to impact all our lives on an increasingly growing scale in the years to come.
Interesting3: The widespread use of genetically modified (GM) crops engineered to tolerate herbicides has led to a sharp increase in the use of agricultural chemicals in the U.S. This practice is creating herbicide-resistant "super weeds" and an increase in chemical residues in U.S. food, according to a new report released today by The Organic Center, the Union for Concerned Scientists, and the Center for Food Safety.
According to the report, entitled "Impacts of Genetically Engineered Crops on Pesticide Use in the United States: The First Thirteen Years," as more farmers have adopted variations of corn, soy beans, and cotton bred to tolerate weed killer in recent years, the use of herbicides has increased steadily, with herbicide use growing by 383 million pounds from 1996 to 2008, according to the report. Forty-six percent of that increase occurred during 2007 and 2008.
On the plus side, the report said the use of insecticides has actually decreased by 64 million pounds since 1996 because many genetically modified crops such as cotton and corn carry traits that make them resistant to insects. The most popular genetically modified crops are known as "Roundup Ready" for their ability to survive after being sprayed with the herbicide, Roundup.
Officials with the Biotechnology Industry Organization said herbicide-resistant crops initially made it easier for farmers to manage weed problems. Over time, however, an unfortunate consequence has been a growing epidemic of herbicide-resistant weeds. "The drastic increase in pesticide use with genetically engineered crops is due primarily to the rapid emergence of weeds resistant to glyphosate, the active ingredient in Monsanto’s Roundup herbicide," said Dr. Charles Benbrook, report author and chief scientist of The Organic Center.
"With glyphosate-resistant weeds now infesting millions of acres, farmers face rising costs coupled with sometimes major yield losses, and the environmental impact of weed management systems will surely rise." The resulting war between farmers and increasingly tough-to-kill weeds is "bad news for farmers, human health and the environment," said Bill Freese, science policy analyst for the Center for Food Safety.
Interesting4: In an effort to reduce automobile usage and greenhouse gas emissions, the Dutch cabinet has approved a driving tax that would charge motorists seven cents a mile. The plan, which must still be approved by parliament, would use GPS systems installed in each car to keep track of mileage and automatically bill drivers. Dutch officials said the driving tax, which would replace existing road taxes and duties on new car purchases, is designed to cut traffic by 15 percent and reduce emissions from transport by 10 percent.
Other European nations are considering similar driving taxes, and a driving tax experiment was recently tried in Oregon in the United States. The chances of a tax comparable to the Dutch tax being levied in the U.S. are slim, however, as that would more than triple the $260 a year that the average U.S. driver now pays in state and federal gasoline taxes.
Interesting5: Women bear the brunt of drought, rising seas, melting glaciers and other effects of climate change but are mostly ignored in the debate over how to halt it, the United Nations Population Fund (UNFPA) said today. In its 2009 state of the world population report, the agency said the world’s poor are the most vulnerable to climate change and the majority of the 1.5 billion people living on $1 a day or less are women.
"Poor women in poor countries are among the hardest hit by climate change, even though they contributed the least to it," said UNFPA executive director Thoraya Ahmed Obaid. World leaders are due to meet at a U.N. global warming summit in Copenhagen in December and the U.N. agency urged them to think about how much women are harmed by climate change and how much they could be engaged in the fight against it.
Interesting6: Scientists are reporting evidence that air pollution — a well-recognized problem at major airports — may pose an important but largely overlooked health concern for people living near smaller regional airports. Those airports are becoming an increasingly important component of global air transport systems. The study, one of only a handful to examine airborne pollutants near regional airports, suggests that officials should pay closer attention to these overlooked emissions, which could cause health problems for local residents.
In the new study, Suzanne Paulson and colleagues note that scientists have known for years that aircraft emissions from fuel burned during takeoffs and landings can have a serious impact on air quality near major airports. Aircraft exhaust includes pollutants linked to a variety of health problems. However, researchers know little about the impact of such emissions at general aviation or regional airports, which tend to be located closer to residential neighborhoods than major airports, the article notes.
The scientists measured a range of air pollutants near a general aviation airport for private planes and corporate jets in Southern California (Santa Monica Airport) in the spring and summer of 2008. They found that emissions of so-called ultrafine particles, which are less than 1/500th width of a human hair, were significantly elevated when compared to background pollution levels.
Levels of these pollutants were up to 10 times higher at a downwind distance from the airport equal to about one football field and as much as 2.5 times higher at distance equal to about six football fields. The study suggests that "current land-use practices of reduced buffer areas around local airports may be insufficient."
Interesting7: Germany could be home to as many as 17 million fewer people in 50 years’ time, official statistics showed today, laying bare the scale of the demographic crisis in Europe’s top economy. At the same time, Germans are greying rapidly, with one in three set to be over 65 by 2060, compared to one in five now, the federal statistics office said. One in seven will be over 80.
The total population, currently 82 million, will slump to between 65 and 70 million and neither immigration nor an increase in the birth rate – currently 1.4 children per woman – can do much to ease the crisis, the office added.
Like other advanced economies, Germany is facing a snowballing population crisis, leaving the country short of workers and adding to the strain on already stretched public coffers. On the other hand, the global population is set to rise to nine billion by about 2050, up from 6.8 billion now, with most of the increase coming from the developing world, where people are on average much younger than in the West.
Posted by Glenn
1 Comment
November 17-18, 2009
Air Temperatures – The following maximum temperatures were recorded across the state of Hawaii Tuesday afternoon:
Lihue, Kauai – 79
Honolulu, Oahu – 84
Kaneohe, Oahu – 81
Kaunakakai, Molokai – 81
Kahului, Maui – 82
Hilo, Hawaii – 79
Kailua-kona – 84
Air Temperatures ranged between these warmest and coolest spots near sea level around the state – and on the highest mountains…at 5pm Tuesday evening:
Kailua-kona – 81F
Lihue, Kauai – 72
Haleakala Crater – missing (near 10,000 feet on Maui)
Mauna Kea summit – missing (near 14,000 feet on the Big Island)
Precipitation Totals – The following numbers represent the largest precipitation totals (inches) during the last 24 hours on each of the major islands, as of Tuesday afternoon:
3.65 Mount Waialaele, Kauai
4.17 Oahu Forest NWR, Oahu
0.15 Molokai
0.00 Lanai
0.00 Kahoolawe
4.85 Puu Kukui, Maui
3.11 Waiakea Uka, Big Island
Marine Winds – Here’s the latest (automatically updated) weather map showing a 1022 millibar high pressure system far to the east-northeast, and a 1035 millibar high north-northwest of the islands. Winds will be locally strong and gusty from the trade wind direction.
Satellite and Radar Images: To view the cloud conditions we have here in Hawaii, please use the following satellite links, starting off with this Infrared Satellite Image of the islands to see all the clouds around the state during the day and night. This next image is one that gives close images of the islands only during the daytime hours, and is referred to as a Close-up visible image. This next image shows a larger view of the Pacific…giving perspective to the wider ranging cloud patterns in the Pacific Ocean. Finally, here’s a Looping IR satellite image, making viewable the clouds around the islands 24 hours a day. To help you keep track of where any showers may be around the islands, here’s the latest animated radar image.
Hawaii’s Mountains – Here’s a link to the live webcam on the summit of near 14,000 foot Mauna Kea on the Big Island of Hawaii. The tallest peak on the island of Maui is the Haleakala Crater, which is near 10,000 feet in elevation. These two webcams are available during the daylight hours here in the islands…and when there’s a big moon rising just after sunset for an hour or two! Plus, during the nights and early mornings you will be able to see stars, and the sunrise too…depending upon weather conditions.
Tropical Cyclone activity in the eastern and central Pacific – Here’s the latest weather information coming out of the National Hurricane Center, covering the eastern north Pacific. You can find the latest tropical cyclone information for the central north Pacific (where Hawaii is located) by clicking on this link to the Central Pacific Hurricane Center. Here’s a tracking map covering both the eastern and central Pacific Ocean. A satellite image, which shows the entire ocean area between Hawaii and the Mexican coast…can be found here.
Aloha Paragraphs

Near Hana, Maui
The trade winds are picking up in strength now, and will remain blustery through the next several days, finally becoming somewhat lighter towards the weekend…and more so going into next week. Showers have remained active along the windward side of Kauai during the day, and will stay in the forecast for the other islands again tonight into Wednesday morning. This satellite image shows the shower band that is ticked Kauai, and another one getting ready to bring showers back to the Big Island Tuesday evening. A trough of low pressure, which has been enhancing the incoming showers as they move overhead…remains in place. Thus, partly cloudy conditions, with cloudy periods, will drop off and on windward biased showers. This looping radar image shows where those showers are falling.
Small craft wind advisories remain active Tuesday over all coastal and channel waters, as the trade winds peak in strength the next several days. High pressure to the east-northeast (1022 millibars) and north-northwest (1035 millibars), are the source of our gusty trade winds now. This weather map shows the positioning of these high pressure cells. All these gusty winds are making our ocean conditions choppy in many areas. Looking at the wind observations Tuesday evening, we see that the strongest gusts were over 30 mph at several places…with Maalaea Bay on Maui, and South Point on the Big Island, reporting 43 mph! The NWS office in Honolulu issued a wind advisory for those windiest areas from Oahu down through the Big Island late Tuesday morning…which will likely expire at some point Tuesday night.
In sum: windy with passing showers for the time being. Looking further ahead, there will be gradually diminishing trade wind speeds later this week. The latest computer forecast models suggest that next week will have even lighter trade winds blowing. These models go on to show considerably drier conditions then too. Speaking of dry, we have to remember that we are going into a strengthening El Nino phase, which often brings drier than normal weather to the islands. This doesn’t mean that we won’t have more storms, more rainy days, but perhaps somewhat fewer than what climatology would refer to as normal. Sometimes, when we have a dry winter and spring, the following summer can exhibit drought conditions…which have been known to become severe. Let’s hope it doesn’t go that way!
It’s early Tuesday evening here in Kihei, Maui, as I begin writing this last paragraph of today’s narrative. Looking out the window before I leave for the drive back upcountry, I see what looks to be a pretty typical late autumn evening, although the trade winds are cranking out there! The showers that we saw last night along the windward sides, will return tonight, although may not be quite so generous. Likely, Wednesday will look a lot like Tuesday’s weather conditions, although with perhaps a tad more sunshine along our leeward sides. ~~~ Today was a full on day of work, as the senior managers of the Pacific Disaster Center, huddled with Maui Counties mayor, along with her top officials. I was asked to give a weather briefing, and enjoyed that experience. I usually feel a little nervous about getting up in front of a large group of people, and then feel good when it’s finally over…as was the case today. ~~~ I’ve been getting home late the last few nights, so that it’s dark, or practically dark, by the time I get back to Kula. I’ve been missing my evening walk a few times, and I dislike doing that. Oh well, living life takes some flexibility doesn’t it! I’ll be back early Wednesday morning with your next new weather narrative, I hope you have a great Tuesday night until then! Aloha for now…Glenn.
Extra: Leopard Seal story!
Interesting: The U. S. Senate currently has an historic opportunity to take a major step toward improving food safety for all Americans. That is why a coalition of public health professionals, consumer organizations and groups representing victims of food borne illness is sending the message that it is time to "Make Our Food Safe."
Every year, millions of Americans are sickened from consuming contaminated food, hundreds of thousands are hospitalized and thousands die. Multiple outbreaks of food borne illness over the last several years — from spinach to peppers to peanut butter products — have demonstrated that these outbreaks are not random, unpreventable occurrences, but are due to widespread problems with food safety oversight in the United States.
This summer the U.S. House of Representatives passed its version of a sweeping food safety bill, which includes increased inspections of domestic food facilities and greater oversight of imports.
The Make Our Food Safe coalition believes the Senate can take a major step forward in protecting public health by passing legislation that gives the U.S. Food and Drug Administration (FDA) enhanced authority to oversee the safety of the nation’s food supply by the end of this year.
Interesting2: An upgrade to a Cray XT5 high-performance computing system deployed by the Department of Energy has made the "Jaguar" supercomputer the world’s fastest. Located at Oak Ridge National Laboratory, Jaguar is the scientific research community’s most powerful computational tool for exploring solutions to some of today’s most difficult problems.
The upgrade, funded with $19.9 million under the Recovery Act, will enable scientific simulations for exploring solutions to climate change and the development of new energy technologies. "Supercomputer modeling and simulation is changing the face of science and sharpening America’s competitive edge," said Secretary of Energy Steven Chu.
"Oak Ridge and other DOE national laboratories are helping address major energy and climate challenges and lead America toward a clean energy future." To net the number-one spot on the TOP500 list of the world’s fastest supercomputers, Jaguar’s Cray XT5 component was upgraded this fall from four-core to six-core processors and ran a benchmark program called High-Performance Linpack (HPL) at a speed of 1.759 petaflop/s (quadrillion floating point operations, or calculations, per second). The rankings were announced today in Portland at SC09, an international supercomputing conference.
Interesting3: Peter Fraenkel, Technical Director and co-founder of Marine Current Turbines, the UK-based company that designed and developed SeaGen, the world’s only commercial scale tidal stream turbine, announced at the Lisbon International Ocean Power Conference that he is "delighted with SeaGen’s performance. It is running reliably and delivering more energy than originally expected in an extremely aggressive environment."
The turbines are powered by a consistent tidal current that surges back and forth with every tide through the Strangford Narrows in Northern Ireland at speeds of up to 10 miles per hour. The generators typically produce enough energy to meet the average electricity needs for 1500 UK homes during each ebb and each flood tide. "We are getting more energy than expected mainly because the resource is more energetic than originally predicted during earlier surveys," added Fraenkel.
Interesting4: Recording hundreds of thousands of signals sent by satellite transmitters fitted on penguins, albatrosses, and marine mammals, the Wildlife Conservation Society (WCS) and Birdlife International have released the first atlas of South America’s Patagonian Sea. Called Atlas of the Patagonian Sea: Species and Spaces, the 300-page book was edited by Valeria Falabella and Claudio Campagna of WCS, and John Croxall of Birdlife International.
The atlas contains the most accurate maps ever assembled for this ecosystem and shows key migratory corridors spanning from coastlines to deep-sea feeding areas off the continental shelf hundreds of miles away. Data for the atlas was gathered by a team of 25 scientists working over a 10-year period.
The team tracked 16 species of marine animals, which produced some 280,000 uplinks of data over the Patagonian Sea, a huge area ranging from southern Brazil to southern Chile. The atlas will be used to help inform policy decisions in the region such as managing fisheries and charting transportation routes of oil tankers. This vast region is increasingly threatened by burgeoning development and overfishing.
Interesting5: A growing number of American consumers would like to tell President Obama to focus on the economy first before tackling environmental issues, according to research published today. The finding, part of the monthly Green Confidence Index, is that while significant numbers of Americans support the administration’s environmental stance, their principal concern remains focused on the economy.
The number of Americans preferring that the president "focus on the economy first" or "keep a balanced perspective" rose over the past month, while the number urging President Obama to "educate us about the issues" dropped.
The Green Confidence Index is a monthly snapshot of Americans’ attitudes about and confidence in their leaders and institutions, nationally and locally, on the subject of environmental responsibility, as well as in their own understanding of issues and their willingness to make green purchasing choices.
During October, the Index fell four points from a month earlier, from 103.6 to 99.5. The Index was set in July 2009 at 100.0. According to Chief Research Officer Amy Hebard of Earthsense, whose company creates the Index: "Should we worry about a four-point drop in the Index? Not yet.
Confusion in this market is broad and deep and, with the economy still in jitters, consumers’ confidence in going green will take time to build before we realize the pent-up demand we’ve seen. As we approach the holiday season, a key question will be whether or not the drop we saw in October is the start of a downward slide or just a one-month blip.
Interesting6:
Her name was Lady Rai. She was a nurse maid to an Egyptian queen who lived three centuries before the reign of Pharaoh Ramses I. And she suffered from heart disease. The evidence lies in a CT scan of Lady Rai’s mummified remains, researchers here said Tuesday. Using 21st-century science, they peered through her tattered wrappings and into her ancient arteries.
There, they found evidence of the same kind of plaque that doctors now diagnose every day. What’s more, they found it in someone who lived 3,500 years before fast food, sedentary living and cheap cigarettes. The research suggests that while modern risk factors may account for the current epidemic of heart disease, the ailment predates them.
"To me, it means we’re all susceptible," says researcher Randall Thompson of the Mid America Heart Institute in Kansas City, Mo., who presented the findings at an American Heart Association meeting. "To a certain extent, this may be a disease of being human." The images of Lady Rai are part of a series made in February by a team of cardiologists, imaging experts, Egyptologists and preservationists at the Museum of Antiquities in Cairo.
The team examined 22 mummies, dating from 1981 B.C. to A.D. 364. They found heart tissue or blood vessels in 13; in four, they found intact hearts. Three of the mummies had atherosclerosis, a buildup of fat, cholesterol and calcium inside their arteries. Another three had probable atherosclerosis. Calcified blockages were more common in mummies who were estimated to have died after the age of 45, researchers say.
The images of Lady Rai betrayed classic evidence of calcified plaque in the aorta, which appears as a bright spot on the CT image. "It’s just what you’d see in a living patient," Thompson says. "We don’t know whether she died of a heart attack or not, but we can tell that she had the disease process that leads to heart attacks." The most ancient mummy with evidence of heart disease died between 1530 B.C. and 1570 B.C., the researchers say.
The project got its start when senior author Gregory Thomas of the University of California-Irvine visited the museum with Egyptian cardiologist Adel Allam. When Allam, a devout Muslim, left the museum briefly to pray, he noticed a CT scanner in a trailer parked out back. The scanner had been used for other research. The idea for the project was born.
The project was funded by the National Bank of Egypt, the Mid America Heart Institute and scanner maker Siemens. Each of the mummies was slid intact into a donut-shaped, six-slice CT scanner for a sequence of X-rays. "We didn’t have to tell them to hold their breath," joked collaborator Samuel Wann of the Wisconsin Heart Hospital.
Posted by Glenn
[3] Comments
November 16-17, 2009
Air Temperatures – The following maximum temperatures were recorded across the state of Hawaii Monday afternoon:
Lihue, Kauai – 78
Honolulu, Oahu – 85
Kaneohe, Oahu – 80
Kaunakakai, Molokai – 81
Kahului, Maui – 79
Hilo, Hawaii – 72
Kailua-kona – 85
Air Temperatures ranged between these warmest and coolest spots near sea level around the state – and on the highest mountains…at 4pm Monday afternoon:
Honolulu, Oahu – 82F
Hilo, Hawaii – 71
Haleakala Crater – 48 (near 10,000 feet on Maui)
Mauna Kea summit – 34 (near 14,000 feet on the Big Island)
Precipitation Totals – The following numbers represent the largest precipitation totals (inches) during the last 24 hours on each of the major islands, as of Monday afternoon:
1.46 Mount Waialaele, Kauai
0.54 Oahu Forest NWR, Oahu
0.02 Molokai
0.00 Lanai
0.00 Kahoolawe
6.26 Puu Kukui, Maui
1.78 Piihonua, Big Island
Marine Winds – Here’s the latest (automatically updated) weather map showing a 1024 millibar high pressure system far to the northeast, and a 1035 millibar high northwest of the islands Monday night. Winds will be locally strong and gusty from the trade wind direction through at least the middle of the week…easing off towards the weekend.
Satellite and Radar Images: To view the cloud conditions we have here in Hawaii, please use the following satellite links, starting off with this Infrared Satellite Image of the islands to see all the clouds around the state during the day and night. This next image is one that gives close images of the islands only during the daytime hours, and is referred to as a Close-up visible image. This next image shows a larger view of the Pacific…giving perspective to the wider ranging cloud patterns in the Pacific Ocean. Finally, here’s a Looping IR satellite image, making viewable the clouds around the islands 24 hours a day. To help you keep track of where any showers may be around the islands, here’s the latest animated radar image.
Hawaii’s Mountains – Here’s a link to the live webcam on the summit of near 14,000 foot Mauna Kea on the Big Island of Hawaii. The tallest peak on the island of Maui is the Haleakala Crater, which is near 10,000 feet in elevation. These two webcams are available during the daylight hours here in the islands…and when there’s a big moon rising just after sunset for an hour or two! Plus, during the nights and early mornings you will be able to see stars, and the sunrise too…depending upon weather conditions.
Tropical Cyclone activity in the eastern and central Pacific – Here’s the latest weather information coming out of the National Hurricane Center, covering the eastern north Pacific. You can find the latest tropical cyclone information for the central north Pacific (where Hawaii is located) by clicking on this link to the Central Pacific Hurricane Center. Here’s a tracking map covering both the eastern and central Pacific Ocean. A satellite image, which shows the entire ocean area between Hawaii and the Mexican coast…can be found here.
Aloha Paragraphs

Hawaiian Stilts
The fresh trade winds will carry off and on showers to the windward sides for the time being…with a few of these showery clouds sneaking over into the leeward sides here and there. Showers have remained active along those windward sides through the day, and will stay in the forecast as we move through most of this new work week. This satellite image shows abundant cloudiness upstream of the islands. The trough of low pressure, which was enhancing the incoming showers recently, is now pretty much out of the picture. Thus, partly cloudy conditions, with some cloudy periods, will drop frequent windward biased showers. This looping radar image shows where the showers are falling, most notably near the Big Island of Hawaii at this time of this writing.
Gusty trade winds will stay in place, and nudge up a little in strength Tuesday through Thursday…dropping back down some Friday into this coming weekend. High pressure to the northeast (1024 millibars) and northwest (1035 millibars), will be the source of our locally breezy trade winds now. This weather map shows the positioning of these high pressure cells. We have small craft wind advisories covering the entire state, with our ocean conditions choppy in most areas. Looking at the observations Monday evening, we see that the strongest gusts were reaching to 30-36 mph at those windiest spots around 5pm. The morning hours will find the lightest winds, which will increase in speed during the afternoon hours generally.
The surf will be an issue at times this week, which will be at times larger than normal. As the trade winds continue blowing, they will keep rough and choppy surf in place across our east facing beaches…gradually becoming less intense by the weekend. The north shores, which are known for their larger surf during the later autumn months, will have plenty of that. This week will begin small on those beaches, but then rise Tuesday through Thursday into Friday…with a second even larger NNW swell arriving later this coming weekend. The west sides will be small at first, but then rise along with the north shores beginning Tuesday. The south shores, which are usually small this time of year, will be larger than normal through the first half of this week, as an out of season south swell breaks.
Monday was an unusually cloudy day, with lots of passing showers along the north and east facing slopes…with even some showers flying over the south and west facing leeward areas at time too. Looking out the window here in Kihei, Maui, before I take the drive back upcountry to Kula, I see a nice looking rainbow. There are lots of clouds out there this evening, which should be the case again on Tuesday. The strong and gusty trade winds are teaming up with all the available moisture upstream of the islands…bringing it our way. ~~~ This evening, after having dinner at home, I’ll drive over to Haiku, on the windward side. I’m going back over to that same place I went this past Saturday morning, to attend a zen sitting session with the Maui Zendo folks. I may incorporate this into my regular weekly schedule, although it keeps me up a bit later than I’d prefer, considering the early rising I do during the week. ~~~ I’m trying to leave work a little early today, so I can fit in this evening activity. So, I’d better do just that, although I’ll be back again early Tuesday morning with your next new weather narrative. I hope you have a great Monday night until then! I’ll be getting up a bit earlier than usual Tuesday, so I can check out the meteors associated with the Leonid shower. Aloha for now…Glenn.
By the way: Meteor shower early Tuesday morning
Interesting: The illicit trade in ivory, which has been increasing in volume since 2004, moved sharply upward in 2009, according to the latest analysis of seizure data in the Elephant Trade Information System (ETIS). The remarkable surge in 2009 reflects a series of large-scale ivory seizure events that suggest an increased involvement of organized crime syndicates in the trade, connecting African source countries with Asian end-use markets.
The ETIS data indicate that such syndicates have become stronger and more active over the last decade. The ETIS analysis identifies Nigeria, the Democratic Republic of the Congo and Thailand as the three countries most heavily implicated in the global illicit ivory trade. Cameroon, Gabon and Mozambique in Africa and Hong Kong SAR, Malaysia, the Philippines, Singapore, Taiwan and Vietnam in Asia were also identified as important nodes in the illicit ivory trade.
Interesting2: It’s that time again! Time to renew our commitment to recycling. Take the pledge to learn more and recycle all you can. Find out what things can be recycled, spread the word about recycling, and help reduce waste going into landfills, improve our efficiency, and fight climate change.
Consider donating usable products such as bicycles to organizations like Pedals for Progress which can get used bicycles to people in developing countries where they can stimulate economic growth and help individuals make a better life for their families.
There are also organizations that can help find in the re-use of electronics and computers. America Recycles Day is November 15th this year. Are you looking for new opportunities to recycle throughout the year?
Keeping good recycling habits at home, work, and on the go can help with climate change. By reusing, recycling, and being smarter in the amounts and types of materials used, people can save energy, use fewer natural resources, and reduce greenhouse gas emissions.
America Recycles Day is the only nationally recognized day dedicated to encouraging Americans to recycle and to buy recycled products. Celebrating its 12th year, it has grown to include millions of Americans pledging to increase their recycling habits at home and work and to buy products made with recycled materials.
Through America Recycles Day, Keep America Beautiful, Inc. and the National Recycling Coalition support local communities and raises awareness by educating citizens about the benefits of recycling. Volunteer America Recycles Day coordinators are positioned throughout the country and work to organize recycling awareness events in their schools and communities, and in conjunction with their local municipalities.
Thousands of Americans across the country are making a difference, simply by keeping plastic bottles, paper, unwanted electronics, and other recyclable materials out of the waste stream.
The lifecycle energy savings of recycling rather than land filling one aluminum can is equivalent to the energy use of a laptop for 5 hours, a 60-watt incandescent light bulb for 4 hours, or a 60-watt compact fluorescent light bulb for 20 hours. America Recycles Day is a great time to think about our role in creating a sustainable environment by being responsible consumers.
Interesting3: Researchers in MIT’s Department of Civil and Environmental Engineering believe they have pinpointed a pathway by which arsenic may be contaminating the drinking water in Bangladesh, a phenomenon that has puzzled scientists, world health agencies and the Bangladeshi government for nearly 30 years. The research suggests that human alteration to the landscape, the construction of villages with ponds, and the adoption of irrigated agriculture are responsible for the current pattern of arsenic concentration underground.
The pervasive incidence of arsenic poisoning in Bangladesh and its link to drinking water were first identified in the scientific literature in the early 1980s, not long after the population began switching from surface water sources like rivers and ponds to groundwater from newly installed tube wells.
That national effort to decrease the incidence of bacterial illnesses caused by contaminated drinking water led almost immediately to severe and widespread arsenic poisoning, which manifests as sores on the skin and often leads to cancers of the skin, lung, liver, bladder and pancreas.
Since then, scientists have struggled to understand how the arsenic, which is naturally occurring in the underground sediment of the Ganges Delta, is being mobilized in the groundwater. By 2002, a research team led by Charles Harvey, the Doherty Associate Professor of Civil and Environmental Engineering at MIT, had determined that microbial metabolism of organic carbon was mobilizing the arsenic off the soils and sediments, and that crop irrigation was almost certainly playing a role in the process.
But the exact sources of the contaminated water have remained elusive, until now. In a paper appearing online in Nature Geoscience Nov. 15, Harvey, former graduate students Rebecca Neumann and Khandakar Ashfaque and co-authors explain that ponds excavated for the purpose of providing soil to build up villages for flood protection are the source of the organic carbon that presently mobilizes the arsenic in their 6-square-mile test site.
The carbon settles to the bottom of the ponds, then seeps underground where microbes metabolize it. This creates the chemical conditions that cause arsenic to dissolve off the sediments and soils and into the groundwater. The researchers also found that in their test area, which is flooded by annual monsoons, the rice fields irrigated with arsenic-laden water actually serve to filter out much of the arsenic from the water system.
Interesting4: Research at the Lund University Vision Group can now show that the color vision of birds stops working considerably earlier in the course of the day than was previously believed, in fact, in the twilight. Birds need between 5 and 20 times as much light as humans to see colors. It has long been known that birds have highly developed color vision that vastly surpasses that of humans.
Birds see both more colors and ultraviolet light. However, it was not known what amount of light is necessary for birds to see colors, which has limited the validity of all research on this color vision to bright sunlight only. "Using behavioral experiments we can now demonstrate that birds lose their color vision in the twilight and show just how much light is needed for birds to be able to interpret color signals," says Olle Lind, a doctoral candidate at the Department of Cell and Organism Biology.
For humans and horses, color vision ceases to work after dusk, at light intensities roughly corresponding to bright moonlight. However, the light threshold is not the same for all vertebrates. Geckos, for instance, can see colors at night. In the experiments performed by the Lund University Vision Group, the color vision of birds stopped working at light intensities corresponding to what prevails shortly after the sun goes down.
Birds need between 5 and 20 times as much light as humans to see colors. Among all the vertebrates tested thus far, birds are the first to lose their color vision in the twilight, even though they are the vertebrates that probably see colors best of all in the daylight.
Interesting5: The United States is using less water than during the peak years of 1975 and 1980, according to water use estimates for 2005. Despite a 30 percent population increase during the past 25 years, overall water use has remained fairly stable according to a new U.S. Geological Survey report. Assistant Secretary of the Interior Anne Castle announced the report, Estimated Use of Water in the United States in 2005, as part of her keynote speech on October 29 at the Atlantic Water Summit in the National Press Club.
The report shows that in 2005 Americans used 410 billion gallons per day, slightly less than in 2000. The declines are attributed to the increased use of more efficient irrigation systems and alternative technologies at power plants. Water withdrawals for public supply have increased steadily since 1950–when USGS began the series of five-year trend reports–along with the population that depends on these supplies.
"The importance of this type of data to the American public cannot be exaggerated," said Assistant Secretary for Water and Science Anne Castle. "The Department of the Interior provides the nation with the best source of information about national and regional trends in water withdrawals. This information is invaluable in ensuring future water supplies and finding new technologies and efficiencies to conserve water."
Nearly half (49 percent) of the 410 billion gallons per day used by Americans was for producing electricity at thermoelectric power plants. Irrigation accounted for 31 percent and public supply 11 percent of the total. The remaining 9 percent of the water was for self-supplied industrial, livestock, aquaculture, mining and rural domestic uses.
"Because electricity generation and irrigation together accounted for a massive 80 percent of our water use in 2005, the improvements in efficiency and technology give us hope for the future," Castle said. "The report also underscores the importance of recognizing the limits of the drinking water supplies on which our growing population depends. While public-supply withdrawals have continued to increase overall, per capita use has decreased in many States during recent decades.
"These are just a few examples of why, if we want to understand and address the nation’s current water issues and prepare to answer future water questions, we need the data provided in this report," Castle noted.
Interesting6: One key aspect of the discussion this week at the Transatlantic Media Dialog — part of the ongoing effort of climate and energy cooperation began earlier this years as the "Transatlantic Climate Bridge" was the issue of perception. Specifically how climate change and climate policy is perceived in the US and EU, as well as across the globe. David Catarious was one of the speakers at the conference this week. Catarious is a consultant for the Center for Naval Analysis (CNA),and was on the team that helped prepare an assessment report that considered the national security risks of climate change.
CNA brought together a Military Advisory Board chaired by former army Chief-of-Staff General Gordon Sullivan and consisting of 11 retired three and four-start admirals and generals. The group comprises a vast body of experience and unique perspective on world affairs. As on example, one board member, Admiral Richard Truly, is a former astronaut (shuttle pilot), Administrator of NASA, and former director of the National Renewable Energy Lab in Golden, Colorado.
The report was tasked with assessing the national security threat of projected climate change over the next thirty to forty years, encompassing the time frame for developing new military threats and capabilities. The report concludes that climate change is indeed a threat to America’s national security, and key to that finding is the conclusion that global warming is a "threat multiplier" for instability in some of the most volatile regions of the world, and that such volatility will reach even the most stable regions due to the tensions caused by climate change.
The report focuses on four key aspects of climate change risk that will likely lead to global instability and thus threaten national security:
1. Water
2. Food security
3. Health risks from vector borne diseases
4. Land loss and flooding
One of the first likely examples of climate-based instability is Darfur, where herders and farmers co-existed peacefully for many years. When the region became plagued with a prolonged drought, herders began moving their livestock on to their productive land that was rapidly becoming leas productive as a result of the draught. That situation led to ethnic conflict, which led to the genocide that we see today.
Posted by Glenn
[2] Comments
November 15-16, 2009
Air Temperatures – The following maximum temperatures were recorded across the state of Hawaii Sunday afternoon:
Lihue, Kauai – 80
Honolulu, Oahu – 85
Kaneohe, Oahu – 80
Kaunakakai, Molokai – 82
Kahului, Maui – 82
Hilo, Hawaii – 72
Kailua-kona – 85
Air Temperatures ranged between these warmest and coolest spots near sea level around the state – and on the highest mountains…at 4pm Sunday afternoon:
Port Allen, Kauai – 82F
Hilo, Hawaii – 74
Haleakala Crater – 50 (near 10,000 feet on Maui)
Mauna Kea summit – 37 (near 14,000 feet on the Big Island)
Precipitation Totals – The following numbers represent the largest precipitation totals (inches) during the last 24 hours on each of the major islands, as of Sunday afternoon:
11.66 Kapahi, Kauai
1.65 Oahu Forest NWR, Oahu
0.01 Molokai
0.00 Lanai
0.00 Kahoolawe
1.25 West Wailuaiki, Maui
4.14 Mountain View, Big Island
Marine Winds – Here’s the latest (automatically updated) weather map showing a 1028 millibar high pressure system far to the northeast, and a 1033 millibar high northwest of the islands. Winds will be locally strong and gusty from the trade wind direction into the new week ahead.
Satellite and Radar Images: To view the cloud conditions we have here in Hawaii, please use the following satellite links, starting off with this Infrared Satellite Image of the islands to see all the clouds around the state during the day and night. This next image is one that gives close images of the islands only during the daytime hours, and is referred to as a Close-up visible image. This next image shows a larger view of the Pacific…giving perspective to the wider ranging cloud patterns in the Pacific Ocean. Finally, here’s a Looping IR satellite image, making viewable the clouds around the islands 24 hours a day. To help you keep track of where any showers may be around the islands, here’s the latest animated radar image.
Hawaii’s Mountains – Here’s a link to the live webcam on the summit of near 14,000 foot Mauna Kea on the Big Island of Hawaii. The tallest peak on the island of Maui is the Haleakala Crater, which is near 10,000 feet in elevation. These two webcams are available during the daylight hours here in the islands…and when there’s a big moon rising just after sunset for an hour or two! Plus, during the nights and early mornings you will be able to see stars, and the sunrise too…depending upon weather conditions.
Tropical Cyclone activity in the eastern and central Pacific – Here’s the latest weather information coming out of the National Hurricane Center, covering the eastern north Pacific. You can find the latest tropical cyclone information for the central north Pacific (where Hawaii is located) by clicking on this link to the Central Pacific Hurricane Center. Here’s a tracking map covering both the eastern and central Pacific Ocean. A satellite image, which shows the entire ocean area between Hawaii and the Mexican coast…can be found here.
Aloha Paragraphs

Waipio Valley…the Big Island of Hawaii
The windward sides will remain on the wet side…with even a few localized leeward showers at times. The heavy rain producing low pressure system, which kept unsettled weather over us recently, has nowed opened up into a broad trough of low pressure. This in turn has taken the threat of heavy rains mostly out of the current forecasts. This satellite image, with its very large view of the Pacific Ocean, shows all the bright white clouds, those that usually bring lots of rains having dissipated. As I was mentioning recently, this is good news for most folks around the Aloha state, as we got a got soaking in many areas.
The rainfall remains active now along the north and east facing windward coasts and slopes Sunday night…and will remain in place for a while longer. If we take a closer look at the clouds around the islands, with this tighter focus…we see considerably less cloudiness around now. What’s left now is principally the lower level rain bearing clouds, carried our way on the gusty trade winds. This looping radar image shows almost all of the precipitation taking aim on the windward sides. At around 5pm Sunday evening, there were reports of light rains falling along several of those north and east facing spots around the chain.
Meanwhile, the trade winds are blowing briskly now, and will continue to do so into the new work week ahead. High pressure to the northeast (1033 millibars) and northwest (1028 millibars), will be the source of our locally breezy trade winds now. This weather map shows the positioning of these high pressure cells. We have small craft wind advisories covering the entire state, with our ocean conditions choppy in most areas. Looking at the observations Sunday evening, we see that the strongest gusts were reaching to 35 mph at those windiest spots. These trade winds are expected to remain active through the upcoming week...increasing a notch by Tuesday.
Here in Kula, Maui, Sunday evening, its generally cloudy, with showers definitely falling along the windward side of east Maui…and the upper west sides too. As we move into the new work week, we’ll find the trade winds prevailing, with off and on windward biased showers continuing. The leeward sides should see improved weather, although there may be a few showers flying over there on the blustery trade wind flow. All that air in a hurry along the east shores will continue to cause round and pounding surf. Storms in the southern hemisphere have generated a south swell, which will be arriving along our leeward beaches beginning Monday. This swell will bring larger than normal surf to those south and west facing beaches.
~~~ Today has been a day of rest, finally catching up from my recent vacation, and getting my personal affairs back in order. I just made what I believe will be a tasty pasta sauce. I had a couple of strips of organic bacon this morning, plated together with a couple of organic chicken eggs, and toast. I let the oils from the bacon saute the onion I used for my pasta sauce. I then added mushrooms, zuchini, bok choi, and broccoli, along with a can of organic diced tomatoes. I tossed in a cut up pepper from the garden, and finally some freshly picked basil leaves too. I had saved some of the bacon from the morning, and cut that up too…throwing it in to add some protein to the meals that I’ll be having through Thursday evening. While we’re discussing food and stuff, I’m sipping on a small glass of Baileys Irish Cream, from a bottle a good friend gave me about a year ago, when I stopped doing the TV weather show down at the college. If you’ve ever tried this drink, you know just how good it tastes!
~~~ I’m going to go out and take a walk as soon as I finish this last paragraph. I’ll be back online again early Monday morning, with your next new weather narrative from paradise. I hope you have a great Sunday night until then! Aloha for now…Glenn.
Interesting: There is water on the Moon, scientists stated unequivocally on Friday, and considerable amounts of it. “Indeed yes, we found water,” Anthony Colaprete, the principal investigator for NASA’s Lunar Crater Observation and Sensing Satellite, said in a news conference. The confirmation of scientists’ suspicions is welcome news both to future explorers who might set up home on the lunar surface and to scientists who hope that the water, in the form of ice accumulated over billions of years, could hold a record of the solar system’s history.
The satellite, known as Lcross (pronounced L-cross), slammed into a crater near the Moon’s south pole a month ago. The impact carved out a hole 60- to 100-feet wide and kicked up at least 24 gallons of water. “We got more than just whiff,” said Peter H. Schultz, a professor of geological sciences at Brown University and a co-investigator of the mission. “We practically tasted it with the impact.”
For more than a decade, planetary scientists have seen tantalizing hints of water ice at the bottom of these cold craters where the sun never shines. The Lcross mission consisted of two pieces — an empty rocket stage to carve into the lunar surface and a small spacecraft to measure what was kicked up, but it too slammed into the surface.
For space enthusiasts who stayed up, or woke up early, to watch the impact on Oct. 9, the event was anticlimactic, even disappointing, as they failed to see the anticipated debris plume. But NASA later said that a plume was indeed photographed; the live video stream was not properly attuned to pick out the details. The water findings come from analysis of the slight shifts in color after the impact, showing telltale signs of water.
Interesting2: Is there such a thing as "weather" on Mars? There are some doubts, considering the planet’s atmosphere is only 1 percent as dense as that of the Earth. Mars, however, definitely has clouds, drastically low temperatures and out-of-this-world dust storms. Istvan Szunyogh, a Texas A&M professor of atmospheric sciences, was recently awarded a NASA grant to analyze and forecast Martian weather. Mars is the most Earth-like planet we know, but it is still quite different. For example, it is much colder on Mars.
The south pole of the Earth is covered by water ice, but the south pole of Mars wears a dry ice (frozen carbon dioxide) cap. In winter, the temperature at the poles can dip to -220 degrees Fahrenheit, which is so cold that even carbon dioxide freezes. "Planet-encircling Martian dust storms, which occur every two to four Mars years, can cover the whole planet with dust for months," notes Szunyogh, who is working with colleagues from the University of Maryland and the Geophysical Fluid Dynamics Laboratory in Princeton, N.J., to forecast Martian weather.
Why care about weather on Mars? After all, nobody lives, works or goes to school there. "Martian weather forecasts, in the short term, can drastically increase the safety of landing robotic exploration missions," comments colleague Mark Lemmon, a Texas A&M professor of atmospheric sciences who has led or participated in many Mars exploratory events. "In the long run, it is indispensible for the safe returning of astronauts in future manned explorations.
"The two rovers currently working on Mars are solar-powered, and their lives end when their batteries run out," Lemmon adds. "Dust storms block the sun and shorten their battery life, and winds, on the other hand, can clear their solar panels so their batteries recharge faster." Weather forecasting is not tossing dice. It must build on solid data.
"All weather forecasts, including those on TV, are based on model forecasts of the different physical parameters of the Earth’s atmosphere such as temperature, wind and pressure," Szunyogh says. "The main goal of our project is to explore the possibility of obtaining accurate quantitative estimates of these parameters of the Martian atmosphere. "These parameters will be obtained from the available remotely sensed Martian observations," he adds. "Then the data can be fed into Mars global circulation models, producing Martian weather forecasts like what we have for Earth."
Interesting3: Spurred by a warming climate, daily record high temperatures occurred twice as often as record lows over the last decade across the continental United States, new research shows. The ratio of record highs to lows is likely to increase dramatically in coming decades if emissions of greenhouse gases continue to climb. "Climate change is making itself felt in terms of day-to-day weather in the United States," says Gerald Meehl, the lead author and a senior scientist at the National Center for Atmospheric Research (NCAR). "The ways these records are being broken show how our climate is already shifting."
The study, by authors at NCAR, Climate Central, The Weather Channel, and the National Oceanic and Atmospheric Administration (NOAA), has been accepted for publication in Geophysical Research Letters. It was funded by the National Science Foundation, NCAR’s sponsor, the Department of Energy, and Climate Central.
If temperatures were not warming, the number of record daily highs and lows being set each year would be approximately even. Instead, for the period from January 1, 2000, to September 30, 2009, the continental United States set 291,237 record highs and 142,420 record lows, as the country experienced unusually mild winter weather and intense summer heat waves.
A record daily high means that temperatures were warmer on a given day than on that same date throughout a weather station’s history. The authors used a quality control process to ensure the reliability of data from thousands of weather stations across the country, while looking at data over the past six decades to capture longer-term trends. This decade’s warming was more pronounced in the western United States, where the ratio was more than two to one, than in the eastern United States, where the ratio was about one-and-a-half to one.
The study also found that the two-to-one ratio across the country as a whole could be attributed more to a comparatively small number of record lows than to a large number of record highs. This indicates that much of the nation’s warming is occurring at night, when temperatures are dipping less often to record lows. This finding is consistent with years of climate model research showing that higher overnight lows should be expected with climate change.
Interesting4: Volcanic eruptions were responsible for a deadly ice age 450 million years ago, as well as — in an ironic twist — a period of global warming that preceded it, a new study finds. The finding underscores the importance of carbon in Earth’s climate today, said study researcher Matthew Saltzman of Ohio State University. The ancient ice age featured glaciers that covered the South Pole on top of the supercontinent of Gondwana (which would eventually break apart to form the present-day continents of the southern hemisphere).
Two-thirds of all species perished in the frigid climate. Previously, Saltzman and his team linked this same ice age, which took place in the Ordovician period, to the rise of the Appalachian Mountains. As the exposed rock weathered, chemical reactions pulled carbon from Earth’s atmosphere, causing the deadly global cooling.
With models, the researchers have now pieced together the other half of the story: Giant volcanoes that formed during the closing of the proto-Atlantic Ocean — known as the Iapetus Ocean — set the stage for the rise of the Appalachians and the ice age that followed. "Our model shows that these Atlantic volcanoes were spewing carbon into the atmosphere at the same time the Appalachians were removing it," Saltzman said.
"For nearly 10 million years, the climate was at a stalemate. Then the eruptions abruptly stopped, and atmospheric carbon levels fell well below what they were in the time before volcanism. That kicked off the ice age." To figure out this geologic history, Saltzman and his colleagues used computer models to draw together measurements of isotopes of chemical elements from rocks in Nevada, Virginia and Pennsylvania with measurements of volcanic ash beds in the same locations.
They also factored in temperature models developed by other scientists. The ash deposits demonstrated when the volcanoes stopped erupting, and the isotope measurements pinpointed the Appalachians as the source of the volcanic rock. The new findings mesh well with what scientists know about these ancient proto-Atlantic volcanoes, which are thought to have produced the largest eruptions in Earth’s history.
They issued enough lava to form the Appalachians, enough ash to cover the far ends of the earth, and enough carbon to heat the globe. Atmospheric carbon levels grew to levels 20 times higher than they are today. This study shows that when those volcanoes stopped erupting, carbon levels dropped, and the climate swung dramatically back to cold. The timing coincides with today’s best estimates of temperature fluctuations in the Ordovician.
Interesting5: Tiny particles of pollution that are harmful to human health stick to tree leaves and leave a trace magnetism, a new study finds. More pollution is found stuck to leaves of trees near busy roadways than those in less trafficked areas. The pollution-trapping leaves could serve as an easy, inexpensive way to monitor pollutant levels, researchers say.
Scientists in Europe first noticed that a type of pollution called particulate matter was sticking to leaves in industrial areas. Particulate matter is created by the combustion of fuel and can include many different compounds. The ones these scientists detected were metallic pollutants — such as iron oxides from diesel exhaust — that left a magnetic trace on the leaves (though the leaves themselves don’t become magnets).
The bumpy, wavy surfaces on the leaves easily trap the floating particles of pollution, which either remain stuck to the leaves surface or can even grow right into the leaf. The leaves are "pretty efficient particle collectors," said geophysicist Bernie Housen, of Western Washington University in Bellingham, Wash. Housen set out to see if this magnetic pollution could be detected on Bellingham’s leaves as well, and if there was a different between leaves of trees in busy city areas than in more rural ones.
Housen and his colleague Luigi Jovane collected several leaves from 15 Bigleaf Maple trees (Acer macrophyllum) in and around Bellingham in late June. Five of the trees were next to roads with busy bus routes; five sat on parallel, but quieter streets; five were in a nearby rural area. The leaves along the bus routes showed two to eight times more magnetism than those from the nearby quieter streets and four to 10 times more magnetism than leaves from rural areas.
The findings, presented last weekend at the meeting of the Geological Society of America, suggest that leaves could act as a simple, cost effective way to monitor pollution, Housen said. Monitoring particulate matter is important because of the danger it poses to human health. The tinier the particles are, the deeper they can penetrate into lungs, with consequences to health that include breathing and heart problems.
Posted by Glenn
[2] Comments
November 14-15, 2009
Air Temperatures – The following maximum temperatures were recorded across the state of Hawaii Saturday afternoon:
Lihue, Kauai – 81
Honolulu, Oahu – 86
Kaneohe, Oahu – 86
Kaunakakai, Molokai – 87
Kahului, Maui – 85
Hilo, Hawaii – 78
Kailua-kona – 88
Air Temperatures ranged between these warmest and coolest spots near sea level around the state – and on the highest mountains…at 4pm Saturday afternoon:
Kailua-kona – 83F
Hilo, Hawaii – 72
Haleakala Crater – 48 (near 10,000 feet on Maui)
Mauna Kea summit – 34 (near 14,000 feet on the Big Island)
Precipitation Totals – The following numbers represent the largest precipitation totals (inches) during the last 24 hours on each of the major islands, as of Saturday afternoon:
15.16 Mount Waialaele, Kauai – wow!
3.91 Oahu Forest NWR, Oahu
0.06 Molokai
0.00 Lanai
0.00 Kahoolawe
2.14 West Wailuaiki, Maui
6.50 Pahoa, Big Island
Marine Winds – Here’s the latest (automatically updated) weather map showing a 1030 millibar high pressure system far to the northeast of the islands. Winds will be locally strong and gusty from the trade wind direction through the weekend…into the new week ahead.
Satellite and Radar Images: To view the cloud conditions we have here in Hawaii, please use the following satellite links, starting off with this Infrared Satellite Image of the islands to see all the clouds around the state during the day and night. This next image is one that gives close images of the islands only during the daytime hours, and is referred to as a Close-up visible image. This next image shows a larger view of the Pacific…giving perspective to the wider ranging cloud patterns in the Pacific Ocean. Finally, here’s a Looping IR satellite image, making viewable the clouds around the islands 24 hours a day. To help you keep track of where any showers may be around the islands, here’s the latest animated radar image.
Hawaii’s Mountains – Here’s a link to the live webcam on the summit of near 14,000 foot Mauna Kea on the Big Island of Hawaii. The tallest peak on the island of Maui is the Haleakala Crater, which is near 10,000 feet in elevation. These two webcams are available during the daylight hours here in the islands…and when there’s a big moon rising just after sunset for an hour or two! Plus, during the nights and early mornings you will be able to see stars, and the sunrise too…depending upon weather conditions.
Tropical Cyclone activity in the eastern and central Pacific – Here’s the latest weather information coming out of the National Hurricane Center, covering the eastern north Pacific. You can find the latest tropical cyclone information for the central north Pacific (where Hawaii is located) by clicking on this link to the Central Pacific Hurricane Center. Here’s a tracking map covering both the eastern and central Pacific Ocean. A satellite image, which shows the entire ocean area between Hawaii and the Mexican coast…can be found here.
Aloha Paragraphs
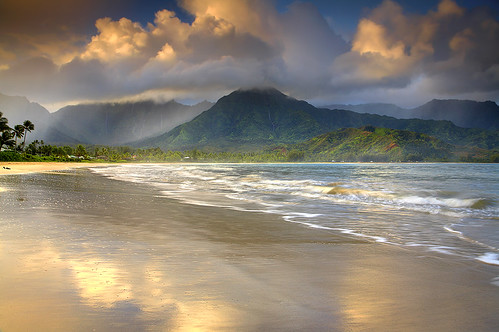
Hanalei, Kauai
The atmosphere over the islands continues to have the threat of isolated heavy precipitation Saturday evening. There may continue to be thunderstorms, which keeps the threat of localized heavy showers in the forecast. Thunderstorms are produced when we have unusually cold air aloft, and warm moist air near the surface…which we call an unstable atmosphere. This instability has kept our local air mass shower prone through the last several days, and continues into Sunday night. This satellite image, with its very large and broad view of the Pacific Ocean, shows the long lasting area of rainy clouds is still evident over and around the Hawaiian Islands.
The cause of this cloudiness continues to be the presence of an upper level low pressure system to the west of Kauai. If we take a closer look at the clouds around the islands, with a tighter focus…we see that most of the rainiest clouds were near Kauai and the Big Island of Hawaii. This looping radar image confirms that showers remain generally over the ocean Saturday. It wouldn’t take much movement for those rain bearing clouds to move over many of the islands in the chain however. Thus, the NWS forecast office in Honolulu is keeping the flash flood watch active through Saturday night…with localized flash flood warnings at times.
Meanwhile, the trade winds are blowing, and will continue to do so into the new work week ahead. High pressure to the northeast, and a surface low pressure system to the west, is the reason our trade winds are so breezy now. As this weather map shows, the high pressure cell is weighing-in at 1030 millibars Saturday evening. We have small craft wind advisories covering most of our marine environment, with our ocean conditions choppy. Looking at the observations Saturday evening, we see that the strongest gusts were reaching 38 mph at both Maalaea Bay on Maui, and South Point on the Big Island. These trade winds are expected to accelerate even more going forward…remaining active into at least the first part of the upcoming new work week.
Friday evening after work I went to see the new Michael Jackson film called This Is It (2009). This was my second viewing of this great film, as I saw it in northern California just last week. I’ve always appreciated MJ’s dancing and singing abilities very much. I rarely see a film twice, but I really couldn’t pass up the opportunity to see his talent displayed on the big screen for a second time. Here’s a trailer for the film. ~~~ Saturday morning I attended what’s called a zazenkai, or a Zen sitting meditation in Haiku. I’ve had a long standing meditation practice, starting in the early 1970’s in college…when I took a class called Beginners Mind Zazen. I begin my week days at 430am by sitting quietly for 30 minutes. ~~~ This evening I’ll be going to a party in lower Kula, for dinner and dancing. This party will be at my old friend Julie Claire Holmes home, the friend who I lost this past summer. I’m sure there will be lots of people there, and I look forward to the chance to visit with old and new friends alike. I’m especially looking forward to the dancing part of the event, as I’m still charged up in that department, after the Michael Jackson film last night! ~~~ I’ll be back Sunday morning with all the new updates, and to let you know how the party turned out. I hope you have a great Saturday night until then! Aloha for now…Glenn.
Interesting: There is water on the Moon, scientists stated unequivocally on Friday, and considerable amounts of it. “Indeed yes, we found water,” Anthony Colaprete, the principal investigator for NASA’s Lunar Crater Observation and Sensing Satellite, said in a news conference. The confirmation of scientists’ suspicions is welcome news both to future explorers who might set up home on the lunar surface and to scientists who hope that the water, in the form of ice accumulated over billions of years, could hold a record of the solar system’s history.
The satellite, known as Lcross (pronounced L-cross), slammed into a crater near the Moon’s south pole a month ago. The impact carved out a hole 60- to 100-feet wide and kicked up at least 24 gallons of water. “We got more than just whiff,” said Peter H. Schultz, a professor of geological sciences at Brown University and a co-investigator of the mission. “We practically tasted it with the impact.”
For more than a decade, planetary scientists have seen tantalizing hints of water ice at the bottom of these cold craters where the sun never shines. The Lcross mission consisted of two pieces — an empty rocket stage to carve into the lunar surface and a small spacecraft to measure what was kicked up, but it too slammed into the surface.
For space enthusiasts who stayed up, or woke up early, to watch the impact on Oct. 9, the event was anticlimactic, even disappointing, as they failed to see the anticipated debris plume. But NASA later said that a plume was indeed photographed; the live video stream was not properly attuned to pick out the details. The water findings come from analysis of the slight shifts in color after the impact, showing telltale signs of water.
Interesting2: Is there such a thing as "weather" on Mars? There are some doubts, considering the planet’s atmosphere is only 1 percent as dense as that of the Earth. Mars, however, definitely has clouds, drastically low temperatures and out-of-this-world dust storms. Istvan Szunyogh, a Texas A&M professor of atmospheric sciences, was recently awarded a NASA grant to analyze and forecast Martian weather. Mars is the most Earth-like planet we know, but it is still quite different. For example, it is much colder on Mars.
The south pole of the Earth is covered by water ice, but the south pole of Mars wears a dry ice (frozen carbon dioxide) cap. In winter, the temperature at the poles can dip to -220 degrees Fahrenheit, which is so cold that even carbon dioxide freezes. "Planet-encircling Martian dust storms, which occur every two to four Mars years, can cover the whole planet with dust for months," notes Szunyogh, who is working with colleagues from the University of Maryland and the Geophysical Fluid Dynamics Laboratory in Princeton, N.J., to forecast Martian weather.
Why care about weather on Mars? After all, nobody lives, works or goes to school there. "Martian weather forecasts, in the short term, can drastically increase the safety of landing robotic exploration missions," comments colleague Mark Lemmon, a Texas A&M professor of atmospheric sciences who has led or participated in many Mars exploratory events. "In the long run, it is indispensible for the safe returning of astronauts in future manned explorations.
"The two rovers currently working on Mars are solar-powered, and their lives end when their batteries run out," Lemmon adds. "Dust storms block the sun and shorten their battery life, and winds, on the other hand, can clear their solar panels so their batteries recharge faster." Weather forecasting is not tossing dice. It must build on solid data.
"All weather forecasts, including those on TV, are based on model forecasts of the different physical parameters of the Earth’s atmosphere such as temperature, wind and pressure," Szunyogh says. "The main goal of our project is to explore the possibility of obtaining accurate quantitative estimates of these parameters of the Martian atmosphere. "These parameters will be obtained from the available remotely sensed Martian observations," he adds. "Then the data can be fed into Mars global circulation models, producing Martian weather forecasts like what we have for Earth."
Interesting3: Spurred by a warming climate, daily record high temperatures occurred twice as often as record lows over the last decade across the continental United States, new research shows. The ratio of record highs to lows is likely to increase dramatically in coming decades if emissions of greenhouse gases continue to climb. "Climate change is making itself felt in terms of day-to-day weather in the United States," says Gerald Meehl, the lead author and a senior scientist at the National Center for Atmospheric Research (NCAR). "The ways these records are being broken show how our climate is already shifting."
The study, by authors at NCAR, Climate Central, The Weather Channel, and the National Oceanic and Atmospheric Administration (NOAA), has been accepted for publication in Geophysical Research Letters. It was funded by the National Science Foundation, NCAR’s sponsor, the Department of Energy, and Climate Central.
If temperatures were not warming, the number of record daily highs and lows being set each year would be approximately even. Instead, for the period from January 1, 2000, to September 30, 2009, the continental United States set 291,237 record highs and 142,420 record lows, as the country experienced unusually mild winter weather and intense summer heat waves.
A record daily high means that temperatures were warmer on a given day than on that same date throughout a weather station’s history. The authors used a quality control process to ensure the reliability of data from thousands of weather stations across the country, while looking at data over the past six decades to capture longer-term trends. This decade’s warming was more pronounced in the western United States, where the ratio was more than two to one, than in the eastern United States, where the ratio was about one-and-a-half to one.
The study also found that the two-to-one ratio across the country as a whole could be attributed more to a comparatively small number of record lows than to a large number of record highs. This indicates that much of the nation’s warming is occurring at night, when temperatures are dipping less often to record lows. This finding is consistent with years of climate model research showing that higher overnight lows should be expected with climate change.
Interesting4: Volcanic eruptions were responsible for a deadly ice age 450 million years ago, as well as — in an ironic twist — a period of global warming that preceded it, a new study finds. The finding underscores the importance of carbon in Earth’s climate today, said study researcher Matthew Saltzman of Ohio State University. The ancient ice age featured glaciers that covered the South Pole on top of the supercontinent of Gondwana (which would eventually break apart to form the present-day continents of the southern hemisphere).
Two-thirds of all species perished in the frigid climate. Previously, Saltzman and his team linked this same ice age, which took place in the Ordovician period, to the rise of the Appalachian Mountains. As the exposed rock weathered, chemical reactions pulled carbon from Earth’s atmosphere, causing the deadly global cooling.
With models, the researchers have now pieced together the other half of the story: Giant volcanoes that formed during the closing of the proto-Atlantic Ocean — known as the Iapetus Ocean — set the stage for the rise of the Appalachians and the ice age that followed. "Our model shows that these Atlantic volcanoes were spewing carbon into the atmosphere at the same time the Appalachians were removing it," Saltzman said.
"For nearly 10 million years, the climate was at a stalemate. Then the eruptions abruptly stopped, and atmospheric carbon levels fell well below what they were in the time before volcanism. That kicked off the ice age." To figure out this geologic history, Saltzman and his colleagues used computer models to draw together measurements of isotopes of chemical elements from rocks in Nevada, Virginia and Pennsylvania with measurements of volcanic ash beds in the same locations.
They also factored in temperature models developed by other scientists. The ash deposits demonstrated when the volcanoes stopped erupting, and the isotope measurements pinpointed the Appalachians as the source of the volcanic rock. The new findings mesh well with what scientists know about these ancient proto-Atlantic volcanoes, which are thought to have produced the largest eruptions in Earth’s history.
They issued enough lava to form the Appalachians, enough ash to cover the far ends of the earth, and enough carbon to heat the globe. Atmospheric carbon levels grew to levels 20 times higher than they are today. This study shows that when those volcanoes stopped erupting, carbon levels dropped, and the climate swung dramatically back to cold. The timing coincides with today’s best estimates of temperature fluctuations in the Ordovician.
Interesting5: Tiny particles of pollution that are harmful to human health stick to tree leaves and leave a trace magnetism, a new study finds. More pollution is found stuck to leaves of trees near busy roadways than those in less trafficked areas. The pollution-trapping leaves could serve as an easy, inexpensive way to monitor pollutant levels, researchers say.
Scientists in Europe first noticed that a type of pollution called particulate matter was sticking to leaves in industrial areas. Particulate matter is created by the combustion of fuel and can include many different compounds. The ones these scientists detected were metallic pollutants — such as iron oxides from diesel exhaust — that left a magnetic trace on the leaves (though the leaves themselves don’t become magnets).
The bumpy, wavy surfaces on the leaves easily trap the floating particles of pollution, which either remain stuck to the leaves surface or can even grow right into the leaf. The leaves are "pretty efficient particle collectors," said geophysicist Bernie Housen, of Western Washington University in Bellingham, Wash. Housen set out to see if this magnetic pollution could be detected on Bellingham’s leaves as well, and if there was a different between leaves of trees in busy city areas than in more rural ones.
Housen and his colleague Luigi Jovane collected several leaves from 15 Bigleaf Maple trees (Acer macrophyllum) in and around Bellingham in late June. Five of the trees were next to roads with busy bus routes; five sat on parallel, but quieter streets; five were in a nearby rural area. The leaves along the bus routes showed two to eight times more magnetism than those from the nearby quieter streets and four to 10 times more magnetism than leaves from rural areas.
The findings, presented last weekend at the meeting of the Geological Society of America, suggest that leaves could act as a simple, cost effective way to monitor pollution, Housen said. Monitoring particulate matter is important because of the danger it poses to human health. The tinier the particles are, the deeper they can penetrate into lungs, with consequences to health that include breathing and heart problems.
Posted by Glenn
[4] Comments
November 13-14, 2009
Air Temperatures – The following maximum temperatures were recorded across the state of Hawaii Friday afternoon:
Lihue, Kauai – 81
Honolulu, Oahu – 86
Kaneohe, Oahu – 86
Kaunakakai, Molokai – 87
Kahului, Maui – 85
Hilo, Hawaii – 72
Kailua-kona – 88
Air Temperatures ranged between these warmest and coolest spots near sea level around the state – and on the highest mountains…at 5pm Friday evening:
Kahului, Maui – 83F
Hilo, Hawaii – 74
Haleakala Crater – 46 (near 10,000 feet on Maui)
Mauna Kea summit – 34 (near 14,000 feet on the Big Island)
Precipitation Totals – The following numbers represent the largest precipitation totals (inches) during the last 24 hours on each of the major islands, as of Friday afternoon:
5.80 Kapahi, Kauai
5.41 Oahu Forest NWR, Oahu
0.04 Molokai
0.03 Lanai
0.05 Kahoolawe
5.83 Oheo Gulch, Maui
6.00 Hilo airport, Big Island
Marine Winds – Here’s the latest (automatically updated) weather map showing a 1032 millibar high pressure system far to the northeast of the islands. Winds will become strong and gusty from the trade wind direction into the weekend.
Satellite and Radar Images: To view the cloud conditions we have here in Hawaii, please use the following satellite links, starting off with this Infrared Satellite Image of the islands to see all the clouds around the state during the day and night. This next image is one that gives close images of the islands only during the daytime hours, and is referred to as a Close-up visible image. This next image shows a larger view of the Pacific…giving perspective to the wider ranging cloud patterns in the Pacific Ocean. Finally, here’s a Looping IR satellite image, making viewable the clouds around the islands 24 hours a day. To help you keep track of where any showers may be around the islands, here’s the latest animated radar image.
Hawaii’s Mountains – Here’s a link to the live webcam on the summit of near 14,000 foot Mauna Kea on the Big Island of Hawaii. The tallest peak on the island of Maui is the Haleakala Crater, which is near 10,000 feet in elevation. These two webcams are available during the daylight hours here in the islands…and when there’s a big moon rising just after sunset for an hour or two! Plus, during the nights and early mornings you will be able to see stars, and the sunrise too…depending upon weather conditions.
Tropical Cyclone activity in the eastern and central Pacific – Here’s the latest weather information coming out of the National Hurricane Center, covering the eastern north Pacific. You can find the latest tropical cyclone information for the central north Pacific (where Hawaii is located) by clicking on this link to the Central Pacific Hurricane Center. Here’s a tracking map covering both the eastern and central Pacific Ocean. A satellite image, which shows the entire ocean area between Hawaii and the Mexican coast…can be found here.
Aloha Paragraphs

Makena, Maui…Little beach – Big beach
Weather conditions have come together in such a way over the last couple of days, to bring about an inclement set of circumstances…in regards to rain and thunderstorm activity. There were many thunderstorms in action, with an exceptional amount of loud thunder and bright lightning flashes. Thunderstorms are produced when we have unusually cold air aloft, and warm moist air near the surface…which we call an unstable atmosphere. This instability has kept our local air mass shower prone enough, that a flash flood watch remains active Friday night. This satellite image, with its very large and broad view of the Pacific Ocean, shows that the focus of lots of clouds is still surrounding the Hawaiian Islands as we end our work week. This feature is a counterclockwise rotating low pressure system, now positioned to the west-southwest of the Hawaiian Islands.
If we tighten our view by using this next satellite image, we see all kinds of thunderstorms, and their associated heavy rainfall surrounding the Hawaiian Islands. This looping radar image confirms that showers remain generally over the ocean Friday evening. The islands didn’t get nearly as wet as what we saw on Thursday, at least not thus far. The heavy precipitation seems to be just about equal distances offshore from Kauai and Big Island at the time of this writing. Actually, I was somewhat surprised that the showers didn’t edge onshore in more places during the day Friday. The chance of localized heavy showers isn’t out of the question just yet…although it looks like we may be heading in that direction as we move into the weekend.
Looking ahead, as the upper low continues to move further west, the influence of the strong high pressure to our NE will kick in. As this weather map shows, this anticyclone is weighing in at 1032 millibars Friday evening, and moving generally eastward. As the high gets further east, and the aforementioned low pressure system heads west, our islands will find strengthening trade winds. We’ll find small craft wind advisories, with our ocean conditions becoming more choppy. Looking at the observations early Friday evening, we see that gusts were reaching 40 mph at Kahoolawe, and 39 mph at South Point on the Big Island. These trade winds are expected to accelerate even more going into the weekend…remaining active into at least the first part of the upcoming new work week.
These trade winds will begin carrying some of the moisture, brought up from the deeper tropics (by the low pressure system)…depositing it along our north and east facing windward coasts and slopes. If this happens as the models have been pointing out, we could see wet trade wind conditions prevailing through the next several days, or perhaps a bit longer. The leeward sides will continue to dry out, although as is often the case with strong and gusty trade winds blowing…some moisture may get carried across the islands into the south and west leeward beaches locally. There is light at the end of the tunnel however, as the threat of heavy rains and thunderstorms will be fading as we go forward. This change should have happened by the second part of this weekend, gradually bringing us back around to a fairly typical trade wind weather pattern with time.
Looking out the window here in Kihei, Maui, I see generally clear blue skies outside…as the sun sets into the Pacific Ocean. It’s been a rather exciting day or two, with still the outside chance that we’ll find some more showers arriving. As I noted above however, we are heading in the right direction, and should continue to see improvement going forward. The main change will be the strong and gusty trade winds, which will buffet the windward sides. The wind direction is very east now, so that the strongest winds will be felt most along those east facing shores…and slopes. ~~~ I’ve decided to go see the Michael Jackson film called This Is It (2009) again this evening, as I enjoyed it so much the first time around. Here’s a trailer for the film. ~~~ Saturday I’ll be attending what’s called a Zazenkai, or a morning of Zen sitting, meditation in Haiku. Then, later in the day, I’ll be going to a party in lower Kula, for a dinner and dance party, more about that later. ~~~ I’ll meet you back here early Saturday morning with the next new weather narrative from paradise. I hope you have a great Friday night until then! Aloha for now…Glenn.
Interesting: There is water on the Moon, scientists stated unequivocally on Friday, and considerable amounts of it. “Indeed yes, we found water,” Anthony Colaprete, the principal investigator for NASA’s Lunar Crater Observation and Sensing Satellite, said in a news conference. The confirmation of scientists’ suspicions is welcome news both to future explorers who might set up home on the lunar surface and to scientists who hope that the water, in the form of ice accumulated over billions of years, could hold a record of the solar system’s history.
The satellite, known as Lcross (pronounced L-cross), slammed into a crater near the Moon’s south pole a month ago. The impact carved out a hole 60- to 100-feet wide and kicked up at least 24 gallons of water. “We got more than just whiff,” said Peter H. Schultz, a professor of geological sciences at Brown University and a co-investigator of the mission. “We practically tasted it with the impact.”
For more than a decade, planetary scientists have seen tantalizing hints of water ice at the bottom of these cold craters where the sun never shines. The Lcross mission consisted of two pieces — an empty rocket stage to carve into the lunar surface and a small spacecraft to measure what was kicked up, but it too slammed into the surface.
For space enthusiasts who stayed up, or woke up early, to watch the impact on Oct. 9, the event was anticlimactic, even disappointing, as they failed to see the anticipated debris plume. But NASA later said that a plume was indeed photographed; the live video stream was not properly attuned to pick out the details. The water findings come from analysis of the slight shifts in color after the impact, showing telltale signs of water.
Interesting2: Is there such a thing as "weather" on Mars? There are some doubts, considering the planet’s atmosphere is only 1 percent as dense as that of the Earth. Mars, however, definitely has clouds, drastically low temperatures and out-of-this-world dust storms. Istvan Szunyogh, a Texas A&M professor of atmospheric sciences, was recently awarded a NASA grant to analyze and forecast Martian weather. Mars is the most Earth-like planet we know, but it is still quite different. For example, it is much colder on Mars.
The south pole of the Earth is covered by water ice, but the south pole of Mars wears a dry ice (frozen carbon dioxide) cap. In winter, the temperature at the poles can dip to -220 degrees Fahrenheit, which is so cold that even carbon dioxide freezes. "Planet-encircling Martian dust storms, which occur every two to four Mars years, can cover the whole planet with dust for months," notes Szunyogh, who is working with colleagues from the University of Maryland and the Geophysical Fluid Dynamics Laboratory in Princeton, N.J., to forecast Martian weather.
Why care about weather on Mars? After all, nobody lives, works or goes to school there. "Martian weather forecasts, in the short term, can drastically increase the safety of landing robotic exploration missions," comments colleague Mark Lemmon, a Texas A&M professor of atmospheric sciences who has led or participated in many Mars exploratory events. "In the long run, it is indispensible for the safe returning of astronauts in future manned explorations.
"The two rovers currently working on Mars are solar-powered, and their lives end when their batteries run out," Lemmon adds. "Dust storms block the sun and shorten their battery life, and winds, on the other hand, can clear their solar panels so their batteries recharge faster." Weather forecasting is not tossing dice. It must build on solid data.
"All weather forecasts, including those on TV, are based on model forecasts of the different physical parameters of the Earth’s atmosphere such as temperature, wind and pressure," Szunyogh says. "The main goal of our project is to explore the possibility of obtaining accurate quantitative estimates of these parameters of the Martian atmosphere. "These parameters will be obtained from the available remotely sensed Martian observations," he adds. "Then the data can be fed into Mars global circulation models, producing Martian weather forecasts like what we have for Earth."
Interesting3: Spurred by a warming climate, daily record high temperatures occurred twice as often as record lows over the last decade across the continental United States, new research shows. The ratio of record highs to lows is likely to increase dramatically in coming decades if emissions of greenhouse gases continue to climb. "Climate change is making itself felt in terms of day-to-day weather in the United States," says Gerald Meehl, the lead author and a senior scientist at the National Center for Atmospheric Research (NCAR). "The ways these records are being broken show how our climate is already shifting."
The study, by authors at NCAR, Climate Central, The Weather Channel, and the National Oceanic and Atmospheric Administration (NOAA), has been accepted for publication in Geophysical Research Letters. It was funded by the National Science Foundation, NCAR’s sponsor, the Department of Energy, and Climate Central.
If temperatures were not warming, the number of record daily highs and lows being set each year would be approximately even. Instead, for the period from January 1, 2000, to September 30, 2009, the continental United States set 291,237 record highs and 142,420 record lows, as the country experienced unusually mild winter weather and intense summer heat waves.
A record daily high means that temperatures were warmer on a given day than on that same date throughout a weather station’s history. The authors used a quality control process to ensure the reliability of data from thousands of weather stations across the country, while looking at data over the past six decades to capture longer-term trends. This decade’s warming was more pronounced in the western United States, where the ratio was more than two to one, than in the eastern United States, where the ratio was about one-and-a-half to one.
The study also found that the two-to-one ratio across the country as a whole could be attributed more to a comparatively small number of record lows than to a large number of record highs. This indicates that much of the nation’s warming is occurring at night, when temperatures are dipping less often to record lows. This finding is consistent with years of climate model research showing that higher overnight lows should be expected with climate change.
Interesting4: Volcanic eruptions were responsible for a deadly ice age 450 million years ago, as well as — in an ironic twist — a period of global warming that preceded it, a new study finds. The finding underscores the importance of carbon in Earth’s climate today, said study researcher Matthew Saltzman of Ohio State University. The ancient ice age featured glaciers that covered the South Pole on top of the supercontinent of Gondwana (which would eventually break apart to form the present-day continents of the southern hemisphere).
Two-thirds of all species perished in the frigid climate. Previously, Saltzman and his team linked this same ice age, which took place in the Ordovician period, to the rise of the Appalachian Mountains. As the exposed rock weathered, chemical reactions pulled carbon from Earth’s atmosphere, causing the deadly global cooling.
With models, the researchers have now pieced together the other half of the story: Giant volcanoes that formed during the closing of the proto-Atlantic Ocean — known as the Iapetus Ocean — set the stage for the rise of the Appalachians and the ice age that followed. "Our model shows that these Atlantic volcanoes were spewing carbon into the atmosphere at the same time the Appalachians were removing it," Saltzman said.
"For nearly 10 million years, the climate was at a stalemate. Then the eruptions abruptly stopped, and atmospheric carbon levels fell well below what they were in the time before volcanism. That kicked off the ice age." To figure out this geologic history, Saltzman and his colleagues used computer models to draw together measurements of isotopes of chemical elements from rocks in Nevada, Virginia and Pennsylvania with measurements of volcanic ash beds in the same locations.
They also factored in temperature models developed by other scientists. The ash deposits demonstrated when the volcanoes stopped erupting, and the isotope measurements pinpointed the Appalachians as the source of the volcanic rock. The new findings mesh well with what scientists know about these ancient proto-Atlantic volcanoes, which are thought to have produced the largest eruptions in Earth’s history.
They issued enough lava to form the Appalachians, enough ash to cover the far ends of the earth, and enough carbon to heat the globe. Atmospheric carbon levels grew to levels 20 times higher than they are today. This study shows that when those volcanoes stopped erupting, carbon levels dropped, and the climate swung dramatically back to cold. The timing coincides with today’s best estimates of temperature fluctuations in the Ordovician.
Interesting5: Tiny particles of pollution that are harmful to human health stick to tree leaves and leave a trace magnetism, a new study finds. More pollution is found stuck to leaves of trees near busy roadways than those in less trafficked areas. The pollution-trapping leaves could serve as an easy, inexpensive way to monitor pollutant levels, researchers say.
Scientists in Europe first noticed that a type of pollution called particulate matter was sticking to leaves in industrial areas. Particulate matter is created by the combustion of fuel and can include many different compounds. The ones these scientists detected were metallic pollutants — such as iron oxides from diesel exhaust — that left a magnetic trace on the leaves (though the leaves themselves don’t become magnets).
The bumpy, wavy surfaces on the leaves easily trap the floating particles of pollution, which either remain stuck to the leaves surface or can even grow right into the leaf. The leaves are "pretty efficient particle collectors," said geophysicist Bernie Housen, of Western Washington University in Bellingham, Wash. Housen set out to see if this magnetic pollution could be detected on Bellingham’s leaves as well, and if there was a different between leaves of trees in busy city areas than in more rural ones.
Housen and his colleague Luigi Jovane collected several leaves from 15 Bigleaf Maple trees (Acer macrophyllum) in and around Bellingham in late June. Five of the trees were next to roads with busy bus routes; five sat on parallel, but quieter streets; five were in a nearby rural area. The leaves along the bus routes showed two to eight times more magnetism than those from the nearby quieter streets and four to 10 times more magnetism than leaves from rural areas.
The findings, presented last weekend at the meeting of the Geological Society of America, suggest that leaves could act as a simple, cost effective way to monitor pollution, Housen said. Monitoring particulate matter is important because of the danger it poses to human health. The tinier the particles are, the deeper they can penetrate into lungs, with consequences to health that include breathing and heart problems.
Posted by Glenn
[5] Comments
November 12-13, 2009
Air Temperatures – The following maximum temperatures were recorded across the state of Hawaii Thursday afternoon:
Lihue, Kauai – 81
Honolulu, Oahu – 84
Kaneohe, Oahu – 82
Kaunakakai, Molokai – 83
Kahului, Maui – 83
Hilo, Hawaii – 83
Kailua-kona – 82
Air Temperatures ranged between these warmest and coolest spots near sea level around the state – and on the highest mountains…at 5pm Thursday evening:
Barking Sands, Kauai – 83F
Hilo, Hawaii – 72
Haleakala Crater – 43 (near 10,000 feet on Maui)
Mauna Kea summit – 32 (near 14,000 feet on the Big Island)
Precipitation Totals – The following numbers represent the largest precipitation totals (inches) during the last 24 hours on each of the major islands, as of Thursday afternoon:
0.41 Kokee, Kauai
0.16 Hakipuu Mauka, Oahu
0.00 Molokai
0.00 Lanai
0.01 Kahoolawe
0.24 Kahakuloa, Maui
1.78 Hilo airport, Big Island
Marine Winds – Here’s the latest (automatically updated) weather map showing a strong 1036 millibar high pressure system far to the north-northeast of the islands. Winds will veer from the southeast…with returning easterly trade winds into the weekend.
Satellite and Radar Images: To view the cloud conditions we have here in Hawaii, please use the following satellite links, starting off with this Infrared Satellite Image of the islands to see all the clouds around the state during the day and night. This next image is one that gives close images of the islands only during the daytime hours, and is referred to as a Close-up visible image. This next image shows a larger view of the Pacific…giving perspective to the wider ranging cloud patterns in the Pacific Ocean. Finally, here’s a Looping IR satellite image, making viewable the clouds around the islands 24 hours a day. To help you keep track of where any showers may be around the islands, here’s the latest animated radar image.
Hawaii’s Mountains – Here’s a link to the live webcam on the summit of near 14,000 foot Mauna Kea on the Big Island of Hawaii. The tallest peak on the island of Maui is the Haleakala Crater, which is near 10,000 feet in elevation. These two webcams are available during the daylight hours here in the islands…and when there’s a big moon rising just after sunset for an hour or two! Plus, during the nights and early mornings you will be able to see stars, and the sunrise too…depending upon weather conditions.
Tropical Cyclone activity in the eastern and central Pacific – Here’s the latest weather information coming out of the National Hurricane Center, covering the eastern north Pacific. You can find the latest tropical cyclone information for the central north Pacific (where Hawaii is located) by clicking on this link to the Central Pacific Hurricane Center. Here’s a tracking map covering both the eastern and central Pacific Ocean. A satellite image, which shows the entire ocean area between Hawaii and the Mexican coast…can be found here.
Aloha Paragraphs
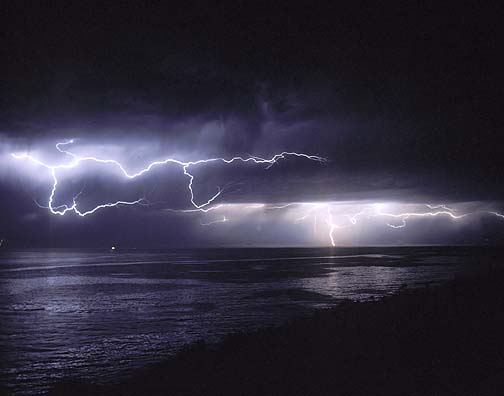
Heavy showers and thunderstorms into Friday
A complicated weather pattern has unfolded across the Aloha state Thursday, with lots of cold air aloft. In addition, we have tropical moisture streaming north and westward across the islands, feeding heavy rainfall locally. The islands have finally seen some of the well advertised generous precipitation. This satellite image shows the big picture, with all the thunderstorms around now. This satellite image shows a closer look at that those thunderstorms roaming around all of the islands…as we head into the night hours. This looping radar image shows lots of precipitation embedded in these clouds, over our islands as well.
This cold air has triggered snowfall for the Big Island summits, which may become heavy Thursday night. This translates to an unstable atmosphere over all of the Hawaiian Islands. Cold air above and warm air being brought in on the southeast to easterly winds at the surface…gives clouds a definite vertical lift. This is just what the clouds need in order to produce locally heavy rains, and or thunderstorms. Thus, the statewide flash flood watch continues! Looking at this weather map, we see a stronger than usual 1036 millibar high pressure system north-northeast of us. At the same time, we find a gale low pressure (L) system to the west of Kauai. As this low moves further westward, as the red arrow indicates, we’ll see the current south to southeast winds giving way to strong trade winds…first on the Big Island and then Maui.
This shift in wind direction will have a rather definite impact on our rainfall. Starting Friday, at least on the Big Island and Maui side of the state, the winds will shift to the east and ENE. This will bring rainy clouds to the windward sides, and those areas will remain on the wet side through the weekend…perhaps into the first day or two of next week even. As the upper low moves westward it will eventually lose its influence here, with the threat of heavy rain diminishing. The first areas to prosper from this will be the leeward sides, with time. Those returning trade winds into the weekend, are forecast to be strong and gusty. All this wind has already sparked large waves on our east and north shores. The surf is large enough to warrant high surf advisories and warnings now. It will likely take until next week to bring back our more favorably inclined weather circumstances…during this autumn period.
There’s lots of action around the Hawaiian Islands as we move into Thursday night. If you had a chance to check out the satellite image above, you see that there are an exceptional amount of rainy clouds around. We’re not through with the rain yet, with still that chance of flooding rainfall into Friday. Here’s a good looping satellite image showing all the dynamics around the Hawaiian Islands. Be careful when you’re out driving, as roads are dangerous where those heavy downpours occur. As we move into the weekend, the focus for showers will move over to the windward sides. The trade winds are expected to become strong and gusty starting later Friday into Saturday and Sunday. These trades will carry lots of showers our way, although the leeward sides, at least in some places, will find less threat of showers then. We can look forward to better weather after the weekend. ~~~ By the way, it finally started snowing atop Mauna Kea on the Big Island…according to all the ice and snow on the camera lens on this current webcam picture…viewable during the light of day. ~~~ I’m just now leaving Kihei, and I’m getting reports of lots of lightning and thunder around now, which I can’t wait to witness first hand. I’ll catch up with you later depending upon what all comes down over the next few hours, or…certainly by early Friday morning. ~~~ Oh my gosh, when I got home it has been thundering and lightning like crazy! I just heard the most magnificent clap(s) of thunder I can remeber in a long time. Wow!! I hope you have a great Thursday night! Aloha for now…Glenn.
Interesting: You don’t have to look far to see just how much concrete humans use. Everything from highways to high-rise and bridges to runways around the world are made with the energy-intensive, carbon-spewing material. Contributing at least 5 percent of global carbon dioxide (CO2) emissions, the cement industry is ripe for changes to lower its impact. Cement, the glue that binds concrete, is one of the most carbon-intensive materials out there: It produces one ton of CO2 for every ton of cement made.
The main culprit responsible for the industry’s emissions is Portland cement, the most commonly used type of cement, which is created through an energy-intensive process of crushing raw materials and heating them to up to 3,000 degrees Fahrenheit. Many companies are reducing the amount of Portland cement needed in concrete by replacing some of it with fly ash, a byproduct of coal-fired power plants. In addition to eliminating some of the emissions and raw materials associated with Portland cement, fly ash makes concrete stronger and easier to work with.
Interesting2: Ken Salazar, Secretary of the Interior, Assistant Secretary for Fish and Wildlife and Parks Tom Strickland, and U.S. Fish and Wildlife Service Director Sam Hamilton announced that the brown pelican, a species once decimated by the pesticide DDT, has recovered and is being removed from the list of threatened and endangered species under the Endangered Species Act. The brown pelican was first declared endangered in 1970. Since then, thanks to a ban on DDT and efforts by states, conservation organizations, private citizens and many other partners, the bird has recovered. There are now more than 650,000 brown pelicans found across Florida and the Gulf and Pacific Coasts, as well as in the Caribbean and Latin America.
"After being hunted for its feathers, facing devastating effects from the pesticide DDT and suffering from widespread coastal habitat loss, the pelican has made a remarkable recovery," Strickland said at a press conference in New Orleans to announce the delisting. "We once again see healthy flocks of pelicans in the air over our shores." The pelican’s recovery is largely due to the federal ban on the general use of the pesticide DDT in 1972.
This action was taken after former U.S. Fish and Wildlife Service biologist Rachel Carson published Silent Spring and alerted the nation to the widespread dangers associated with unrestricted pesticide use. In the southwest, the Texas Parks and Wildlife Department, The Nature Conservancy and numerous other conservation organizations helped purchase important nesting sites and developed monitoring programs to ensure pelican rookeries were thriving.
Louisiana, long known as the "pelican state," and the Florida Game and Fresh Water Fish Commission jointly implemented a restoration project. A total of 1,276 young pelicans were captured in Florida and released at three sites in southeastern Louisiana during the 13 years of the project. Past efforts to protect the brown pelican actually led to the birth of the National Wildlife Refuge System more than a century ago in central Florida. German immigrant Paul Kroegel, appalled by the indiscriminate slaughter of pelicans for their feathers, approached President Theodore Roosevelt.
This led Roosevelt to create the first National Wildlife Refuge at Pelican Island in 1903, when Kroegel was named the first refuge manager. Today, the system has grown to 550 national wildlife refuges, many of which have played key roles in the recovery of the brown pelican.
Interesting3: Australia’s koalas could be wiped out within 30 years unless urgent action is taken to halt a decline in population, according to researchers. Development, climate change and bushfires have all combined to send the numbers of wild koalas plummeting. A recent survey showed the population could have dropped by more than half in the past six years. Previous estimates put the number of koalas at more than 100,000 – but the latest calculations suggest there could now be as few as 43,000.
In one area in northern Queensland estimated to have 20,000 koalas a decade ago, a team of eight people could not find a single animal in four days of searching. As well as problems caused by deforestation, hotter, drier conditions attributed to global warming had reduced the nutritional value of their staple food, eucalyptus leaves, leading to malnutrition. Many have been killed by the sexually transmitted disease chlamydia.
Interesting4: Georgia Tech City and Regional Planning Professor Brian Stone is publishing a paper in the December edition of Environmental Science and Technology that suggests policymakers need to address the influence of global deforestation and urbanization on climate change, in addition to greenhouse gas emissions. According to Stone’s paper, as the international community meets in Copenhagen in December to develop a new framework for responding to climate change, policymakers need to give serious consideration to broadening the range of management strategies beyond greenhouse gas reductions alone.
"Across the U.S. as a whole, approximately 50 percent of the warming that has occurred since 1950 is due to land use changes (usually in the form of clearing forest for crops or cities) rather than to the emission of greenhouse gases," said Stone. "Most large U.S. cities, including Atlanta, are warming at more than twice the rate of the planet as a whole — a rate that is mostly attributable to land use change. As a result, emissions reduction programs — like the cap and trade program under consideration by the U.S. Congress — may not sufficiently slow climate change in large cities where most people live and where land use change is the dominant driver of warming."
Interesting5: Exposure to air pollution can damage newborns’ lungs and assault their immune systems, making babies more vulnerable to disease. Chronic exposure to air pollution, the study found, increases a baby’s chance of developing bronchiolitis — a lung infection that is the most common cause of hospitalizations in the first year of life. The findings suggest that parents and pediatricians need to work together to reduce infants’ exposure to traffic and other sources of dirty air, said study author Catherine Karr, an academic pediatrician at the University of Washington, Seattle. That’s true no matter where families live, she added.
Interesting6: The United States, Canada, and Mexico agreed this week to work together to protect wilderness areas across North America. The cooperation agreement establishes an intergovernmental committee to exchange research and approaches that address challenges such as climate change, fire control, and invasive species in land, marine, and coastal protected areas throughout the continent.
"This agreement will allow for the exchange of successful experiences, monitoring, and training of human resources, as well as the financing of projects that will protect and recover wild areas," said Mexican President Felipe Calderón at the opening ceremony of the Ninth World Wilderness Congress in Mérida, Mexico.
The three nations have long cooperated on wilderness management – programs have straddle the U.S.-Canadian border since 1910 and the U.S.-Mexican border since the 1930s. Yet the memorandum of understanding is the first multinational agreement on wilderness protection, according to Vance Martin, president of the Wild Foundation.
Interesting7: Just months – that’s how long it took for Europe to be engulfed by an ice age. The scenario, which comes straight out of Hollywood blockbuster The Day After Tomorrow, was revealed by the most precise record of the climate from palaeohistory ever generated. Around 12,800 years ago the northern hemisphere was hit by the Younger Dryas mini ice age, or "Big Freeze". It was triggered by the slowdown of the Gulf Stream, led to the decline of the Clovis culture in North America, and lasted around 1300 years.
Until now, it was thought that the mini ice age took a decade or so to take hold, on the evidence provided by Greenland ice cores. Not so, say William Patterson of the University of Saskatchewan in Saskatoon, Canada, and his colleagues. The group studied a mud core from an ancient lake, Lough Monreagh, in western Ireland. Using a scalpel they sliced off layers 0.5 to 1 millimetre thick, each representing up to three months of time. No other measurements from the period have approached this level of detail.
Carbon isotopes in each slice revealed how productive the lake was and oxygen isotopes gave a picture of temperature and rainfall. They show that at the start of the Big Freeze, temperatures plummeted and lake productivity stopped within months, or a year at most. "It would be like taking Ireland today and moving it up to Svalbard" in the Arctic, says Patterson, who presented the findings at the BOREAS conference in Rovaniemi, Finland, on 31 October.
"This is significantly shorter than what has been suggested before, but it is plausible," says Derek Vance of the University of Bristol, UK. Hans Renssen, a climate researcher at Vrije University in Amsterdam, the Netherlands, says recent findings from Greenland ice cores indicate the Younger Dryas event may have happened in one to three years. Patterson’s results confirm this was a very sudden change, he says. The mud slices from the end of the Big Freeze show that it took around two centuries for the lake and climate to recover.
Posted by Glenn
[4] Comments
November 11-12, 2009
Air Temperatures – The following maximum temperatures were recorded across the state of Hawaii Wednesday afternoon:
Lihue, Kauai – 77
Honolulu, Oahu – 83
Kaneohe, Oahu – 79
Kaunakakai, Molokai – 78
Kahului, Maui – 83
Hilo, Hawaii – 84
Kailua-kona – 83
Air Temperatures ranged between these warmest and coolest spots near sea level around the state – and on the highest mountains…at 4pm Wednesday afternoon:
Kailua-kona – 82F
Hilo, Hawaii – 72
Haleakala Crater – 32 (near 10,000 feet on Maui)
Mauna Kea summit – 34 (near 14,000 feet on the Big Island)
Precipitation Totals – The following numbers represent the largest precipitation totals (inches) during the last 24 hours on each of the major islands, as of Wednesday afternoon:
3.05 Mount Waialaele, Kauai
2.37 Oahu Forest NWR, Oahu
2.22 Molokai
0.00 Lanai
0.00 Kahoolawe
2.15 West Wailuaiki, Maui
0.84 Glenwood, Big Island
Marine Winds – Here’s the latest (automatically updated) weather map showing a very strong 1039 millibar high pressure system far to the north of the islands. Winds will be northeast, and locally strong and gusty, gradually becoming lighter from the southeast…then returning easterly trade winds this coming weekend.
Satellite and Radar Images: To view the cloud conditions we have here in Hawaii, please use the following satellite links, starting off with this Infrared Satellite Image of the islands to see all the clouds around the state during the day and night. This next image is one that gives close images of the islands only during the daytime hours, and is referred to as a Close-up visible image (not currently working). This next image shows a larger view of the Pacific…giving perspective to the wider ranging cloud patterns in the Pacific Ocean. Finally, here’s a Looping IR satellite image, making viewable the clouds around the islands 24 hours a day. To help you keep track of where any showers may be around the islands, here’s the latest animated radar image.
Hawaii’s Mountains – Here’s a link to the live webcam on the summit of near 14,000 foot Mauna Kea on the Big Island of Hawaii. The tallest peak on the island of Maui is the Haleakala Crater, which is near 10,000 feet in elevation. These two webcams are available during the daylight hours here in the islands…and when there’s a big moon rising just after sunset for an hour or two! Plus, during the nights and early mornings you will be able to see stars, and the sunrise too…depending upon weather conditions.
Tropical Cyclone activity in the eastern and central Pacific – Here’s the latest weather information coming out of the National Hurricane Center, covering the eastern north Pacific. You can find the latest tropical cyclone information for the central north Pacific (where Hawaii is located) by clicking on this link to the Central Pacific Hurricane Center. Here’s a tracking map covering both the eastern and central Pacific Ocean. A satellite image, which shows the entire ocean area between Hawaii and the Mexican coast…can be found here.
Aloha Paragraphs

Hawaiian Rain Forest
Low pressure aloft and at the surface, will keep our weather unstable through the next several days. The main concern is for locally heavy precipitation, as cold air aloft destabilizes the air mass surrounding the Hawaiian Islands. Cold air above, with warm moist air below, is a definite recipe for potential flooding rainfall. All the ingredients remain in place to bring off and on showers…some of which could be of the flooding variety. Some of these clouds may attain very high tops, which brings in the possibility of thunderstorms too. Speaking of high level, here’s a webcam view of Mauna Kea on the Big Island, which may see its first significant snowfall of the autumn season over the next several days.
The latest satellite imagery shows lots of rainy clouds around…mostly over the ocean at the time of this writing. The most active areas Wednesday evening were to the north of all the islands. This IR satellite picture shows all the clouds, the closest of which were nearing the north shore of Kauai. Rainfall was generous over many areas of the Aloha state Tuesday night, although had backed off quite a bit during the day Wednesday. As mentioned above however, everything is still in place to produce more rainfall. A trough of low pressure will move through the state, from the west to the east, which will keep the overlying atmosphere shower prone going forward.
The latest computer models definitely show a rather prolonged period of off and on showers…some potentially heavy. Many areas around the state will get wet, although it will be hit and miss most of the time. At this point it’s difficult to know exactly when we might find completely dry weather returning to our islands. As the trough of low pressure, now over the Maui and Big Island end of the state moves west, rainfall will remain generous at times. Speaking of showers or rain, here’s a looping radar image, which will show us where the heavy precipitation is falling. As this trough moves through, and ends up to the west of the state, the our winds will come up from the southeast. This weekend our winds will turn back to easterly, likely carrying showers to the windward sides, keeping those areas at times soggy…although the leeward sides should begin to dry out then.
The state remains full of NWS issued advisories and warnings Wednesday evening. We find an active flash flood watch for the entire state; a flood advisory for the Big Island; a gale warning over the offshore waters; a winter weather advisory for the summits on the Big Island; a small craft warning for winds over the Niihau and Kauai waters; a wind advisory over the islands of Niihau and Kauai; and finally high surf advisories and warnings for our east facing shores. We have to remember that we’re in the month of November, which sometimes does become rather stormy at times. November is one of the months of the year that qualify as part of the rainy season in our islands.
It’s partly cloudy here in Kula, Maui, as we approach the sunset hour. Despite all the low pressure surrounding the islands, we haven’t had all that much rain during the day Wednesday. The satellite image above shows lots of clouds to our north through northeast. The looping radar image however shows a lack of showers, or at least not many, generally falling over the ocean this evening. A trough of low pressure over Maui shows the counterclockwise air circulation over the islands. This trough will be moving westward, with moist southeast winds filling in behind it. This could conceivably carry volcanic haze up over the island chain with time. ~~~ I lazed around this morning, finally getting myself out the door and down to Baldwin Beach. It was really nice down there, with rising surf breaking on the outer reefs. I sat watching the people, and the clouds and ocean for quite a while, before finally jumping in the rough ocean. I went shopping, and then high-tailed it back home, where I’ve been lazing around again. I’m still tired from my three week travels in California. I have Thursday and Friday at work in Kihei, and then it will be the weekend. I’ll be back online early Thursday morning with your next new weather narrative. I hope you have a great Wednesday night until then! Aloha for now…Glenn.
By the way, if you left a response on this page lately, and don’t see it, and can’t see my reply back, please go to the Archived Narratives on the left hand side of this page. You will find yesterday’s page, and actually go back through over 1000 of the last narratives I’ve written. Be sure to click on View All on the top of the list, to see the entire list of replies and responses. If you have any trouble finding that, please let me know.
I’ll leave the details of my recent vacation up for one more day:
October 20-21 – Hi everyone, I made it, flew into the San Francisco airport, with its wet runways Monday night. The lady at the Kahului airport, Karen, moved my seat up from 46A to 16A, with endless leg room and a window…which was a great start to my trip. I took the Marin Airporter to my friend’s house, where I found homemade soup, toast and cheese waiting. She had a Pumpkin ale to wash that down with, before I went to bed. Yesterday we started off our day with a nice walk, breakfast, coffee, and watched Democracy Now with Amy Goodman on the television. Later in the day we took a nice long walk into Baltimore Canyon, filled with Redwood trees…and a nice running creek. Finished off the day with wine on the deck to sunset. I slept wonderfully last night, and woke early, ready to start off my second day of vacation. ~~~ Today, Wednesday, we started off with a nice walk, then back home for breakfast. Today’s longer hike was into Tennessee Valley, a great walk down to the ocean. We had a wonderful Mexican food late lunch, before going to Whole Foods for shopping. I love that market, which has everything that I enjoy eating. One of our old friends will join us for dinner this evening, with good conversations guaranteed! Having a fabulous trip so far, and then on Friday will fly down to Long Beach for almost a week with my parents and family. I’ll catch up with you again soon, hope you are doing well. Aloha, Glenn.
October 22-23 Hi again, I had a fabulous day yesterday, starting off with the traditional early walk, this time down to a marsh, under low clouds and fog. Had a couple of eggs that we had bought at a local farmers market, along with potatoes, and toast for breakfast…and of course espresso too. We watched Democracy Now on TV, which is something my friend Linda enjoys most mornings. I like the program, but sometimes feel a little bogged down with all the stuff going on in the world, of which…I’d prefer not to know so much about. We ended up at Tennessee Valley again, walking all the way down to the ocean, where there was an active high surf advisory along the coast. The waves were large and powerful. We took off our shoes, and ran around some on the sand. Being more experienced in such conditions, I was the one responsible for telling Linda when to run back, so we didn’t get wet. We drove back to her house, for another wine and sunset, end to the day. ~~~ Today is Friday, and I took the Marin Airporter down to the San Francisco airport, for a short one hour flight down to Long Beach. My Mom picked me up, and I ended up visiting with her and my Dad during the afternoon. My brother Steve flies in from Texas just after 6pm, and I’ll go pick him up. I’m sure this will be a great family reunion, I’ll come back and let you know what’s going on in a couple of days. Aloha, Glenn
October 24-28 Good morning, it’s been a while since I’ve had a chance to sit down and write a few words. The reason…work! Oh yeah, my brother and I have been working our way through a long list of things to do at my parents house. He and I start off our days around 630am, jumping in my Mom’s car, and cruizing over to the coffee place my brother likes to get a cup of coffee to go. Then, it’s over to the donut shop that he picks up pasteries for my parents, and yes…I’ve been indulging some too. We then check the list, go to the store and buy building materials and stuff, and come back for a day of work. He and I are both used to working, so it’s good that we have something to do. At night we all sit around the living room, eating our dinners on TV trays, watching Monday night football, or whatever’s on that particular evening. ~~~ Since I last wrote we had a big family reunion at my sisters daughters house, which was fun. Since my brother and I leave tomorrow, we’re having everyone over again today. This morning Steve and I drove up to the top of Signal Hill and watched the sun rise over the mountains surrounding the LA basin. We’ll be finishing up our work this morning, before everyone comes over for lunch. ~~~ Steve flies back to Texas Thursday, and I fly up to San Francisco…where my good friend Bob will pick me up, then driving up to Linda’s house in Marin County. Bob and I take off up the coast from there, where we’ve rented a place right on a bluff over looking the ocean…located between Gualala and Point Arena. This rental has an outdoor hot tub overlooking the ocean, along with a big stone fireplace, which will be a treat. I’ll catch up with you at some point over the next week or so. Be well until then, Aloha, Glenn.
October 29-November 3 I had a great time being with my Mom, Dad, two sisters, and brother in southern California. I love each of them, and enjoyed our time together. Wow, the best of the best, that’s how I could describe the time between when I last wrote…and now! I flew back up to Marin from Long Beach, and my best friend Bob picked me up, and from there the word fun kicked in big time. The first evening we went out to eat at a place in Larkspur called Left Bank, which served up good eats. The next morning we started off the day early by hiking through the Tennessee Valley, a nice valley down to the ocean. Later that morning Bob and I jumped in his Toyota Prius and headed north on Highway 101. We headed towards the coast by getting off in Cotati, and driving to Sebastopol. Bob and I both went to Sonoma State University in that general area, where we were deeply involved in Geography and Meteorology. We sat around in the warm sun outside the Whole Foods store there, and enjoyed seeing the people walking by. Someone saw the T-shirt I was wearing, which said Hana, Maui on it, which often triggered conversations about the islands. We took the drive out through Guerneville to Jenner, following alongside the Russian River. We finally made it to our vacation rental called Moonstar, which was absolutely perfect!
~~~ Bob had one entire side of this great house, while I took up residence in the other. I was always the first one up in the morning, getting out to the hot tub well before sunrise. It happened to be full moon while we were visiting Moonstar, which was so cool. At any rate, we headed north for breakfast in Point Arena that first morning, after which we drove north to the Russian Gulch for a long hike. This area winds through old growth Redwood stands, ending up at a waterfall. While we were stopped there, admiring the beauty, two women walked up, one of which worked and lived in the nearby town of Mendocino, while the other lived in Novato. What could have been a brief hello in passing, turned out to be nearly an hour long in depth conversation about such things as what does Being Here Now mean? This day happened to be Halloween, and we had found out about a dance in Point Arena that night. Bob and I both love to dance, and to drink a couple of shots of vodka to loosen ourselves up properly before hand…which we did. The music was great, with lots of folks to dance with on the nice size floor. Upon returning to Moonstar at night, we almost always took a hot tub, and went over the fine details of the day.
~~~ The next day, well, it was yet another stunningly beautiful day, as they all were, with glorious sunshine, and not much wind on the ocean. The day started off, at least for me, as the last stars gave way to the gradually lightening of the morning sky. When Bob got up, one thing lead to another, like coffee to an early morning cocktail before the sun even rose! Under general circumstances, having a drink before sunrise would never happen, no way, never. But, we were deep into nature, and somehow things just turned that way, and by the way, was so much fun to watch the ocean, which was right below the bluff this house sat on, surrounded by nine full acres of coastal environment. We watched all the sea birds flying by, the full moon slipping into the ocean, sometimes listening to the Moody Blues, or Neil Young on the stereo, with the speakers out the windows towards the hot tub, sometimes loud! We headed up highway 1 again, all the way up to the small town of Mendocino. We took a right off the highway into the Big River State Park, where we were amazed at how pristine it was. We hiked up through the forest on a nice trail, and then took a sharp right down a cliff to the flood plain below. There were stands of Redwood, Douglas Fir, and a few others lining the river. We spent several hours out in the sun just talking about life in all directions. We then went into Mendocino and had lunch, before driving back south to our place. We ended up at a great restaurant called St. Orres, near our Moonstar for dinner. We sat by the fireplace out front enjoying a glass of wine, and somehow we eventually began talking to these two women who were hanging out too. We ended up talking for several hours with them, inviting them to have dinner with us at our table. We talked about everything under the sun, I mean the full November moon!
~~~ This brought us up to our last full day on the coast, and by then we were a bit tired, after all the long hikes, early and late hours, and to some extent partying. After all the same activities as the day before before sunrise and after, and having a nice breakfast, we headed out for what we thought would be a short walk. As things sometimes turn out, this short jaunt, turned out to be a long hike down the coast, along the entire nine acres of our ocean front property. It was totally fun to just have the time to explore, to sit and ponder the beauty, and of course have another long talk about nature, weather, spirituality, and likely women…knowing Bob and I. This last morning started off in the hot tub, admiring the huge ocean, and lots of waves breaking on the rocks right there in front. We drove north, stopping off in Point Arena at the co-op, saying goodbye to a old friend of mine who owns the store, Peter. We drove north and then east to the small town of Boonville, in the lovely wine grape growing Anderson Valley…known best for its Pinot Noir. We stopped at our favorite vineyard, called Goldeneye, and sat out in the courtyard soaking in the beauty of the grape vines, in their splendid green, yellow, and red leaves…on an exceptionally sunny and abnormally warm day. We tasted some of the wine, and got talking to one of the lady wine servers there, named Jeana, not exactly sure of the spelling. The three of us hit it off so well we ended spending almost three hours there speaking about everything wine, and our own lives too. Bob works for the County of Sacramento, in the area of Geographical Information Systems (GIF), and teaches at San Francisco State College, and two other colleges in the central Valley. He has been accepted to teach classes at UC Davis too, and has applied to Berkeley as well. Jeana lived with her husband and three kids on 40 acres on a ridge above Boonville. Their place is powered by the sun exclusively, and is country living at its finest. Me, well, you know what I do already. We then drove south to Linda’s house in Marin, and sat out on her deck and shared a bottle of red wine, before taking a good walk, and then back for dinner.
~~~ We all got up early Wednesday morning, wanting to fit in one more hike, this time back to Tennessee Valley. We had to get back early so Bob could get cleaned up, fed, coffee’d, and ready for the drive back to Sacramento to begin work at noon. He taught that evening, so it was going to be a long day for h. Linda and I will be doing some stuff, but to tell you the truth, I feel like I need to recouperate a little. This time with Bob, which we do every year, was as I mentioned before, the best of the best, and is probably what I look forward to doing the most of anything that I do in a typical year. I really couldn’t write about everything, as I would have needed twice the space, although now that I think of it, spotting that coyote out in a field along highway 1 was great too…once we got the binoculars on him. So, I’m going to go out on the deck now, and wait for Linda to get back home. I need to go get a new cell phone battery charger, which I accidently left up north. I’ll get back online at least once or twice more before flying back to Maui, and trust that all of you are enjoying yourselves! Be well my friends, Aloha, Glenn.
November 4-6 Picking up the story again, Wednesday afternoon the weather began to look like rain…which finally began later in the day. I stayed home and relaxed, although finally got out to rake all the leaves off the grass before the light rains began. We, Linda and I also mowed the lawns, I grabbed a bottle of wine from the cellar, and we made dinner together. Dinner consisted of Miso soup, with tofu, bock choy, and noodles. We were tired after that, and sat watching a little television, before I went to bed early, to catch up on some much needed sleep. Thursday morning, we headed out on a new walk, taking in the sights along the way. Breakfast consisted of fruit salad, oatmeal, and coffee…along with a previously purchased fancy pastry from the shopping center. Linda took off for yoga, and I retired to reading on the deck, in the nice warm sunshine. We took a drive to San Rafael, to one of the best farmers markets in the area. When we got home, we had a quick java boost, before driving over to Tennessee Valley, with leftover drizzle in the air…but we were determined. Linda suggest a route in the valley that she hadn’t hiked in over 10 years. Along the way we saw four big wild turkeys, which mesmerized me. Further up the trail, we saw a Western Blue Bird, a Mule deer with a large rack of antlers…then we began looking for a Bobcat in the late afternoon sunshine, punctuated by a lovely a rainbow. We didn’t see a cat, but ended up spotting a coyote…which was a major treat! Just after enjoying the coyote company, a Great Horned Owl began hooting in the nearby forest as we were leaving. The day seemed to warrant the opening of a 375ML bottle of 2006 Anderson Valley Goldeneye Pinot Noir, which was delicious. We then cooked a grass fed ribeye steak, plated with small yukon gold potatoes, a salad, and tiny steamed brussel sprouts, sprinkled with grated cheese. Later in the evening, we turned on her computer and watched youtube video’s.
~~~ Friday morning we started off early by walking along a marsh creek, where we saw about 25 Great Egrets and Snowy Egrets, and a Coopers Hawk…don’t forget that Linda is a birder! We came back for an oatmeal breakfast, watched Democracy Now with Amy Goodman on the television. I called a friend who used to work at the Pacific Disaster Center on Maui, who now works in downtown San Francisco. Linda dropped me off at the Ferry building, and I ferried to San Francisco, with a heavy drizzle falling. I got a window seat and immediately started talking with a gentleman who pulled in across from me. We chatted through the entire voyage across the bay about this and that. We docked, and I was astonished by the crowds of people, and the level of loud talking surrounding me. I found a reasonably quiet nook, and called my friend Jeff Logan on the cell phone, who walked from his office, and met me. We hadn’t seen each other in many years, so it was great to catch up some while having a Thai lunch together. We then went to his office, called CustomWeather, Inc. where I met many of his fellow workers. We spent about two hours there, which was great, looking out of his office windows at all the people walking by below, and the surrounding tall buildings. Then we took the bus from SF across the Golden Gate Bridge, to Larkspur, near Corte Madre and San Rafael. We met his wife Melle at a restaurant called Benissimo, where we had a nice Italian dinner and a glass of red wine. Later, after dinner and great conversation, we headed over to a place where meditation was taking place, along with a talk by a man named David. Afterwards we went to Jeff and Melle’s place for Chamomile tea. They both have Harley Davidson motorcycles, and showed me a great slide show of their travels to the Sierra Nevada mountains, and the canyon-lands of Utah. It was a very long day, and I was pooped when I got back to Linda’s at around 1130pm. I heard Linda get in past midnight, after her Tango dance evening in San Francisco.
November 7-8 Saturday was rather a low key day, at least through most of the morning into the early afternoon hours. Linda and I got invited over to some friend’s house for dinner and a glass of wine. We drove part way, and then walked the rest of the way. There were five lovely ladies at this dinner party, which was especially enjoyable for me! We all knew each other, although I did meet one new friend. This person was driving one of the ladies to the SF airport, for a long flight to Sri Lanka, where she will be teaching yoga for the next five months. My friends Jeff and Mele, who live nearby had called me earlier in the day and invited me to go to see a new film with them. They picked me up, and we went to see the new Michael Jackson film called This Is It. This film was excellent, especially because I have admired MJ’s music and dancing skills from way back. A couple of their lady friends had saved us a seat, which was fortunate, as the theatre was totally packed. I loved the film, and hope to see it again when I get back to Maui. The five of us then went to a restaurant/bar nearby, and sat around raving about the film over a glass of wine. All of the above would have generally made for a good day, but no, we weren’t quite through yet. We all went over to one of the ladies house for more fun, which turned out to be dancing in her front room to MJ video’s. I’m not sure where she got these long playing video’s, but they were excellent. Jeff and Mele drove me back to Linda’s after all this, and I slipped under the warm down comforter on my big bed, which felt so good!
~~~ Today is my last full day of vacation, so that I’m right at the tail-end of my time away from the islands. Linda and I just hung around through the morning, having another wonderful breakfast together. I love sitting out on her deck watching all the birds while I sip on my coffee each morning. We had a mutual friend stop over during the afternoon, who had just flown in from Australia. His girlfriend had just picked him up from the airport in SF, and they were on their way home to Santa Rosa. Shortly thereafter Linda and I took off for a long walk out in nature. I wish I could tell you where we went, but unfortunately I didn’t catch the name of this place. I would ask Linda, but she’s out Tango dancing again this evening. I do know however that it was along the slopes of Mount Tamalpais, which are exceptionally beautiful. We ended up stopping by one of Linda’s friends on the way home, who lives in a small canyon. His name is Nick, and he served Linda a small glass of red wine, while we went out in his back yard and observed all the birds that frequent that area. Nick has all kinds of bird feeders placed in the trees surrounding his house, so there is a marvelous number of bird species that were flitting around like crazy. They were busy talking about birds, and using their binoculars to take closer looks. We made it back to Linda’s, where I retired to the back deck with a glass of red wine myself. This particular bottle, which I got out of the cellar, was a very nice Atascadero Creek 2002 Sonoma County Green Valley, Pinot Noir from Railroad Vineyard. I’m sitting here now, after watching the sunset, and snipping the most incredibly fragrant red rose in Linda’s yard!
~~~ I’m waiting for Linda to get home, so had some time to write these last two paragraphs. We’ll have dinner together, probably watch some television, and then it will be time to gear up on Monday, for the flight back to Kahului, Maui. One of my neighbors is picking me up from the airport at around 5pm, leading into Tuesday…my first day back to work. This will be the last sharing that I will be doing before slipping back into my regular routine Tuesday. I hope you have enjoyed reading about my vacation as much as I have enjoyed using these writings as sort of a journal. By the way, we have some potentially heavy rains coming to the Hawaiian Islands around Wednesday and Thursday, with possible flooding and maybe even a thunderstorm or two! I’ll catch up with you either Monday evening, or certainly by early Tuesday morning. Be well until then, Aloha for now…Glenn.
November 9 Hi everyone, I’m home here in Kula, Maui, and it’s so warm in Hawaii…at least compared to northern California. I have more to say, but my neighbors have invited me for dinner, as I have no food, and need to shop soon. When I turned my computer on I found it to be not working properly. This of course leaves me high and dry in terms of updating this website, at least at home. I’m using my neighbors right now, and hopefully I’ll have mine fixed soon. I should be able to get on another computer again Tuesday, so will be back online then. Be well, Aloha, Glenn.
« Previous Page


