August 11-12, 2009
Air Temperatures – The following maximum temperatures were recorded across the state of Hawaii Tuesday afternoon: Lihue, Kauai – 83
Honolulu, Oahu – 87 Kaneohe, Oahu – 85 Kahului, Maui – 80 Hilo, Hawaii – 86
Kailua-kona – 89 Air Temperaturesranged between these warmest and coolest spots near sea level – and on the highest mountains…at 4 p.m. Tuesday afternoon:
Barking Sands, Kauai – 91F
Kahului, Maui – 76
Haleakala Crater – 54 (near 10,000 feet on Maui)
Mauna Kea summit – 63 (near 14,000 feet on the Big Island) Precipitation Totals – The following numbers represent the largest precipitation totals (inches) during the last 24 hours on each of the major islands, as ofTuesday afternoon:
1.37 Hanalei River, Kauai 0.54 Oahu Forest NWR, Oahu
0.30 Molokai
0.00 Lanai
0.00 Kahoolawe 1.62 West Wailuaiki, Maui 1.78 Honokaa, Big Island
Marine Winds – Here’s the latest (automatically updated) weather mapshowing two high pressure systems to the north and northeast of the islands. Winds will be gusty from the northeast near Oahu and Kauai, while lighter from the southeast over Maui and the Big Island…due to the passage of former Felicia.
Satellite and Radar Images:To view the cloud conditions we have here in Hawaii, please use the following satellite links, starting off with thisInfrared Satellite Image of the islands to see all the clouds around the state during the day and night. This next image is one that gives close images of the islands only during the daytime hours, and is referred to as a Close-up visible image. This next image shows a larger view of the Pacific…giving perspective to the wider ranging cloud patterns in the Pacific Ocean. Finally, here’s a LoopingIR satelliteimage, making viewable the clouds around the islands 24 hours a day. To help you keep track of where any showers may be around the islands, here’s the latest animatedradar image.
Hawaii’s Mountains – Here’s a link to the live webcam on the summit of near 14,000 footMauna Kea on the Big Island of Hawaii. The tallest peak on the island of Maui is theHaleakala Crater, which is near 10,000 feet in elevation. These two webcams are available during the daylight hours here in the islands…and when there’s a big moon rising just after sunset for an hour or two! Plus, during the nights and early mornings you will be able to see stars, and the sunrise too…depending upon weather conditions.
Tropical Cyclone activity in the eastern and central Pacific – Here’s the latest weather information coming out of the National Hurricane Center, covering the eastern north Pacific. You can find the latest tropical cyclone information for the central north Pacific (where Hawaii is located) by clicking on this link to the Central Pacific Hurricane Center. Here’s a tracking map covering both the eastern and central Pacific Ocean. A satellite image, which shows the entire ocean area between Hawaii and the Mexican coast…can be found here.
Aloha Paragraphs
Felicia moving between Maui and the Big Island
Former tropical cyclone Felicia will be a part of our Hawaiian Island weather picture through Wednesday…with returning trade wind weather Thursday. The Central Pacific Hurricane Center (CPHC) has dropped the tropical storm watch, and the flash flood watch across the entire state of Hawaii. What we’re left with is a small craft wind advisory for all coastal and channel waters statewide…and a high surf advisory for the east shores of all the islands.
As this dissipating tropical system moves across the southern part of the island chain, all of the islands will receive some showers. Once this showery weather moves west, past the state Wednesday, we’ll return to favorably inclined trade wind weather conditions statewide…lasting through the rest of the week into next week. Here’s a looping radar image of the Hawaiian Islands, so we can keep an eye on those showers moving through the state.
There has been a continued weakening of tropical cyclone Felicia Tuesday evening. The last CPHC forecast has been issued, as Felicia has dropped down below the tropical depression status. Here’s the lasttracking map, showing the center of Felicia moving through the Alenuihaha Channel, between Maui and the Big Island. Here’s asatellite imageshowing this weakening tropical system in relation to the Hawaiian Islands…although it’s difficult to see it anymore.
~~~ As what’s left of Felicia moves through the state, we’ll see localized blustery winds, with gusts being enhanced where physical terrain features accelerate the flow. Some areas will be blocked from the strongest winds however, which will range generally between 25-35 mph…although there will be higher gusts locally as well. These gusty winds will remain active in some places into Wednesday….becoming lighter thereafter.
~~~ Finally, as this dissipated tropical depression continues its journey through the islands…we’ll see at least some clouds, and localized showers Tuesday night into Wednesday. It’s difficult to gauge exactly how much precipitation that we might receive by the end of this showery weather episode, but an estimate might be 1-2 inches in general, with higher amounts in a few places. The windward sides will find the largest amounts, although the leeward sides will find some precipitation as well.
It’s Tuesday evening here in Kihei, Maui, as I begin writing this latest update to the narrative.If you had a chance to read down this far on the page, you know that remnants of tropical depression Felica will be moving through the southern Hawaiian Islands during the next 24 hours. Here’s a looping satellite image of Felicia moving through between Maui and the Kohala/Hamakua area on the Big Island.
~~~There will continue to be those localized blustery winds and showers which are still forecast to bring unusual weather conditions to the islands ..at least in terms of the summer season. Now that this storm has been sheared apart, the lower level circulation of the storm…the lower cloud swirl, is being directed along by the trade wind flow. Here’s asatellite imageof Felicia and the Hawaiian Islands.
~~~Meanwhile, a new tropical depression called 9E remains active in the eastern Pacific Ocean. This tropical cyclone is expected to strengthen into a tropical storm named Guillermo, and continue on into our central Pacific as a tropical storm. It’s present track timing would bring it into our part of the Pacific Ocean basin by this Friday evening. Here’s the NHCtracking mapfor this newly formed system. Here’s thesatellite photoof 9E. The expected track shows, or at least we can project that 9E will remain well south of our Hawaiian Islands.
~~~ Meanwhile again, we finda tropical cyclone named 1C, which started down to the southwest of the Hawaiian Islands…again here in the central Pacific Ocean. We don’t need to worry about 1C, which was given the name tropical storm Maka recently…as it’s located 1100+ miles to the southwest of Honolulu. Here’s atracking map…and asatellite imageof that area.
~~~ The computer models continue to try and spin-up another storm in the eastern Pacific, which would be called 10E. If this system did spawn as expected, it would take on the name tropical storm Hilda. This would be another storm that would likely travel westward into our central Pacific Ocean. It’s still too early to know very much about this new storm, however the computer models do show it moving across the eastern Pacific, towards our central Pacific eventually.
~~~ So far, as we get into Tuesday night, after a long work day, I see that there have been 46,303 hits on this website, as of 845pm. At the same time there had been 659 google clicks…almost as many as the ~ 55,000 yesterday, which absolutely blows my mind, really! I want to thank each of you readers, it’s great to be writing about these storms and such…and know that you are reading about it. One more number while we’re tossing them out there, the grand total for this website during August so far, is 258,556 hits, with 4,560 google clicks…that’s over a quarter of a million hits, and we’re less than half way through the month…this deserves another exclamation point!
~~~ Finally, and I really mean finally this time, Tuesday was a very unusual day here in the islands. It didn’t look like the islands are "suppose to look" during the summer month of August! It was windy, and locally a wet day. Here in Kihei it was partly to mostly cloudy all day, with light drizzle and mist falling. It was pretty darn blustery too, even more than it usually is during the hot afternoons here on the south coast. I just looked outside before calling the Maui News for an interview about the weather, and the drizzle is coming down sideways! I’m curious to see what’s happening as I drive home to Kula. I’ll likely come back online later this evening for a minute and let you now.
~~~ It’s going on 9pm this evening, and it is absolutely still out, and the air temperature is hovering around 70F degrees…which feels very warm and humid. It was mostly cloudy, and showery on that drive home, with the cloud bases very low. I really must try and go to sleep now, as tomorrow is another day, as we all know. Plus, my Mom called me this evening and said something to the effect…"get some rest Glenn, you’ve been working too hard!" So, I’d best be following her directions, as I absolutely know she is looking out for my best health. Aloha for now…Glenn.
August 10-11, 2009
Air Temperatures – The following maximum temperatures were recorded across the state of Hawaii Monday afternoon: Lihue, Kauai – 83
Honolulu, Oahu – 87 Kaneohe, Oahu – 85 Kahului, Maui – 86 Hilo, Hawaii – 83
Kailua-kona – 88 Air Temperaturesranged between these warmest and coolest spots near sea level – and on the highest mountains…at 1 a.m. Tuesday morning:
Kailua-kona – 81F
Princeville, Kauai – 73
Haleakala Crater – 45 (near 10,000 feet on Maui)
Mauna Kea summit – 43 (near 14,000 feet on the Big Island) Precipitation Totals – The following numbers represent the largest precipitation totals (inches) during the last 24 hours on each of the major islands, as ofMonday afternoon:
0.41 Mount Waialaele, Kauai 0.50 Manoa Lyon Arboretum, Oahu
0.35 Molokai
0.02 Lanai
0.02 Kahoolawe 1.51 West Wailuaiki, Maui 0.49 Hilo airport, Big Island
Marine Winds – Here’s the latest (automatically updated) weather mapshowing two high pressure systems to the north and northeast of the islands. These high pressure cells, along with their associated ridges to our north, will keep the trade winds Monday.Winds will become stronger and gusty Tuesday, as Felicia moves through the central part of the Hawaiian Islands late in the day…into Wednesday.
Satellite and Radar Images:To view the cloud conditions we have here in Hawaii, please use the following satellite links, starting off with thisInfrared Satellite Image of the islands to see all the clouds around the state during the day and night. This next image is one that gives close images of the islands only during the daytime hours, and is referred to as a Close-up visible image. This next image shows a larger view of the Pacific…giving perspective to the wider ranging cloud patterns in the Pacific Ocean. Finally, here’s a LoopingIR satelliteimage, making viewable the clouds around the islands 24 hours a day. To help you keep track of where any showers may be around the islands, here’s the latest animatedradar image.
Hawaii’s Mountains – Here’s a link to the live webcam on the summit of near 14,000 footMauna Kea on the Big Island of Hawaii. The tallest peak on the island of Maui is theHaleakala Crater, which is near 10,000 feet in elevation. These two webcams are available during the daylight hours here in the islands…and when there’s a big moon rising just after sunset for an hour or two! Plus, during the nights and early mornings you will be able to see stars, and the sunrise too…depending upon weather conditions.
Tropical Cyclone activity in the eastern and central Pacific – Here’s the latest weather information coming out of the National Hurricane Center, covering the eastern north Pacific. You can find the latest tropical cyclone information for the central north Pacific (where Hawaii is located) by clicking on this link to the Central Pacific Hurricane Center. Here’s a tracking map covering both the eastern and central Pacific Ocean. A satellite image, which shows the entire ocean area between Hawaii and the Mexican coast…can be found here.
Aloha Paragraphs
Tropical storm Felicia approaches from the east
We’ll find increasing clouds ahead of weakening tropical cylcone Felicia, with locally windy and showery weather Tuesday into at least part of Wednesday…improving conditions Thursday into the weekend. The Central Pacific Hurricane Center (CPHC) is keeping the tropical storm watch alive over parts of the state of Hawaii Monday night…which includes the area from the Kauai Channel, across Oahu down through Maui County. Meanwhile, tropical storm warnings remain in effect over the offshore waters around the islands. A small craft wind advisory is also active in all of the coastal and channel waters across the state of Hawaii. A small craft wind advisory means: THAT WIND SPEEDS OF 25 TO 33 KNOTS (29-38 mph) AND/OR SEAS 10 FEET OR GREATER ARE EXPECTED TO PRODUCE CONDITIONS HAZARDOUS TO SMALL CRAFT.
As the leading edge of dissipating tropical cyclone Felicia pushes into the state of Hawaii…we’llsee increasing showers arrive first on the Big Island and Maui. As this tropical system moves over the central islands, all of the islands will take a turn in getting wet. Once this blustery weather moves west, past the state later Wednesday, we’ll return to favorably inclined trade wind weather conditions statewide, through the rest of the week. Here’s a looping radar image of the Hawaiian Islands, so we can begin to look for the leading edge of the showers associated with Felicia coming from the northeast and east.
Note:The NWS has a Flash Flood Watch active for the islands of Kauai, Oahu, and Maui County through Wednesday afternoon. This means that…quoting the NWS: "ALTHOUGH FELICIA IS EXPECTED TO CONTINUE WEAKENING…ABUNDANT MOISTURE ASSOCIATED WITH THIS SYSTEM MAY STILL PRODUCE HEAVY RAINFALL…WITH THE POTENTIAL FOR FLASH FLOODING. THE LATEST FORECAST FOR FELICIA INDICATES THAT THE THREAT OF HEAVY RAIN WILL CONTINUE INTO WEDNESDAY…AND THE FLASH FLOOD WATCH HAS BEEN EXTENDED."The threat of heavy rain has lessened for the Big Island, so that island is no longer under this Flash Flood Watch.
There has been a continued weakening of tropical storm Felicia into Tuesday morning. The latest CPHC forecast now shows that Felicia will be a tropical depression, as it moves through the central part of the island chain. Here’s atracking map, showing the center of Felicia moving over Maui County…and Oahu. Here’s asatellite imageshowing this weakening tropical storm in relation to the Hawaiian Islands. At 2am Tuesday morning, the center of TS Felicia was 190 miles east of Kahului, Maui, and 280 miles east of Honolulu.
The latest reports from tropical storm Felicia at 2am Tuesday morning, showed 35 knots of sustained winds, which equates to 40 mph…with gusts to near 52 mph near the center. This tropical storm is expected to gradually weaken throughout the rest of its life cycle…becoming a tropical depression as it moves into the state of Hawaii. Tropical depression winds are 39 mph or lower.
If the current Central Pacific Hurricane Center (CPHC) forecast holds true, with a tropical depression moving across the central islands…we will see the following conditions.We’ve already seen the high surf pounding our east facing shores of the Big Island and Maui…bringing dangerously large breaking waves to our beaches. This surf will spread up to the other islands as well. The NWS forecast office in Honolulu is keepinga High Surf Warning in effect…for the east facing shores of Maui County and the Big Island. This high surf is expected to continue pounding those shores into Tuesday at 6pm. The other islands in the chain will see rising surf as well, becoming larger into Tuesday. The high surf along the east facing shores of the southern islands may exceed 15 feet. High surf along Oahu and Kauai’s east shores may exceed 8 feet, and last until 6pm Wednesday evening.
~~~ As Felicia gets closer, we’ll see blustery winds, with gusts being enhanced where physical terrain features accelerate the flow. Finally, when this tropical depression moves into the state…we’ll see increasing clouds, and localized showers late Monday night into Tuesday and Wednesday. It’s difficult to gauge exactly how much precipitation that we might receive ahead of time, but an estimate might be 1-3+ inches, with higher amounts locally. Flash flooding remains a threat across some parts of the island chain.
It’s Monday night here in Kula, Maui, as I writing this update to the narrative.If you had a chance to read down through this entire page, you know that gradually weakening tropical storm Felica is heading towards our Hawaiian Islands. The gradual weakening of Felicia is being caused by the stronger winds at upper levels of the atmosphere…the so called shearing winds. These are conditions that typically inhibit further strengthening of a storm…and almost always cause further weakening.
~~~ Tropical storm Felicia has definitely run under those upper winds, which are decoupling the thunderstorms above Felicia…from the lower reaches of the storm. These shearing upper winds have had a big impact on the integrity of the storm, although there’s still thunderstorm activity to the northeast of the center. Here’s a looping satellite image of Felicia moving towards the islands, so you can see what I’m talking about.
There should continue to be a gradual losing of this storm’s strengthas it nears Hawaii through Tuesday night into Wednesday.
~~~ This weakening doesn’t mean that we won’t be seeing blustery winds and showers
however, which are still forecast to bring inclement weather conditions to the islands from Maui up through Kauai. Now that this storm has been sheared apart, the lower level circulation of the storm…the lower cloud swirl, will be directed along by our easterly trade wind flow. It would be wise to keep a close eye on this storm as it spins closer in our direction. Speaking of a close eye, here’s a satellite image of Felicia and the Hawaiian Islands.
~~~ A new tropical depression called 9E has spun up in the eastern Pacific Ocean. This tropical cyclone is expected to strengthen into a tropical storm named Guillermo, and continue on into our central Pacific as a tropical storm. It’s present track timing would bring it into our part of the Pacific Ocean basin by this Friday evening. Here’s the NHC tracking map for this newly formed system. Here’s the satellite photo of 9E.
~~~ Meanwhile, at 5pm HST Monday evening, a new tropical cyclone named 1C started down to the southwest of the Hawaiian Islands…again here in the central Pacific Ocean. We don’t need to worry about 1C, as it is near 1000 miles to the west-southwest of Honolulu. Here’s atracking map…and asatellite imageof that area.
~~~ The computer models are trying to spin up a 3rd storm in the eastern Pacific, which would be called 10E, which would take on the name tropical storm Hilda. This would be yet another storm that would likely travel westward into our central Pacific Ocean!
~~~ I was just leaving Kihei at around 630pm, a long day, after starting at 4 something Monday morning! I love my work, so it wasn’t a problem. By the way, I just checked to see how many of you folks logged onto my website Monday, and I’m totally amazed to find that there were 55,590 page impressions…which is a new record for this Hawaii Weather Today internet presence in one day! There were 790 clicks on the google ads Monday as well, amazing to say the least, and let me say thank you so much for your readership!
~~~ It’s around 2am Tuesday morning, and I’m up writing on this website, and updating the Pacific Disaster Center’s website as well. I should be asleep, but my wind chimes are clanking around so loudly, that it woke me up…and I figured I’d get up and see what was going on. I’ve dis-assembled the chimes, so that it’s a lot quieter now, and I’ll try and get back to bed. I’ll be up in a few hours though, and will be back here to fire up this website again then. I hope you have a great Monday night until then! Aloha for now…Glenn. ,
August 9-10, 2009
Air Temperatures – The following maximum temperatures were recorded across the state of Hawaii Sunday afternoon: Lihue, Kauai – 83 Honolulu, Oahu – 90 Kaneohe, Oahu – 85 Kahului, Maui – 86 Hilo, Hawaii – 80 Kailua-kona – 89 Air Temperaturesranged between these warmest and coolest spots near sea level – and on the highest mountains…at 4 p.m. Sunday afternoon:
Honolulu, Oahu – 87F
Princeville, Kauai – 79
Haleakala Crater – 57 (near 10,000 feet on Maui)
Mauna Kea summit – 64 (near 14,000 feet on the Big Island) Precipitation Totals – The following numbers represent the largest precipitation totals (inches) during the last 24 hours on each of the major islands, as ofSunday afternoon:
1.00 Mount Waialaele, Kauai 0.56 Oahu Forest NWR, Oahu
0.01 Molokai
0.00 Lanai
0.00 Kahoolawe 0.54 West Wailuaiki, Maui 0.27 Mountain View, Big Island
Marine Winds – Here’s the latest (automatically updated) weather mapshowing two 1028 millibar high pressure systems to the north and northeast of the islands. These high pressure cells, along with their associated ridges to our north, will keep the trade winds blowing Sunday into Monday.Winds will become stronger and gusty late Monday into Tuesday…as Felicia moves through the central part of the Hawaiian Islands.
Satellite and Radar Images:To view the cloud conditions we have here in Hawaii, please use the following satellite links, starting off with thisInfrared Satellite Image of the islands to see all the clouds around the state during the day and night. This next image is one that gives close images of the islands only during the daytime hours, and is referred to as a Close-up visible image. This next image shows a larger view of the Pacific…giving perspective to the wider ranging cloud patterns in the Pacific Ocean. Finally, here’s a LoopingIR satelliteimage, making viewable the clouds around the islands 24 hours a day. To help you keep track of where any showers may be around the islands, here’s the latest animatedradar image.
Hawaii’s Mountains – Here’s a link to the live webcam on the summit of near 14,000 footMauna Kea on the Big Island of Hawaii. The tallest peak on the island of Maui is theHaleakala Crater, which is near 10,000 feet in elevation. These two webcams are available during the daylight hours here in the islands…and when there’s a big moon rising just after sunset for an hour or two! Plus, during the nights and early mornings you will be able to see stars, and the sunrise too…depending upon weather conditions.
Tropical Cyclone activity in the eastern and central Pacific – Here’s the latest weather information coming out of the National Hurricane Center, covering the eastern north Pacific. You can find the latest tropical cyclone information for the central north Pacific (where Hawaii is located) by clicking on this link to the Central Pacific Hurricane Center. Here’s a tracking map covering both the eastern and central Pacific Ocean. A satellite image, which shows the entire ocean area between Hawaii and the Mexican coast…can be found here.
Aloha Paragraphs
Tropical storm Felicia approaches from the east
Generally nice conditions will prevail Sunday night into Monday morning, giving way to blustery weather later Monday into Tuesday…with improving conditions Wednesday. The Central Pacific Hurricane Center (CPHC) is keeping the tropical storm watch over the state of Hawaii in effect Sunday night, which includes the area from the Kauai Channel, across Oahu down through Maui County…to the Big Island. Meanwhile, tropical storm warnings remain in effect over the offshore waters around the islands. Tropical storm force winds are 39 to 73 mph.
Skies will be clear to partly cloudy Sunday night, with those usual cloudy periods…and a few showers.When tropical cyclone Felicia pushes towards the state of Hawaii during the day Monday into the night…we willsee increasingly heavy rains arrive around the Big Island and Maui. As the storm moves closer, the other islands will get wet into Tuesday. Once this rainy weather moves west past the state later Tuesday and on Wednesday, we’ll return to favorably inclined trade wind weather conditions statewide through the rest of the week.
Note:The NWS has a Flash Flood Watch active for the islands of Oahu, Maui County, and the Big Island starting Monday morning through Tuesday afternoon. This means that…quoting the NWS: "ABUNDANT MOISTURE ASSOCIATED WITH FELICIA IS EXPECTED TO PRODUCE EXTREMELY HEAVY RAINFALL WITH THE POTENTIAL FOR WIDESPREAD FLASH FLOODING INCREASING ON MONDAY AND CONTINUING INTO TUESDAY." Note:The NWS office in Honolulu continues its Flood Potential Outlook for Kauai and Niihau. There is the potential for heavy rains and flash flooding Monday night through Wednesday on those two islands. The NWS disclaimer reads: "AT THIS POINT…THERE IS CONSIDERABLE UNCERTAINTY IN THE LOCATIONS THAT WILL BE AFFECTED…THE ONSET…AND DURATION OF HEAVY RAINS…AS WELL AS THE RAINFALL AMOUNTS THAT ARE EXPECTED TO OCCUR. ALL OF THESE ARE DEPENDENT ON THE TRACK FELICIA ULTIMATELY TAKES."
Felicia continues moving across the central Pacific towards Hawaii…as a weakening tropical storm. The latest CPHC forecast now shows that Felicia will be a tropical storm, as it moves through the central part of the island chain over the next two days. Here’s atracking map, showing the center of Felicia moving over the island of Oahu, and then onwards just south of Kauai Tuesday morning…into the afternoon hours. Here’s a satellite imageshowing this weakening tropical storm in relation to the Hawaiian Islands. At approximately 8pm Sunday evening, the center of TS Felicia was 435 miles east-northeast of Hilo, Hawaii.
The latest sustained wind measurements with tropical storm Felicia at 8pm Sunday evening, showed 45 knots of sustained winds, which translates into 52 mph…with gusts to near 63 mph near the center. This tropical storm is expected to gradually weaken throughout the rest of its life cycle…although remaining a lower end tropical storm as it moves into the state of Hawaii…at least that’s the latest snap shot of its expectations. Again, tropical storm force winds are 39-73 mph, while tropical depression winds are 39 mph or lower. By the way, here’s a sea water temperature map showing the ocean to the east of the islands.
If the current Central Pacific Hurricane Center (CPHC) forecast holds true, with a tropical storm moving over the central islands…we would see the following influences.We’ve already seen the first signs of the storm along the east facing shores of the Big Island and Maui, where rising high surf has arrived…which could bring dangerously large breaking waves to our beaches Monday and Tuesday. As Felicia gets closer, we will see blustery weather, with gusty winds being enhanced where physical terrain features accelerate the flow Monday into Tuesday. Finally, when this tropical storm moves into the state…we’ll see increasing clouds, and heavy flooding rainfall during the day Monday into Tuesday as well. It’s difficult to gauge exactly how much precipitation that we might receive ahead of time, but an estimate might be 3-6 inches, with higher amounts towards 8-10"+…in those most wet mountain locations. Flash flooding is a definite threat across the entire island chain.
Note:In terms of high surf, the NWS forecast office in Honolulu has issued a High Surf Warning, which started at 6pm Sunday evening…for the east facing shores of Maui and the Big Island. This dangerously high surf is expected to continue pounding those shores into Tuesday. The other islands in the chain will see rising surf as well, becoming larger on Monday.
It’s early Sunday evening here in Kula, Maui, as I begin writing this last part of today’s narrative.If you had a chance to read down through this entire page, you know that gradually weakening tropical storm Felica is heading towards our Hawaiian Islands. The gradual weakening of Felicia is being caused by the stronger winds at upper levels of the atmosphere. These are conditions that typically inhibit further strengthening of a storm…and almost always cause further weakening.
~~~ Tropical storm Felicia seems to be holding her own, in terms of strength. The shearing upper winds have begun to do their work, although there’s still a considerable amount of thunderstorm activity to the northeast of the center. Here’s a looping satellite image of Felicia moving towards the islands, so you can see what I mean.
There should continue to be a very gradual diminishment of this storm’s strengthas it nears Hawaii. This weakening doesn’t mean that we won’t be seeing blustery winds and heavy rains however, which are still forecast to bring inclement weather conditions to our islands starting Monday. It would be wise to keep a close eye on this storm as it spins closer in our direction. Speaking of a close eye, here’s a good satellite image of Felicia and the Hawaiian Islands.
~~~ Just as an aside, a new tropical depression called 9E has spun up in the eastern Pacific Ocean Sunday. I’d recommend that we don’t worry about, what will likely become tropical storm Guillermo. We have enough to handle with Felicia at the moment…wouldn’t you agree! At any rate, here’s the NHC tracking map for this newly formed system. While we’re looking at new stuff, here’s the satellite photo of 9E.
~~~ I’ll be working into the night Sunday from home here in Kula, Maui. This will allow me to continue bringing you the latest updates, and information as we head into what looks to be a couple of days of windy and wet weather starting Monday. I hope you have a great Sunday night from wherever you’re reading from! I’ll grab a couple of hours of sleep, and then rise again around 430am Monday, to begin preparing your next new weather narrative from paradise. Aloha for now…Glenn.
~~~ Oh my gosh…it’s a little after 815pm Sunday evening, and there have been 34,962 page impressions on this website today! There have been 931 clicks on the google ads here too. It’s a good thing that I worked on this website all day, as there are so many of you who are logging on…wanting to find out about tropical storm Felicia! Thanks by the way for your readership…and the clicks too! I just did a google search on the very generic subject: Hawaii Weather…and noticed that this website comes up #1 on that well used list…thanks to all of you who are coming here for your weather information!
Here’s another one of those funny video’s, this time about cats again.
Interesting: Scientists have placed high-tech "spiders" inside and around the mouth of Mount St. Helens, one of the most active volcanoes in the United States. Networks such as these could one day be used to respond rapidly to an impending eruption. On July 14, 2009, these spider pods were lowered by cable from a helicopter hovering about 100 feet up and gently put in hot spots inside and around the volcano crater.
"This project demonstrates that a low-cost sensor network system can support real-time monitoring in extremely challenging environments," said WenZhan Song of Washington State University Vancouver. Song is the principal investigator for this NASA-funded technology research project, which also draws on participation from the U.S. Geological Survey and from NASA’s Jet Propulsion Laboratory, Pasadena, Calif.
These robotic emissaries were built to go where no human can and operate in extreme temperatures and treacherous terrain. Fifteen pods form a virtual wireless network, communicating with each other and the Earth Observing-1 (EO-1) satellite, operated by NASA’s Goddard Space Flight Center, in Greenbelt, Md.
"Taking data from the ground onsite and from above by satellite gives you a great picture of what is going on inside the volcano," said Steve Chien, principal scientist for autonomous systems at JPL. Each pod contains a seismometer to detect earthquakes; a GPS receiver to pinpoint the exact location and measure subtle ground deformation; an infrared sounder to sense volcanic explosions; and a lightning detector to search for ash cloud formation.
The main instrument box is the size and shape of a microwave oven. It sits on top of a three-legged tripod, which is why scientists call them spiders. The pods are powered by batteries that can last for at least a year. "With these high-tech instruments, we can rapidly respond during periods of volcanic unrest to supplement our permanent monitoring network or quickly replace damaged stations without excessive exposure to personnel," said Rick LaHusen, an instrumentation engineer with the U.S. Geological Survey’s Cascades Volcano Observatory, Vancouver, Wash.
In 1980, a tremendous eruption at Mount St. Helens caused considerable loss of life and damage. More recently, in 2004, the volcano came back to life and erupted more than 26 billion gallons of lava, accompanied by a series of explosions that hurled rock and ash far from the vent.
If eruptions like these ever occur again, a sensor network could be quickly put in place to provide valuable real-time information to scientists and emergency services. This work is part of NASA’s plan to develop a sensor web to provide timely data and analyses for scientific research, natural hazard mitigation, and the exploration of other planets in this solar system and beyond.
"We hope this network will provide a blueprint for future networks to be installed on many of the world’s unmonitored active volcanoes, so educated and reliable estimates can be made when a town or a village needs to be evacuated to reduce the risk to life and property," said Project Manager Sharon Kedar of JPL.
Chien said, "Hostile environments like Mount St. Helens are proving grounds for future space missions, such as to Mars, where we may someday have similar sensor networks to track a meteor strike, dust storm or Mars quake, as a virtual scientist on the ground." Song said, "The design and deployment experiences will help us understand challenging environments and inspire new discoveries."
Interesting2:Scientists now know how a natural hydrocarbon emitted in large quantities by plants can be transformed into light-scattering aerosols that contribute to haze and influence climate. The finding will improve models of atmospheric chemistry and climate and may help explain puzzling field observations in some parts of the world, the researchers report. Worldwide, plants release more than 550 million metric tons of the hydrocarbon isoprene into the atmosphere each year.
But scientists have disagreed about the particular chain of chemical reactions that transform isoprene into haze-forming aerosols, says Fabien Paulot, an atmospheric chemist at the California Institute of Technology in Pasadena. Now, lab tests by Paulot and his colleagues, reported in the Aug. 7 Science, have identified a new class of substances long suspected to form as an intermediate in those reactions but never before seen.
The team created the chemicals, called dihydroxyepoxides, by placing isoprene and hydrogen peroxide in an 800-liter bag of unpolluted air and then illuminating the mix with ultraviolet light. The UV light stimulated chemical reactions, just as sunlight would, and the hydrogen peroxide served as a source of hydroxyl radicals — highly reactive compounds known as "the detergent of the atmosphere," Paulot says.
Isoprene and hydroxyl radicals reacted to form dihydroxyepoxides via two separate chemical processes. Because the resulting epoxides are highly soluble, they readily dissolve into droplets of moisture in the air to form organic-rich aerosols, Paulot says.
Interesting3:Harvard University scientists are predicting some forms of air pollution could increase significantly across the West as more of the region’s wild lands burn as a result of rising temperatures. Smoke from wildfires contains two main kinds of carbon particles: black soot, or elemental carbon, and lighter-colored particles, called organic carbon aerosols, which are a mix of chemicals.
"In large quantities, downwind of fires, organic carbon aerosols are hazardous," said senior research fellow Jennifer Logan, who led a study examining rising wildfire rates and the impact on air quality. "The particles irritate lung tissue and the chemicals they carry are toxic. But even at low concentrations, these aerosols may be dangerous. We don’t know. There is no known threshold where damage begins."
Interesting4:Three major glaciers in Alaska and Washington state have thinned and shrunk dramatically, clear signs of a warming climate, according to a study released Thursday by the U.S. Geological Survey. The three glaciers — Gulkana and Wolverine in Alaska and South Cascade in Washington — are considered benchmarks for those in alpine and maritime climates because they closely parallel other glaciers in their regions.
They have also been the subject of close scientific scrutiny since 1957. "These are the three glaciers in North America that have the longest record of mass change," said Shad O’Neel, a United States Geological Survey glaciologist in Anchorage who was one of the study authors.
"All three of them have a different climate from the other two, yet all three are showing a similar pattern of behavior, and that behavior is mass loss." Scientists are keeping a close watch on melting glaciers, as a rise in sea-levels would threaten coastal and low-lying areas around the world.
The latest study compares records of snow and ice thickness and densities over the years, the factors used to calculate mass. The glaciers have lost mass as melting outpaced new snow and ice accumulation, and for all three, the losses were especially dramatic over the past 15 years, according to the USGS study.
August 8-9, 2009
Air Temperatures – The following maximum temperatures were recorded across the state of Hawaii Saturday afternoon: Lihue, Kauai – 83 Honolulu, Oahu – 89 Kaneohe, Oahu – 84 Kahului, Maui – 86 Hilo, Hawaii – 83 Kailua-kona – 87 Air Temperaturesranged between these warmest and coolest spots near sea level – and on the highest mountains…at 4 p.m. Saturday afternoon:
Port Allen, Kauai – 88F
Hilo, Hawaii – 80
Haleakala Crater – 59 (near 10,000 feet on Maui)
Mauna Kea summit – 45 (near 14,000 feet on the Big Island) Precipitation Totals – The following numbers represent the largest precipitation totals (inches) during the last 24 hours on each of the major islands, as ofSaturday afternoon:
0.79 Mount Waialaele, Kauai 0.10 Kii, Oahu
0.00 Molokai
0.00 Lanai
0.00 Kahoolawe 0.38 West Wailuaiki, Maui 0.82 Honaunau, Big Island
Marine Winds – Here’s the latest (automatically updated) weather mapshowing a 1029 millibar high pressure system to the northeast of the islands. This high pressure cell, along with its associated ridge to our north, will keep the trade winds blowing Sunday.Winds will become stronger and gusty Monday and Tuesday…as Felicia moves through the southern part of the Hawaiian Islands.
Satellite and Radar Images:To view the cloud conditions we have here in Hawaii, please use the following satellite links, starting off with thisInfrared Satellite Image of the islands to see all the clouds around the state during the day and night. This next image is one that gives close images of the islands only during the daytime hours, and is referred to as a Close-up visible image. This next image shows a larger view of the Pacific…giving perspective to the wider ranging cloud patterns in the Pacific Ocean. Finally, here’s a LoopingIR satelliteimage, making viewable the clouds around the islands 24 hours a day. To help you keep track of where any showers may be around the islands, here’s the latest animatedradar image.
Hawaii’s Mountains – Here’s a link to the live webcam on the summit of near 14,000 footMauna Kea on the Big Island of Hawaii. The tallest peak on the island of Maui is theHaleakala Crater, which is near 10,000 feet in elevation. These two webcams are available during the daylight hours here in the islands…and when there’s a big moon rising just after sunset for an hour or two! Plus, during the nights and early mornings you will be able to see stars, and the sunrise too…depending upon weather conditions.
Tropical Cyclone activity in the eastern and central Pacific – Here’s the latest weather information coming out of the National Hurricane Center, covering the eastern north Pacific. You can find the latest tropical cyclone information for the central north Pacific (where Hawaii is located) by clicking on this link to the Central Pacific Hurricane Center. Here’s a tracking map covering both the eastern and central Pacific Ocean. A satellite image, which shows the entire ocean area between Hawaii and the Mexican coast…can be found here.
Aloha Paragraphs
Hurricane Felicia approaches from the east
A fairly typical trade wind weather pattern, with moderately strong trade winds, will persist through Sunday. A 1030 millibar high pressure system remains in place to the northeast of Hawaii Saturday evening. This trade wind producing high pressure cell is shown on thisweather map. A small craft wind advisory continues to cover only the windiest areas around Maui County and the Big Island at this time. As weakening tropical cyclone Felicia moves into our area Monday, we will see small craft wind advisories likely statewide, and perhaps even gale warnings in some of the major channels…along with wind advisories over certain parts of the islands. A tropical storm watch over the southern part of the state is already in effect, with tropical storm warnings over the offshore waters around the islands. Tropical storm force winds are 39 – 73 mph.
Generally fair weather conditions will prevail through Sunday…with a few showers falling along the windward sides during the night and early morning hours.When tropical cyclone Felicia pushes into the state of Hawaii during the day Monday…we will very likely see heavy rains arrive around the Big Island and Maui, and then move further up the chain to the other islands into Tuesday. Once this potentially rainy weather moves west past the state later Tuesday into early Wednesday, we will return to favorably inclined weather conditions statewide.
Note:The NWS has issued a Flash Flood Watch for the islands of Maui County and the Big Island starting Monday morning through Tuesday afternoon. This means that "ABUNDANT MOISTURE ASSOCIATED WITH FELICIA IS EXPECTED TO PRODUCE EXTREMELY HEAVY RAINFALL WITH THE POTENTIAL FOR WIDESPREAD FLASH FLOODING INCREASING ON MONDAY AND CONTINUING INTO TUESDAY" Note:The NWS office in Honolulu continues its Flood Potential Outlook for Oahu and Kauai, associated with tropical cyclone Felicia. There is the potential for heavy rains and flash flooding later Monday through the middle of the week on those two islands. The NWS disclaimer reads: "AT THIS POINT…THERE IS CONSIDERABLE UNCERTAINTY IN THE LOCATIONS THAT WILL BE AFFECTED…THE ONSET…AND DURATION OF HEAVY RAINS…AS WELL AS THE RAINFALL AMOUNTS THAT ARE EXPECTED TO OCCUR. ALL OF THESE ARE DEPENDENT ON THE TRACK FELICIA ULTIMATELY TAKES."
Hurricane Felicia is now moving across our central Pacific towards Hawaii…as a weakening hurricane.This hurricane is being rated as a category 1 tropical cyclone Saturday evening. Felicia is expected to drop in strength going forward, as it moves towards the Hawaiian Islands. The current forecast keeps Felicia a hurricane through Saturday, before weakening it into a tropical storm Sunday. Here’s atracking map, showing the center of Felicia heading generally towards the Alenuihaha Channel, and the southern part of Maui. Here’s a satellite imageshowing this weakening hurricane in relation to the Hawaiian Islands.
The sustained winds with hurricane Felicia Saturday evening were blowing at 75 knots, which translates into 86 mph…with gusts to near 104 mph. This hurricane is expected to gradually weaken throughout the rest of its life cycle. The relatively good news continues to be that the forecast drops the system down into a tropical storm, as it approaches the southern end of the island chain. Tropical storm force winds are 39-73 mph. By the way, here’s a sea water temperature map showing the ocean to the east of the islands.
If the current NHC forecast holds up, with a weakening tropical storm moving over the southern islands…we could see the following influences.The first sign of the storm would be rising high surf along our east facing shores later on Sunday…which could bring dangerously large breaking waves to our beaches into Monday and Tuesday. As Felicia gets closer, we would see blustery weather, with gusty winds being enhanced where physical terrain features accelerate the flow. Finally, when this tropical system moves over the state…we would see increasing clouds, and heavy flooding rainfall Monday into Tuesday. It’s difficult to gauge how much precipitation that we might receive ahead of time, but an estimate might be 5-8 inches, with 12+ inches in those wettest locations. Flash flooding is a definite threat across the entire island chain.
It’s Saturday evening here in Kula, Maui, as I begin writing this part of today’s narrative.If you had a chance to read down through this entire page, you know that gradually weakening hurricane Felica is heading towards our Hawaiian Islands. The hope is that as it pushes westward, it will run into stronger winds at upper levels of the atmosphere. These are conditions that typically inhibit further strengthening of a storm…and often cause a rather pronounced weakening. This may or may not happen, so we should pay close attention to the progress of this dangerous tropical cyclone as it takes aim on our islands. Here’s a great satellite image showing the big picture, with Felicia and the islands.
~~~ Hurricane Felicia was more or less maintaining its general strength Saturday evening, as it remains over relatively warm water, and hasn’t yet moved under the shearing upper winds that are expected before the system reaches the Hawaiian Islands. There could be a falling apart of this tropical cyclone as it nears Hawaii, although this hasn’t started to happen yet. As has been pointed out many times along the way, it is still a bit too early to know exactly for sure what will happen. If this shearing action takes place as hoped for, we would likely see a weakened tropical storm moving over, or close to Maui and the Big Island. If on the other hand, the shearing didn’t take place to the degree expected…we could see a stronger tropical storm moving into the state of Hawaii. Stay tuned!
~~~ After I got off work Friday evening at the Pacific Disaster Center in Kihei, Maui, I figured I would just go home, as it had been a very long week, and I was tired. Somehow, along the way, my car veered into Kahului, and I had a quick take out dinner at Down to Earth. I then drove over to one of the theaters, and looked to see what was playing. I ended up taking in a very endearing film called Julia & Julie (2009), starring Meryl Streep and Amy Adams…among others. This film was just exactly what I needed, and I enjoyed it very much! A short synopsis: Nora Ephron adapts Julie Powell‘s autobiographical book Julie and Julia: 365 Days, 524 Recipes, 1 Tiny Apartment Kitchen with this Columbia Pictures production starring Amy Adams as an amateur chef who decides to cook every recipe in a cookbook from acclaimed celebrity chef Julia Child (played by Meryl Streep) in order to chronicle it in a blog over the course of a year. Streep‘s Devil Wears Prada co-star Stanley Tucci re-teams with the actressas Child’s husband.
Speaking of great stuff, try this piece of work – make it full screen, turn the music up…and enjoy!
~~~ I worked at home today for the Pacific Disaster Center, so I was at my computer. I’ll be here to bring you the latest news on hurricane Felicia again on Sunday. I hope you have a great Saturday night from wherever you’re reading from! Aloha for now…Glenn.
Interesting: Scientists have placed high-tech "spiders" inside and around the mouth of Mount St. Helens, one of the most active volcanoes in the United States. Networks such as these could one day be used to respond rapidly to an impending eruption. On July 14, 2009, these spider pods were lowered by cable from a helicopter hovering about 100 feet up and gently put in hot spots inside and around the volcano crater.
"This project demonstrates that a low-cost sensor network system can support real-time monitoring in extremely challenging environments," said WenZhan Song of Washington State University Vancouver. Song is the principal investigator for this NASA-funded technology research project, which also draws on participation from the U.S. Geological Survey and from NASA’s Jet Propulsion Laboratory, Pasadena, Calif.
These robotic emissaries were built to go where no human can and operate in extreme temperatures and treacherous terrain. Fifteen pods form a virtual wireless network, communicating with each other and the Earth Observing-1 (EO-1) satellite, operated by NASA’s Goddard Space Flight Center, in Greenbelt, Md.
"Taking data from the ground onsite and from above by satellite gives you a great picture of what is going on inside the volcano," said Steve Chien, principal scientist for autonomous systems at JPL. Each pod contains a seismometer to detect earthquakes; a GPS receiver to pinpoint the exact location and measure subtle ground deformation; an infrared sounder to sense volcanic explosions; and a lightning detector to search for ash cloud formation.
The main instrument box is the size and shape of a microwave oven. It sits on top of a three-legged tripod, which is why scientists call them spiders. The pods are powered by batteries that can last for at least a year. "With these high-tech instruments, we can rapidly respond during periods of volcanic unrest to supplement our permanent monitoring network or quickly replace damaged stations without excessive exposure to personnel," said Rick LaHusen, an instrumentation engineer with the U.S. Geological Survey’s Cascades Volcano Observatory, Vancouver, Wash.
In 1980, a tremendous eruption at Mount St. Helens caused considerable loss of life and damage. More recently, in 2004, the volcano came back to life and erupted more than 26 billion gallons of lava, accompanied by a series of explosions that hurled rock and ash far from the vent.
If eruptions like these ever occur again, a sensor network could be quickly put in place to provide valuable real-time information to scientists and emergency services. This work is part of NASA’s plan to develop a sensor web to provide timely data and analyses for scientific research, natural hazard mitigation, and the exploration of other planets in this solar system and beyond.
"We hope this network will provide a blueprint for future networks to be installed on many of the world’s unmonitored active volcanoes, so educated and reliable estimates can be made when a town or a village needs to be evacuated to reduce the risk to life and property," said Project Manager Sharon Kedar of JPL.
Chien said, "Hostile environments like Mount St. Helens are proving grounds for future space missions, such as to Mars, where we may someday have similar sensor networks to track a meteor strike, dust storm or Mars quake, as a virtual scientist on the ground." Song said, "The design and deployment experiences will help us understand challenging environments and inspire new discoveries."
Interesting2:Scientists now know how a natural hydrocarbon emitted in large quantities by plants can be transformed into light-scattering aerosols that contribute to haze and influence climate. The finding will improve models of atmospheric chemistry and climate and may help explain puzzling field observations in some parts of the world, the researchers report. Worldwide, plants release more than 550 million metric tons of the hydrocarbon isoprene into the atmosphere each year.
But scientists have disagreed about the particular chain of chemical reactions that transform isoprene into haze-forming aerosols, says Fabien Paulot, an atmospheric chemist at the California Institute of Technology in Pasadena. Now, lab tests by Paulot and his colleagues, reported in the Aug. 7 Science, have identified a new class of substances long suspected to form as an intermediate in those reactions but never before seen.
The team created the chemicals, called dihydroxyepoxides, by placing isoprene and hydrogen peroxide in an 800-liter bag of unpolluted air and then illuminating the mix with ultraviolet light. The UV light stimulated chemical reactions, just as sunlight would, and the hydrogen peroxide served as a source of hydroxyl radicals — highly reactive compounds known as "the detergent of the atmosphere," Paulot says.
Isoprene and hydroxyl radicals reacted to form dihydroxyepoxides via two separate chemical processes. Because the resulting epoxides are highly soluble, they readily dissolve into droplets of moisture in the air to form organic-rich aerosols, Paulot says.
Interesting3:Harvard University scientists are predicting some forms of air pollution could increase significantly across the West as more of the region’s wild lands burn as a result of rising temperatures. Smoke from wildfires contains two main kinds of carbon particles: black soot, or elemental carbon, and lighter-colored particles, called organic carbon aerosols, which are a mix of chemicals.
"In large quantities, downwind of fires, organic carbon aerosols are hazardous," said senior research fellow Jennifer Logan, who led a study examining rising wildfire rates and the impact on air quality. "The particles irritate lung tissue and the chemicals they carry are toxic. But even at low concentrations, these aerosols may be dangerous. We don’t know. There is no known threshold where damage begins."
Interesting4:Three major glaciers in Alaska and Washington state have thinned and shrunk dramatically, clear signs of a warming climate, according to a study released Thursday by the U.S. Geological Survey. The three glaciers — Gulkana and Wolverine in Alaska and South Cascade in Washington — are considered benchmarks for those in alpine and maritime climates because they closely parallel other glaciers in their regions.
They have also been the subject of close scientific scrutiny since 1957. "These are the three glaciers in North America that have the longest record of mass change," said Shad O’Neel, a United States Geological Survey glaciologist in Anchorage who was one of the study authors.
"All three of them have a different climate from the other two, yet all three are showing a similar pattern of behavior, and that behavior is mass loss." Scientists are keeping a close watch on melting glaciers, as a rise in sea-levels would threaten coastal and low-lying areas around the world.
The latest study compares records of snow and ice thickness and densities over the years, the factors used to calculate mass. The glaciers have lost mass as melting outpaced new snow and ice accumulation, and for all three, the losses were especially dramatic over the past 15 years, according to the USGS study.
August 7-8, 2009
Air Temperatures – The following maximum temperatures were recorded across the state of Hawaii Friday afternoon: Lihue, Kauai – 82 Honolulu, Oahu – 90 Kaneohe, Oahu – 84 Kahului, Maui – 88 Hilo, Hawaii – 81 Kailua-kona – 88 Air Temperaturesranged between these warmest and coolest spots near sea level – and on the highest mountains…at 5 p.m. Friday evening:
Honolulu, Oahu – 85F
Lihue, Kauai – 78
Haleakala Crater – 57 (near 10,000 feet on Maui)
Mauna Kea summit – 45 (near 14,000 feet on the Big Island) Precipitation Totals – The following numbers represent the largest precipitation totals (inches) during the last 24 hours on each of the major islands, as ofFriday afternoon:
0.28 Mount Waialaele, Kauai 0.14 Palisades, Oahu
0.00 Molokai
0.00 Lanai
0.00 Kahoolawe 0.53 Puu Kukui, Maui 0.56 Waiakea Uka, Big Island
Marine Winds – Here’s the latest (automatically updated) weather mapshowing a 1030 millibar high pressure system to the north-northeast of the islands. This high pressure cell, along with its associated ridge to our north, will keep the trade winds blowing through Sunday.
Satellite and Radar Images:To view the cloud conditions we have here in Hawaii, please use the following satellite links, starting off with thisInfrared Satellite Image of the islands to see all the clouds around the state during the day and night. This next image is one that gives close images of the islands only during the daytime hours, and is referred to as a Close-up visible image. This next image shows a larger view of the Pacific…giving perspective to the wider ranging cloud patterns in the Pacific Ocean. Finally, here’s a LoopingIR satelliteimage, making viewable the clouds around the islands 24 hours a day. To help you keep track of where any showers may be around the islands, here’s the latest animatedradar image.
Hawaii’s Mountains – Here’s a link to the live webcam on the summit of near 14,000 footMauna Kea on the Big Island of Hawaii. The tallest peak on the island of Maui is theHaleakala Crater, which is near 10,000 feet in elevation. These two webcams are available during the daylight hours here in the islands…and when there’s a big moon rising just after sunset for an hour or two! Plus, during the nights and early mornings you will be able to see stars, and the sunrise too…depending upon weather conditions.
Tropical Cyclone activity in the eastern and central Pacific – Here’s the latest weather information coming out of the National Hurricane Center, covering the eastern north Pacific. You can find the latest tropical cyclone information for the central north Pacific (where Hawaii is located) by clicking on this link to the Central Pacific Hurricane Center. Here’s a tracking map covering both the eastern and central Pacific Ocean. A satellite image, which shows the entire ocean area between Hawaii and the Mexican coast…can be found here.
Aloha Paragraphs
Hurricane Felicia approaches from the east
Little change is expected in the strength of our local trade winds through the weekend…with the influence of weakening tropical cyclone Felicia taking over after the weekend. A 1030 millibar high pressure system remains in place to the north-northeast of Hawaii Friday night. This trade wind producing high pressure cell is shown on thisweather map. A small craft wind advisory continues to cover only the windiest areas around Maui County and the Big Island at this time. As whatever is left of Felicia moves into our area, we will very likely see small craft wind advisories, and perhaps even gale warnings in the major channels. There may be a tropical storm watch or warnings going up this weekend as well.
A typical trade wind weather pattern will keep just a few showers falling along our windward sides for the time being…with most leeward areas remaining dry.When tropical cyclone Felicia pushes close to the state of Hawaii starting Monday…we could see very rainy weather arrive around the Big Island and Maui, and then moving further up the island chain to the other islands. Once this potentially rainy weather moves west past the state later Tuesday or early Wednesday, we will return to favorably inclined weather conditions statewide. By the way, trying to put a positive spin on the prospect of rainfall, we’re hoping that there won’t be any flash flooding, but we could use the precipitation…the danger of course is too much of a good thing!
Hurricane Felicia remains active in the eastern Pacific Friday night…and actually gained strength temporarily.This kept the hurricane classified as a category 2 tropical cyclone. This system will begin to drop in strength going forward, as it moves into our central Pacific Saturday morning. The current forecast keeps Felicia a hurricane through Saturday, before weakening into a tropical storm Sunday. Here’s atracking map, showing Felicia heading towards the Aloha state. Here’s a satellite imageshowing this soon to be weakening hurricane in relation to the Hawaiian Islands.
The sustained winds Friday evening were blowing at 90 knots…which translates into 104 mph. The hurricane is expected to gradually weaken throughout the rest of its life cycle. The latest National Hurricane Center (NHC) forecast shows Felicia becoming a weaker hurricane when it moves into our central Pacific area early Saturday morning. The good news is that the forecast drops the system down into a tropical storm as it approaches the Big Island end of the chain…and then further weakening it to a tropical depression as it moves by to the south of the Aloha state.
If the current NHC forecast remains true, with a weakening tropical storm, or a tropical depression moving over the southern islands…we could see the following influences.The first sign of the storm would be rising surf along our east facing shores on Sunday…which could bring dangerously large breaking waves to our beaches. As Felicia gets closer, we could see locally blustery weather…depending upon the storm’s strength and location then. Finally, if this tropical system were to come in over, or close to the southern part of the state as expected, we would see increasing clouds, and potentially heavy flooding rainfall Monday into Tuesday.
Note:The NWS office in Honolulu has issued a Flood Potential Outlook for the state of Hawaii, associated with tropical cyclone Felicia. They are expecting heavy rains and flash flooding this coming Monday through the middle of the week. Their disclaimer says: "AT THIS POINT…THERE IS CONSIDERABLE UNCERTAINTY IN THE LOCATIONS THAT WILL BE AFFECTED…THE ONSET AND DURATION OF HEAVY RAINS…AND THE RAINFALL AMOUNTS THAT ARE EXPECTED TO OCCUR. ALL OF THESE ARE DEPENDENT ON THE TRACK FELICIA ULTIMATELY TAKES."
It’s Friday evening here in Kihei, Maui, as I begin writing this last part of this last part today’s narrative.If you had a chance to read down through this entire page, you know that there is a strong hurricane in the eastern Pacific, which is getting ready to cross over into our central Pacific soon. The good news is that as it moves over a cooler ocean surface, and pushes westward, it will also run into stronger winds at upper levels of the atmosphere. These are both conditions that inhibit further strengthening of a storm…and usually cause a rather pronounced weakening. Nonetheless, we should continue to monitor the progress of this storm. Here’s a great satellite image showing the big picture, with Felicia and the islands.
~~~Everything seems to be turning out according to script at this point, which is generally good news…at least in terms of not being hit by a major hurricane. Nonetheless, the three things we need to pay most attention to at this point, would be the rising surf along our east shores, the potentially blustery weather…and the threat of possible heavy flooding rains. These conditions are pointed out in the paragraphs above, although there remains the chance of deviations of these expected conditions. Thus, we all need to pay close attention to this approaching tropical cyclone, as it heads in our direction.
~~~ By the way, the number of page impressions that this website received Thursday, due to the high traffic count of those folks who were looking for information on hurricane Felicia…was 23,507. This was one of the largest numbers since the last big weather event happened here in the islands. Of those, there were 265 clicks on my google ads, which is one way that I create funding for keeping this website updated on a daily basis. Friday’s total was 20,854 page impressions, with 445 google clicks…thank you!
~~~ I’ll be back early Saturday morning with your next new weather narrative. I’ll have more of the latest information on hurricane Felicia then. I hope you have a great Friday night from wherever you happen to be reading this narrative! Aloha for now…Glenn.
Interesting: Scientists have placed high-tech "spiders" inside and around the mouth of Mount St. Helens, one of the most active volcanoes in the United States. Networks such as these could one day be used to respond rapidly to an impending eruption. On July 14, 2009, these spider pods were lowered by cable from a helicopter hovering about 100 feet up and gently put in hot spots inside and around the volcano crater.
"This project demonstrates that a low-cost sensor network system can support real-time monitoring in extremely challenging environments," said WenZhan Song of Washington State University Vancouver. Song is the principal investigator for this NASA-funded technology research project, which also draws on participation from the U.S. Geological Survey and from NASA’s Jet Propulsion Laboratory, Pasadena, Calif.
These robotic emissaries were built to go where no human can and operate in extreme temperatures and treacherous terrain. Fifteen pods form a virtual wireless network, communicating with each other and the Earth Observing-1 (EO-1) satellite, operated by NASA’s Goddard Space Flight Center, in Greenbelt, Md.
"Taking data from the ground onsite and from above by satellite gives you a great picture of what is going on inside the volcano," said Steve Chien, principal scientist for autonomous systems at JPL. Each pod contains a seismometer to detect earthquakes; a GPS receiver to pinpoint the exact location and measure subtle ground deformation; an infrared sounder to sense volcanic explosions; and a lightning detector to search for ash cloud formation.
The main instrument box is the size and shape of a microwave oven. It sits on top of a three-legged tripod, which is why scientists call them spiders. The pods are powered by batteries that can last for at least a year. "With these high-tech instruments, we can rapidly respond during periods of volcanic unrest to supplement our permanent monitoring network or quickly replace damaged stations without excessive exposure to personnel," said Rick LaHusen, an instrumentation engineer with the U.S. Geological Survey’s Cascades Volcano Observatory, Vancouver, Wash.
In 1980, a tremendous eruption at Mount St. Helens caused considerable loss of life and damage. More recently, in 2004, the volcano came back to life and erupted more than 26 billion gallons of lava, accompanied by a series of explosions that hurled rock and ash far from the vent.
If eruptions like these ever occur again, a sensor network could be quickly put in place to provide valuable real-time information to scientists and emergency services. This work is part of NASA’s plan to develop a sensor web to provide timely data and analyses for scientific research, natural hazard mitigation, and the exploration of other planets in this solar system and beyond.
"We hope this network will provide a blueprint for future networks to be installed on many of the world’s unmonitored active volcanoes, so educated and reliable estimates can be made when a town or a village needs to be evacuated to reduce the risk to life and property," said Project Manager Sharon Kedar of JPL.
Chien said, "Hostile environments like Mount St. Helens are proving grounds for future space missions, such as to Mars, where we may someday have similar sensor networks to track a meteor strike, dust storm or Mars quake, as a virtual scientist on the ground." Song said, "The design and deployment experiences will help us understand challenging environments and inspire new discoveries."
Interesting2:Scientists now know how a natural hydrocarbon emitted in large quantities by plants can be transformed into light-scattering aerosols that contribute to haze and influence climate. The finding will improve models of atmospheric chemistry and climate and may help explain puzzling field observations in some parts of the world, the researchers report. Worldwide, plants release more than 550 million metric tons of the hydrocarbon isoprene into the atmosphere each year.
But scientists have disagreed about the particular chain of chemical reactions that transform isoprene into haze-forming aerosols, says Fabien Paulot, an atmospheric chemist at the California Institute of Technology in Pasadena. Now, lab tests by Paulot and his colleagues, reported in the Aug. 7 Science, have identified a new class of substances long suspected to form as an intermediate in those reactions but never before seen.
The team created the chemicals, called dihydroxyepoxides, by placing isoprene and hydrogen peroxide in an 800-liter bag of unpolluted air and then illuminating the mix with ultraviolet light. The UV light stimulated chemical reactions, just as sunlight would, and the hydrogen peroxide served as a source of hydroxyl radicals — highly reactive compounds known as "the detergent of the atmosphere," Paulot says.
Isoprene and hydroxyl radicals reacted to form dihydroxyepoxides via two separate chemical processes. Because the resulting epoxides are highly soluble, they readily dissolve into droplets of moisture in the air to form organic-rich aerosols, Paulot says.
Interesting3:Harvard University scientists are predicting some forms of air pollution could increase significantly across the West as more of the region’s wild lands burn as a result of rising temperatures. Smoke from wildfires contains two main kinds of carbon particles: black soot, or elemental carbon, and lighter-colored particles, called organic carbon aerosols, which are a mix of chemicals.
"In large quantities, downwind of fires, organic carbon aerosols are hazardous," said senior research fellow Jennifer Logan, who led a study examining rising wildfire rates and the impact on air quality. "The particles irritate lung tissue and the chemicals they carry are toxic. But even at low concentrations, these aerosols may be dangerous. We don’t know. There is no known threshold where damage begins."
Interesting4:Three major glaciers in Alaska and Washington state have thinned and shrunk dramatically, clear signs of a warming climate, according to a study released Thursday by the U.S. Geological Survey. The three glaciers — Gulkana and Wolverine in Alaska and South Cascade in Washington — are considered benchmarks for those in alpine and maritime climates because they closely parallel other glaciers in their regions.
They have also been the subject of close scientific scrutiny since 1957. "These are the three glaciers in North America that have the longest record of mass change," said Shad O’Neel, a United States Geological Survey glaciologist in Anchorage who was one of the study authors.
"All three of them have a different climate from the other two, yet all three are showing a similar pattern of behavior, and that behavior is mass loss." Scientists are keeping a close watch on melting glaciers, as a rise in sea-levels would threaten coastal and low-lying areas around the world.
The latest study compares records of snow and ice thickness and densities over the years, the factors used to calculate mass. The glaciers have lost mass as melting outpaced new snow and ice accumulation, and for all three, the losses were especially dramatic over the past 15 years, according to the USGS study.
August 6-7, 2009
Air Temperatures – The following maximum temperatures were recorded across the state of Hawaii Thursday afternoon: Lihue, Kauai – 83 Honolulu, Oahu – 88 Kaneohe, Oahu – 84 Kahului, Maui – 85 Hilo, Hawaii – 81
Kailua-kona – 88 Air Temperaturesranged between these warmest and coolest spots near sea level – and on the highest mountains…at 5 p.m. Thursday afternoon:
Barking Sands, Kauai – 88F
Hilo, Hawaii- 79
Haleakala Crater – 57 (near 10,000 feet on Maui)
Mauna Kea summit – 61 (near 14,000 feet on the Big Island) Precipitation Totals – The following numbers represent the largest precipitation totals (inches) during the last 24 hours on each of the major islands, as ofThursday afternoon:
0.45 Mount Waialaele, Kauai 0.07 Oahu Forest NWR, Oahu
0.00 Molokai
0.00 Lanai
0.00 Kahoolawe 0.32 Puu Kukui, Maui 0.27 Hilo airport, Big Island
Marine Winds – Here’s the latest (automatically updated) weather mapshowing a 1030 millibar high pressure system to the north-northeast of the islands. This high pressure cell, along with its associated ridge to our north, will keep the trade winds blowing through Saturday.
Satellite and Radar Images:To view the cloud conditions we have here in Hawaii, please use the following satellite links, starting off with thisInfrared Satellite Image of the islands to see all the clouds around the state during the day and night. This next image is one that gives close images of the islands only during the daytime hours, and is referred to as a Close-up visible image. This next image shows a larger view of the Pacific…giving perspective to the wider ranging cloud patterns in the Pacific Ocean. Finally, here’s a LoopingIR satelliteimage, making viewable the clouds around the islands 24 hours a day. To help you keep track of where any showers may be around the islands, here’s the latest animatedradar image.
Hawaii’s Mountains – Here’s a link to the live webcam on the summit of near 14,000 footMauna Kea on the Big Island of Hawaii. The tallest peak on the island of Maui is theHaleakala Crater, which is near 10,000 feet in elevation. These two webcams are available during the daylight hours here in the islands…and when there’s a big moon rising just after sunset for an hour or two! Plus, during the nights and early mornings you will be able to see stars, and the sunrise too…depending upon weather conditions.
Tropical Cyclone activity in the eastern and central Pacific – Here’s the latest weather information coming out of the National Hurricane Center, covering the eastern north Pacific. You can find the latest tropical cyclone information for the central north Pacific (where Hawaii is located) by clicking on this link to the Central Pacific Hurricane Center. Here’s a tracking map covering both the eastern and central Pacific Ocean. A satellite image, which shows the entire ocean area between Hawaii and the Mexican coast…can be found here.
Aloha Paragraphs
Hurricane Felicia approaches from the east
A well established trade wind weather pattern will continue across the Hawaiian Islands…with locally gusty conditions through Friday into the weekend. A 1029 millibar high pressure system remains in place to the north-northeast of Hawaii Thursday evening. This trade wind producing high pressure cell is shown on this weather map. A small craft wind advisory remains active across the channel between Kauai and Oahu, then down through Maui County…to the Big Island. Our overlying atmosphere remains fairly dry and stable, limiting showers across our Aloha state for the time being. The windward sides will find a few showers falling at times. The leeward beaches will remain mostly dry. This should allow abundant sunshine to be available along our south and west facing shores. When tropical cyclone Felicia pushes close to the state of Hawaii during the first part of the new work week ahead…we may see very rainy weather arrive around the Big Island and Maui, perhaps further up the island chain.
Major hurricane Felicia, and tropical depression Enrique continue to spin the waters of the eastern Pacific Ocean Thursday evening.Enrique will be dissipating soon, as it moves over cooler sea surface temperatures. Our primary focuscontinues to be category 4 hurricane Felicia…as it moves into our central Pacific Saturday morning, still sporting hurricane force winds. Here’s atracking map, showing Felicia heading towards the Aloha state. Here’s a satellite imageshowing this impressive hurricane in relation to the Hawaiian Islands.
Hurricane Felicia continues to show a fierce face Thursday night, but should begin to lose some steam starting Friday. The sustained winds around the center were still blowing at 115 knots, or 132 mph…with gusts to 140 knots…or 161 mph Thursday evening. The hurricane is expected to gradually weaken throughout the rest of its life cycle. Nonetheless, it’s forecast to still be a tropical storm as it nears our Hawaiian Islands. The latest National Hurricane Center (NHC) forecast has Felicia being downgraded to a tropical depression after passing the Big Island.
If the current NHC forecast remains true, with a weakening tropical storm, or a tropical depression brushing by the southern islands in the chain…we could see the following influences. The first thing we would see would be rising surf along our east facing shores, perhaps as early as later Sunday or Monday…which could bring dangerous breaking waves to our beaches. As Felicia gets closer, we could see locally blustery weather…again depending upon the storm’s strength then. Finally, if this tropical system were to come in over, or close to the southern part of the state, we would see increasing clouds, and potentially heavy flooding rainfall early next week.
Despite the intensity of major hurricane Felicia at this time, we see encouragement ahead…as the storm begins a weakening process as it moves in our direction. The latest NHC forecast continues to show weakening of this tropical cyclone, as it nears the Aloha state. Perhaps the biggest threat now would be for potentially heavy rainfall. There’s also that chance of blustery winds as well…with the outside chance of tropical storm force winds around the Big Island. We still have many days to work out the details, and there will be more fine adjustments to the track and strength…before Felicia finally makes some sort of contact with our islands.
As the NWS forecast office in Honolulu has been saying: "At this time, it is too early to determine the exact track and intensity Felicia will have as it approaches the Hawaiian islands. That said, we are heading into the climatological peak of the central Pacific hurricane season, and Felicia serves as a reminder to always have a hurricane preparedness plan in place during the official central north Pacific hurricane season, which continues through November 30."
It’s Wednesday evening here in Kihei, Maui, as I begin writing this last part of today’s narrative.If you had a chance to read down through this entire page, you know that there is a very strong hurricane in the eastern Pacific, which is heading our way. The good news is that as it moves over a cooler ocean surface, and pushes westward, it will also run into stronger winds at upper levels of the atmosphere. These are both conditions that inhibit further strengthening of a storm…and usually cause a rather pronounced weakening. Nonetheless, we should continue to monitor the progress of this storm. ~~~ I will be back early Friday morning with more cutting edge information about the approach of hurricane Felicia. I hope you have a great Thursday night, and at this point, I personally won’t be losing any sleep over the consequences of this close brush, with what will likely be rapidly weakening tropical cyclone Felicia. I’ll also go on record in saying that we certainly aren’t out of the woods yet either…we all need to keep a close watch on this potential inclement weather producer for our state of Hawaii! ~~~ By the way, I just checked the number of page impressions that this website received Thursday, and due to the high traffic count, those folks who were looking for information on hurricane Felicia, the number was 22,080…one of the largest numbers since the last big weather event happened here in the islands. Of those, there were 248 clicks on my google ads, which is one way that I make money, for keeping this website updated on a daily basis. Aloha for now…Glenn.
Dedicated to all you cat lovers…of which I’m one – lovely!
Interesting:Stories of ships mysteriously sent to watery graves by sudden, giant waves have long puzzled scientists and sailors. New research by San Francisco State professor Tim Janssen suggests that changes in water depth and currents, which are common in coastal areas, may significantly increase the likelihood of these extreme waves.
Published in the Journal of Physical Oceanography, Janssen’s wave model simulations show that focusing of waves by shoals and currents could increase the likelihood of a freak wave by as much as 10 times. Although scientists cannot predict the occurrence of individual extreme waves, Janssen’s findings help pinpoint conditions and locations favorable for giant waves.
Extreme waves, also known as "freak" or "rogue" waves, measure roughly three times the size of the average wave height of a given sea state. Recorded monster waves have exceeded 60-feet — the approximate size of a six-story building. Janssen’s research suggests that in areas where wave energy is focused, the probability of freak-waves is much greater than previously believed.
Wave focal zones are particularly common in coastal areas where water depth variations and strong currents can result in dramatic focusing of wave energy. Such effects are particularly well known around river mouths and coastal inlets, restricting accessibility for shipping due to large, breaking waves near the inlet, or resulting in erosion issues at nearby beaches.
Extreme examples of wave focusing over coastal topography include world-class surf spots, such as Mavericks and Cortez Banks in California. The identification of freak wave hot spots is also important for shipping and navigation in coastal areas, and the design of offshore structures.
Interesting2:The non-profit Clean Air Watch today said the U.S. EPA is on track to get a passing grade for its proposal to deal with dangerous nitrogen dioxide air pollution. But Clean Air Watch added that the agency was "a long way from an A+" and it urged the EPA to "get that grade up" in order "to protect kids with asthma" and other breathers. The comments came in testimony at an EPA hearing on an agency proposal to update national clean air standards for nitrogen dioxide.
This widespread pollutant originates in traffic exhaust and the emissions from coal burning power plants and other smokestack industries. The current standard was set in 1971. "This issue is a test for how the Obama administration’s EPA will deal with national clean air standards," noted Frank O’Donnell, president of Clean Air Watch.
"The Bush administration failed miserably. All too often it ignored the science — and the agency’s own science advisers," O’Donnell said. "By contrast, we think the new EPA is on track for a passing grade with its proposal for nitrogen dioxide. But it’s a long way from an A+ when it comes to protecting kids with asthma.
We think it’s probably more like a B or C right now," depending on a range of options the agency has advanced. "We’d like you to get that grade up. We think kids with asthma deserve no less than A+ public health protection," said O’Donnell.
Clean Air Watch supports the recommendations of the American Lung Association, which has urged tougher short-term and long-term nitrogen dioxide standards in addition to a better system of monitoring.
O’Donnell also noted that "dirty air" is "the forgotten topic when it comes to health care reform." "It will cost a lot less to keep people out of the emergency rooms. And one way to do this is to reduce dangerous nitrogen dioxide pollution," O’Donnell said.
Interesting3:Wildlife Conservation Society (WCS) scientists studying shorebirds in western Arctic Alaska recently made a serendipitous discovery when they spotted a bar-tailed godwit with a small orange flag and aluminum band harmlessly attached to its legs. Further research revealed that scientists in Australia had banded the bird and attached the flag near Victoria – more than 8,000 miles away. While banded birds are sometimes seen in the area where they were originally released, it is very rare to see them so far from a release site.
The observation was made by WCS biologists Dr. Steve Zack and Joe Liebezeit. “It’s extremely unusual to find a banded bird that has flown literally thousands of miles from where it was released,” said Steve Zack. “While we know that birds from all over the world come to the Arctic to breed, to see a living example first hand is a powerful reminder of the importance of this region.”
Zack and Liebezeit also sighted a banded dunlin and semi-palmated sandpiper both of which were originally marked and released by WCS scientists three years ago in nearby Prudhoe Bay, Alaska for a study testing to see if birds that winter in Asia are carrying highly pathogenic H5N1 Avian Influenza to North America.
Semi-palmated sandpipers migrate from South America, and dunlins migrate from Asia . So far, shorebirds have not been detected to carry H5N1 into North America . “These sightings represent direct examples of the importance of Arctic Alaska as an international gathering place for migratory birds,” said Jodi Hilty, Director of WCS’s North America Programs.
“Birds from every continent and every ocean come to Arctic Alaska to breed during the short summer,” said Zack “The immense wetlands of western Arctic Alaska, encompassed almost entirely by the National Petroleum Reserve, are particularly important to migratory birds and worth conserving.”
Interesting4:Hollywood is world famous for many things — celebrities, sunshine, and shopping among them. But a new Hollywood attraction is the first of its kind: Environmentaland, an eco-themed park that opened this month at Hollywood Boulevard and North Highland Avenue.
The park is expected to entertain adults and kids alike, with attractions including an energy-generating see-saw, alternative energy-fueled golf carts, recycled paper plane takeoff, mini-bin exhibit and designing station, desert mini golf, planetarium, organic pet treats, and "Portal Potties" — mini entertainment history museums encased in redesigned porta potties.
As an added perk — and a strong hint toward sustainable travel — visitors who travel to the park via public transport pay no admission. (Students also get in free.) In addition to these year-round attractions, the park will host special events including art shows, film screenings, recycling drives, and design contests.
Global Inheritance is the organization responsible for creating Environmentaland. The non-profit aims to bring about social, environmental, and community change by engaging young people. Global Inheritance runs a number of ongoing programs, including TRASHed — Art of Recycling (a recycling awareness campaign), Tour Rider (a traffic reduction initiative),
The Bigger Picture film nights (which expose issues global warming and other issues), and Alternative Fuel RC Racing (which allows participants to race miniature-sized alt-fueled cars). Its past projects include the organizing of a free shuttle to Coachella Music Festival to minimize the event’s carbon footprint.
Interesting5:Advances in ecology increasingly reveal that conventional agricultural practices have detrimental effects on the landscape ecology, creating problems for long-term sustainability of crops. In a series of sessions at the Ecological Society of America’s Annual Meeting, ecologists will present their ideas on how our agricultural practices can take lessons from natural environments. Perennial plants produce more, require less input than annual croplands.
The major crops used globally to feed people and livestock — wheat, rice, maize and soy — are based on an annual system, in which crop plants live one year, are harvested, and are replanted the following year. These systems are notorious, however, for stripping organic nutrients from soils over time.
Interesting6:The federal government must take decisive action to avoid "a potentially catastrophic loss of animal and plant life," in the national parks, according to a new report that details the effect of global warming on the country’s most treasured public lands. The 53-page report from the National Parks Conservation Assn., a Washington-based advocacy group, contains a litany of concerns related to climate change in the parks, from the bleaching of coral reefs in Florida to the disappearance of high-altitude ponds that nurture yellow-legged frogs in California.
The group, which has offices in California and 10 other states, called on the National Park Service to come up with a detailed plan and funding to adapt to temperature-related ecosystem changes. "Right now, no national plan exists to manage wildlife throughout their habitat, which often is a patchwork of lands managed by multiple federal agencies, states, tribes, municipalities and private landholders," wrote Tom C. Kiernan, president of the group.
Interesting7:Within 60 years the Arctic Ocean could be a stagnant, polluted soup. Without drastic cuts in greenhouse-gas emissions, the Transpolar Drift, one of the Arctic’s most powerful currents and a key disperser of pollutants, is likely to disappear because of global warming. The Transpolar Drift is a cold surface current that travels right across the Arctic Ocean from central Siberia to Greenland, and eventually out into the Atlantic. It was first discovered in 1893 by the Norwegian explorer Fridtjof Nansen, who tried unsuccessfully to use the current to sail to the North Pole.
Together with the Beaufort Gyre, the Transpolar Drift keeps Arctic waters well mixed and ensures that pollution never lingers there for long. To better understand the dispersal of pollution in the Arctic Ocean, Ola Johannessen, director of the Nansen Environmental and Remote Sensing Center in Bergen, Norway, and his colleagues studied the spread of radioactive substances such as strontium-90 and caesium-137 from nuclear testing, bomb factories and nuclear power-plant accidents.
Measurements taken between 1948 and 1999 were plugged into a high-resolution ocean circulation model and combined with a climate model to predict Arctic Ocean circulation until 2080.
Interesting8:The active ingredient in many insect repellents, deet, has been found to be toxic to the central nervous system. Researchers say that more investigations are urgently needed to confirm or dismiss any potential neurotoxicity to humans, especially when deet-based repellents are used in combination with other neurotoxic insecticides.
Vincent Corbel from the Institut de Recherche pour le Développement in Montpellier, and Bruno Lapied from the University of Angers, France, led a team of researchers who investigated the mode of action and toxicity of deet (N,N-Diethyl-3-methylbenzamide).
Corbel said, "We’ve found that deet is not simply a behavior-modifying chemical but also inhibits the activity of a key central nervous system enzyme, acetycholinesterase, in both insects and mammals". Discovered in 1953, deet is still the most common ingredient in insect repellent preparations.
It is effective against a broad spectrum of medically important pests, including mosquitoes. Despite its widespread use, controversies remain concerning both the identification of its target sites at the molecular level and its mechanism of action in insects.
In a series of experiments, Corbel and his colleagues found that deet inhibits the acetylcholinesterase enzyme — the same mode of action used by organophosphate and carbamate insecticides.
August 5-6, 2009
Air Temperatures – The following maximum temperatures were recorded across the state of Hawaii Wednesday afternoon: Lihue, Kauai – 82 Honolulu, Oahu – 88 Kaneohe, Oahu – 84 Kahului, Maui – 87 Hilo, Hawaii – 83 Kailua-kona – 87 Air Temperaturesranged between these warmest and coolest spots near sea level – and on the highest mountains…at 5 p.m. Wednesday evening:
Barking Sands, Kauai – 87F
Hilo, Hawaii- 77
Haleakala Crater – 57 (near 10,000 feet on Maui)
Mauna Kea summit – 61 (near 14,000 feet on the Big Island) Precipitation Totals – The following numbers represent the largest precipitation totals (inches) during the last 24 hours on each of the major islands, as ofWednesday afternoon:
0.80 Mount Waialaele, Kauai 0.12 Manoa Valley, Oahu
0.03 Molokai
0.00 Lanai
0.00 Kahoolawe 0.25 Puu Kukui, Maui 0.51 Glenwood, Big Island
Marine Winds – Here’s the latest (automatically updated) weather mapshowing a 1029 millibar high pressure system to the north-northeast of the islands. This high pressure cell, along with its associated ridge to our north, will keep the trade winds blowing through Friday.
Satellite and Radar Images:To view the cloud conditions we have here in Hawaii, please use the following satellite links, starting off with thisInfrared Satellite Image of the islands to see all the clouds around the state during the day and night. This next image is one that gives close images of the islands only during the daytime hours, and is referred to as a Close-up visible image. This next image shows a larger view of the Pacific…giving perspective to the wider ranging cloud patterns in the Pacific Ocean. Finally, here’s a LoopingIR satelliteimage, making viewable the clouds around the islands 24 hours a day. To help you keep track of where any showers may be around the islands, here’s the latest animatedradar image.
Hawaii’s Mountains – Here’s a link to the live webcam on the summit of near 14,000 footMauna Kea on the Big Island of Hawaii. The tallest peak on the island of Maui is theHaleakala Crater, which is near 10,000 feet in elevation. These two webcams are available during the daylight hours here in the islands…and when there’s a big moon rising just after sunset for an hour or two! Plus, during the nights and early mornings you will be able to see stars, and the sunrise too…depending upon weather conditions.
Tropical Cyclone activity in the eastern and central Pacific – Here’s the latest weather information coming out of the National Hurricane Center, covering the eastern north Pacific. You can find the latest tropical cyclone information for the central north Pacific (where Hawaii is located) by clicking on this link to the Central Pacific Hurricane Center. Here’s a tracking map covering both the eastern and central Pacific Ocean. A satellite image, which shows the entire ocean area between Hawaii and the Mexican coast…can be found here.
Aloha Paragraphs
Hurricane Felicia approaches from the east
The trade winds will continue to blow across our Hawaiian Islands, remaining blustery through the next couple of days. A 1029 millibar high pressure system to the north-northeast of Hawaii has moved southwest towards our islands a bit…thus the increase in our local trade wind speeds. This trade wind producing high pressure cell is shown on this weather map. The small craft wind advisory remains active Wednesday evening, and has been increased in coverage to include the channel between Kauai and Oahu, then down through Maui County…to the Big Island. Showers, being carried our way on the gusty trade winds…will fall generally along our windward sides. The leeward beaches will remain mostly dry. This should allow abundant sunshine to be available along our south and west facing shores. There’s a slight chance of finding increased showers along the windward sides as we move into Friday and the weekend. If tropical cyclone Felicia pushes into the state of Hawaii early next week…we could see very rainy weather arrive.
Hurricane Felicia and tropical storm Enrique continue to churn the waters of the eastern Pacific Ocean Wednesday evening.Enrique will be dissipating quickly over the next day or so. The main event will be the threat from major hurricane Felicia…as it moves into our central Pacific Friday night or Saturday morning. Here’s atracking map, showing hurricane Felicia heading towards the Aloha state. Here’s a satellite imageshowing Felicia (east-southeast of Hawaii), and tropical storm Enrique, in relation to the Hawaiian Islands.
Hurricane Felicia remains strong enough Wednesday night to qualify as a Major Hurricane. This means that sustained winds around the center are blowing at 120 knots, or 138 mph…with gusts to 145 knots…or 167 mph. The hurricane shouldn’t attain any further strength, and gradually begin to weaken throughout the rest of its life cycle. Nonetheless, it’s forecast to still be a tropical storm as it nears our Hawaiian Islands. It’s still too early to know exactly what shape the storm will be in early next week, and may arrive as an even less imposing tropical depression.
Projecting the forecast track into the state, perhaps as a weakening tropical storm, or an even weaker tropical depression…we could see several influences. The first thing we would find would be rising surf along our east facing shores, perhaps as early as later Saturday into Sunday…which could be large and dangerous. Depending upon the strength of the storm at its entry into the state, if it doesn’t veer off in some other direction, we could see breezy to blustery weather…again depending upon the storm’s strength then. If the storm where to head up to our north, it would knock off our trade winds, and our winds could become very light. Finally, if the system were to come in right over the state, we would see increasing clouds, and potentially heavy flooding rainfall early next week.
It’s Wednesday evening here in Kihei, Maui, as I begin writing this last part of today’s narrative.No doubt about it, we have a very strong hurricane moving in the direction of the Hawaiian Islands. Despite that fact, we continue to expect significant weakening of this tropical cyclone, as it nears the Aloha state. Perhaps the biggest threat now would be for potentially heavy rainfall. I’m personally less worried about the associated winds, than I am about the chance of flooding precipitation. We still have many days to work out the details, and we will likely have to make many more fine adjustments to the track and strength before Felicia finally makes contact with our islands.
As the NWS forecast office in Honolulu is saying on their website today: "At this time, it is too early to determine the exact track and intensity Felicia will be as it approaches the Hawaiian islands late Sunday or Monday. That said, we are heading into the climatological peak of the central Pacific hurricane season, and Felicia serves as a reminder to always have a hurricane preparedness plan in place during the official central north Pacific hurricane season, which continues through November 30."
~~~ I’ll be back again early Thursday morning with your next new weather narrative from paradise. We will continue to see fine weather, despite the locally windy trade winds, which are pretty usual for this time of year. We have many more days to fine tune exactly what will be happening with the hurricane, although it would be wise to keep an eye on the progress of this tropical cyclone as it moves in our direction. Don’t forget to check out the full moon tonight! Aloha for now…Glenn.
Dedicated to all you cat lovers…of which I’m one – lovely!
Interesting: There is mounting evidence that omega-3 fatty acids from fish or fish oil supplements not only help prevent cardiovascular diseases in healthy individuals, but also reduce the incidence of cardiac events and mortality in patients with existing heart disease. A new study, published in the August 11, 2009, issue of the Journal of the American College of Cardiology, extensively reviews data from a broad range of studies in tens of thousands of patients and sets forth suggested daily targets for omega-3 consumption.
"This isn’t just hype; we now have tremendous and compelling evidence from very large studies, some dating back 20 and 30 years, that demonstrate the protective benefits of omega-3 fish oil in multiple aspects of preventive cardiology," said Carl Lavie, M.D., F.A.C.C., medical director of Cardiac Rehabilitation and Prevention, Ochsner Medical Center, New Orleans, LA, and lead author of the article.
"The strongest evidence of a cardio-protective effect of omega-3s appears in patients with established cardiovascular disease and following a heart attack with up to a 30 percent reduction in CV-related death."
Dietary intake of fish oil can also decrease the risk of atherosclerosis, arrhythmias, heart attack, sudden cardiac death and even health failure.
Dr. Lavie adds that although there is a smaller benefit in reducing heart failure death—9 percent mortality benefit in a major recent randomized controlled trial—this is still very impressive given patients’ grave prognosis.
"If we translate this finding, it means that we only need to treat 56 patients for four years to prevent one death," he said. "And we are talking about a very safe and relatively inexpensive therapy."
Interesting2:Geckos are very adept at climbing through difficult terrain using an intricate adhesive system. Until now it has not been known when and how they switch on their unique system of traction. Scientists at the University of Calgary and Clemson University in South Carolina have discovered that the geckos’ amazing grip is triggered by gravity.
"Geckos use microscopic, hair-like filaments to attach to surfaces. Only at certain angles do they switch on their traction system, however," says Russell, a biological sciences professor at the U of C. "We are trying to understand this process, which will help in mimicking it for application to robotics."
Geckos have long been known for their remarkable abilities to move on smooth surfaces such as glass. This study adds a new angle to previous research: geckos must be on an incline in order to trigger the deployment of their adhesive system.
"Much has been learned in recent years about the mechanism by which clinging takes place, but little is known about how geckos determine when to use this ability," says Higham, a former U of C student and now an assistant professor of biological sciences at Clemson.
"We show that perception of body orientation determines when the adhesive system is switched on." The scientists discovered that the tipping point which turns on the gecko’s adhesive system is 10 degrees.
Three of the six geckos studied applied their adhesive system on a 10 degree slope. At 30 degrees all six applied the system. The three that applied the traction at 10 degrees slowed down, the three that didn’t were much quicker.
"There are costs, in terms of speed, and benefits, in terms of traction, associated with this switch just as there are for Formula 1 cars when rain tires are employed instead of slicks when circumstances place a premium on grip over outright speed," says Russell. In the case of the geckos, the intricate way that the toes are used in order to achieve the grip necessary to climb is responsible for slowing them.
Interesting3:Researchers the world over are striving to develop organic solar cells that can be produced easily and inexpensively as thin films that could be widely used to generate electricity. But a major obstacle is coaxing these carbon-based materials to reliably form the proper structure at the nano-scale (tinier than 2-millionths of an inch) to be highly efficient in converting light to electricity.
The goal is to develop cells made from low-cost plastics that will transform at least 10 percent of the sunlight that they absorb into usable electricity and can be easily manufactured. A research team headed by David Ginger, a University of Washington associate professor of chemistry, has found a way to make images of tiny bubbles and channels, roughly 10,000 times smaller than a human hair, inside plastic solar cells.
These bubbles and channels form within the polymers as they are being created in a baking process, called annealing, that is used to improve the materials’ performance.
The researchers are able to measure directly how much current each tiny bubble and channel carries, thus developing an understanding of exactly how a solar cell converts light into electricity. Ginger believes that will lead to a better understanding of which materials created under which conditions are most likely to meet the 10 percent efficiency goal.
Interesting4:Automobile owners around the world may some day soon be driving on tires that are partly made out of trees – which could cost less, perform better and save on fuel and energy. Wood science researchers at Oregon State University have made some surprising findings about the potential of microcrystalline cellulose – a product that can be made easily from almost any type of plant fibers – to partially replace silica as a reinforcing filler in the manufacture of rubber tires.
A new study suggests that this approach might decrease the energy required to produce the tire, reduce costs, and better resist heat buildup. Early tests indicate that such products would have comparable traction on cold or wet pavement, be just as strong, and provide even higher fuel efficiency than traditional tires in hot weather.
"We were surprised at how favorable the results were for the use of this material," said Kaichang Li, an associate professor of wood science and engineering in the OSU College of Forestry, who conducted this research with graduate student Wen Bai.
"This could lead to a new generation of automotive tire technology, one of the first fundamental changes to come around in a long time," Li said. Cellulose fiber has been used for some time as reinforcement in some types of rubber and automotive products, such as belts, hoses and insulation – but never in tires, where the preferred fillers are carbon black and silica.
Carbon black, however, is made from increasingly expensive oil, and the processing of silica is energy-intensive. Both products are very dense and reduce the fuel efficiency of automobiles.
Interestin5:Deforestation in Brazil’s Amazon rainforest in June was four times more devastating than the month before, further depleting what is seen as one of the biggest buffers against global warming, official data revealed Tuesday. Satellite imagery analyzed by Brazil’s National Institute for Space Research showed 578 square kilometers (223 square miles) of Amazon woodland was burned or cut down.
That was more than four times the devastation recorded in May, and roughly equivalent to the size of Switzerland’s Lake Geneva, or half the area of California’s biggest city of Los Angeles. Most of the destruction was concentrated in the Brazilian states of Para and Mato Grosso. Ranchers and farmers regularly encroach on the vast zone.
Interesting6:The U.S. Department of Agriculture has proposed a labeling system to identify products made with renewable plant, animal and other bio-based materials. The Bio-preferred labeling proposal is an outgrowth of the federal government’s Bio-preferred purchasing program, which was created in the 2002 Farm Bill.
The 2008 Farm Bill expanded the program to also promote the sale of bio-based products outside of the government. The proposal would set up a system in which companies could voluntarily apply the Bio-preferred label to their products. The USDA has already identified more than 15,000 bio-based products in about 200 categories.
August 4-5, 2009
Air Temperatures – The following maximum temperatures were recorded across the state of Hawaii Tuesday afternoon: Lihue, Kauai – 81 Honolulu, Oahu – 87 Kaneohe, Oahu – 83 Kahului, Maui – 87 Hilo, Hawaii – 81
Kailua-kona – 87 Air Temperaturesranged between these warmest and coolest spots near sea level – and on the highest mountains…at 5 p.m. Tuesday evening:
Honolulu, Hawaii – 85F
Hilo, Hawaii- 73
Haleakala Crater – missing (near 10,000 feet on Maui)
Mauna Kea summit – 61 (near 14,000 feet on the Big Island) Precipitation Totals – The following numbers represent the largest precipitation totals (inches) during the last 24 hours on each of the major islands, as ofTuesday afternoon:
0.51 Mount Waialaele, Kauai 0.30 Manoa Valley, Oahu
0.00 Molokai
0.00 Lanai
0.00 Kahoolawe 0.29 West Wailuaiki, Maui 0.27 Honaunau, Big Island
Marine Winds – Here’s the latest (automatically updated) weather mapshowing a 1030 millibar high pressure system to the north-northeast of the islands. This high pressure cell, along with its associated ridge to our north, will keep the trade winds blowing through Thursday.
Satellite and Radar Images:To view the cloud conditions we have here in Hawaii, please use the following satellite links, starting off with thisInfrared Satellite Image of the islands to see all the clouds around the state during the day and night. This next image is one that gives close images of the islands only during the daytime hours, and is referred to as a Close-up visible image. This next image shows a larger view of the Pacific…giving perspective to the wider ranging cloud patterns in the Pacific Ocean. Finally, here’s a LoopingIR satelliteimage, making viewable the clouds around the islands 24 hours a day. To help you keep track of where any showers may be around the islands, here’s the latest animatedradar image.
Hawaii’s Mountains – Here’s a link to the live webcam on the summit of near 14,000 footMauna Kea on the Big Island of Hawaii. The tallest peak on the island of Maui is theHaleakala Crater, which is near 10,000 feet in elevation. These two webcams are available during the daylight hours here in the islands…and when there’s a big moon rising just after sunset for an hour or two! Plus, during the nights and early mornings you will be able to see stars, and the sunrise too…depending upon weather conditions.
Tropical Cyclone activity in the eastern and central Pacific – Here’s the latest weather information coming out of the National Hurricane Center, covering the eastern north Pacific. You can find the latest tropical cyclone information for the central north Pacific (where Hawaii is located) by clicking on this link to the Central Pacific Hurricane Center. Here’s a tracking map covering both the eastern and central Pacific Ocean. A satellite image, which shows the entire ocean area between Hawaii and the Mexican coast…can be found here.
Aloha Paragraphs
Beautiful Waimanalo Beach…Oahu
The trade winds will continue to blow across our Hawaiian Islands…increasing a notch now. The small craft wind advisory is still active Tuesday evening across those windiest areas from Oahu down through Maui County…into the Big Island. A 1029 millibar high pressure system to the north-northeast, is the source of our trade winds…as shown on this weather map. Showers, being carried our way by the gusty trade winds, will be rather limited…but may increase as we head towards the weekend along our windward sides. The leeward beaches will remain generally dry, if not totally dry for the time being. This should allow abundant sunshine to be available along our south and west facing beaches. We may see tropical moisture arriving towards the weekend…into early next week.
We see two fairly closely spaced tropical systems in the eastern Pacific, one of which is hurricane Felicia…which will be traveling generally westward towards our central Pacific. We’ll need to keep a close eye on this storm as it enters our area. Here’s atracking map, showing hurricane Felicia…with the Big Island on the left hand side of the map. Here’s a satellite imageshowing Felicia, and tropical storm Enrique, in relation to the Hawaiian Islands. This is the time of year when the central Pacific can find tropical cyclones being most active.
Our main focus through the rest of this work week, will be the tropical cyclone activity in the eastern Pacific…which comes into our central Pacific this weekend. The forecast charts show Felicia coming into our central Pacific as a weakening hurricane on Saturday, after reaching major hurricane status over the next couple of days. If we were to project beyond the outer forecast point, we would see Felicia moving by just south of the Big Island early next week. This could bring blustery weather, with increased rainfall…especially to the islands of Maui and the Big Island.
It’s Tuesday evening here in Kihei, Maui, as I begin writing this last part of today’s narrative.We’ve moved into the peak season for summer hurricane’s here in the central Pacific, so it’s not too surprising that we’re seeing tropical systems moving our way. Hurricane Felicia is a category 2 hurricane, which could exhibit a rapid intensification during the next day or so, bringing it briefly up to a category 3 hurricane. The forecast has Felicia weakening as it moves closer to our islands, dropping down into the less dangerous tropical storm classification. We still have almost a week to track this tropical cyclone before it gets close, and for me at least, I find it very interesting to say the least. ~~~ Back to the moment, Tuesday evening, our weather will be fine through the rest of this work week. The models show a possible increase in showers this weekend, although not associated with Felicia. This may or may not happen, but we have time to see if things are headed that way. ~~~ Speaking of heading that way, I’m about ready to take the drive back upcountry to Kula. I’ll have much more to say about hurricanes and such on Wednesday. I hope you have a great Tuesday night! Aloha for now…Glenn.
Interesting: A moderate earthquake with magnitude of 5.1 rocked eastern parts Indonesia on Tuesday, but noreport of damage or casualties, according to the country’s Meteorology and Geophysics Agency. The quake struck at 08:10 Jakarta time (2310 GMT Monday) with epicenter at 54 km northwest Manokwari of Papua and at 10 km in depth, the agency said.
Indonesia sits on a vulnerable quake-hit zone so called the Pacific Ring of Fire, where two continental plates stretching thatcause often triggers seismic and volcanic movements.
Interesting2:A magnitude-6.5 earthquake hit off Japan’s southern coast Wednesday, the country’s Meteorological Agency said. There were no immediate reports of damage or casualties. The quake hit at 9:18 am (0018 GMT) off the coast of Miyakojima, a southern island near Okinawa, at a depth of 18.6 miles.
Miyakojima is located about 1,240 miles (2,000 kilometers) south of Tokyo. The meteorological agency said there was no fear of a tsunami. Atsushi Kawamitsu, a police official in Miyakojima, said police have received no reports of damage or casualties.
"Nothing fell off from shelves during the quake," Kawamitsu said. Japan is one of the world’s most earthquake-prone countries, and experts believe Tokyo has a 90 percent chance of being hit by a major quake over the next 50 years. In 1995, a magnitude-7.2 quake in the western port city of Kobe killed 6,400 people.
Interesting3:Having a garden on your roof isn’t just nice for a garden party; it can make your city more environmentally friendly. Many American cities are beginning to incorporate greenroofs into their planning ordinances because they recognize that, planting a rooftop garden can offset heat, increase city biodiversity and decrease storm water runoff.
This runoff can be problematic in cities where rainwater is funneled by streets and parking lots directly into streams, carrying with it chemicals and debris and increasing the risk of flash floods. But the plants on greenroofs can absorb some of this water – "like a sponge being saturated," says Olyssa Starry, a graduate student at the University of Maryland at Baltimore County.
Starry studied a greenroof atop a Baltimore building in comparison to a similar building without a greenroof to determine how well the roof would absorb water from frequent storms. By measuring water flowing out of building downspouts, she found that the greenroof retained from 30 to 75 percent of water from storms, compared to a negligible amount retained by the building with no greenroof.
Although her results are preliminary, Starry thinks that cities can reap benefits from making greenroofs a part of their building requirements, as cities like Toronto and Berlin have recently done. Using GIS satellite imagery, she estimated the number and area of buildings that could hold greenroofs within one watershed in the Baltimore area.
If all these roofs were greened, she says, the city could save the watershed 8 million gallons of water per year, or about 10 percent of its yearly water loss. "We need to understand what implementing these greenroofs at the whole watershed scale can do," she says.
"Getting people to learn about this technology and providing incentives is the first step." This research was presented at the Ecological Society of America’s Annual Meeting on August 3, 2009.
Interesting4:US President Barack Obama and his wife Michelle are among the best-dressed people in the world, according to a list published today by Vanity Fair. Mr Obama, previously noted by fashion watchers as an unusually elegant dresser, joins Brad Pitt and James Bond actor Daniel Craig on a list of 10 men.
Michelle Obama, together with Carla Bruni, the wife of French President Nicolas Sarkozy, makes up the list of elegant first ladies. Others said by Vanity Fair to dress well include New York Mayor Michael Bloomberg, actress Anne Hathaway, and Princess Letizia of Asturias, wife of the heir to the Spanish throne.
August 3-4, 2009
Air Temperatures – The following maximum temperatures were recorded across the state of Hawaii Monday afternoon: Lihue, Kauai – 83 Honolulu, Oahu – 89 Kaneohe, Oahu – 84 Kahului, Maui – 86 Hilo, Hawaii – 85 Kailua-kona – 88 Air Temperaturesranged between these warmest and coolest spots near sea level – and on the highest mountains…at 5 p.m. Monday evening:
Port Allen, Kauai – 86F
Hilo, Hawaii- 80
Haleakala Crater – 59 (near 10,000 feet on Maui)
Mauna Kea summit – 57 (near 14,000 feet on the Big Island) Precipitation Totals – The following numbers represent the largest precipitation totals (inches) during the last 24 hours on each of the major islands, as ofMonday afternoon:
0.36 Mount Waialaele, Kauai 0.02 Oahu Forest NWR, Oahu
0.00 Molokai
0.00 Lanai
0.00 Kahoolawe 0.06 West Wailuaiki, Maui 0.29 Mountain View, Big Island
Marine Winds – Here’s the latest (automatically updated) weather mapshowing a 1028 millibar high pressure system to the northeast of the islands. This high pressure cell, along with its associated ridge to our north, will keep the trade winds blowing through Wednesday.
Satellite and Radar Images:To view the cloud conditions we have here in Hawaii, please use the following satellite links, starting off with thisInfrared Satellite Image of the islands to see all the clouds around the state during the day and night. This next image is one that gives close images of the islands only during the daytime hours, and is referred to as a Close-up visible image. This next image shows a larger view of the Pacific…giving perspective to the wider ranging cloud patterns in the Pacific Ocean. Finally, here’s a LoopingIR satelliteimage, making viewable the clouds around the islands 24 hours a day. To help you keep track of where any showers may be around the islands, here’s the latest animatedradar image.
Hawaii’s Mountains – Here’s a link to the live webcam on the summit of near 14,000 footMauna Kea on the Big Island of Hawaii. The tallest peak on the island of Maui is theHaleakala Crater, which is near 10,000 feet in elevation. These two webcams are available during the daylight hours here in the islands…and when there’s a big moon rising just after sunset for an hour or two! Plus, during the nights and early mornings you will be able to see stars, and the sunrise too…depending upon weather conditions.
Tropical Cyclone activity in the eastern and central Pacific – Here’s the latest weather information coming out of the National Hurricane Center, covering the eastern north Pacific. You can find the latest tropical cyclone information for the central north Pacific (where Hawaii is located) by clicking on this link to the Central Pacific Hurricane Center. Here’s a tracking map covering both the eastern and central Pacific Ocean. A satellite image, which shows the entire ocean area between Hawaii and the Mexican coast…can be found here.
Aloha Paragraphs
Hamoa Beach, east Maui
The trade winds will continue to blow across our Hawaiian Islands…with no end in sight. The small craft wind advisory is active Monday evening across only those windiest areas around Maui County, and the Big Island. We find that the high surf advisory along our south facing leeward beaches was dropped Monday afternoon. A 1028 millibar high pressure system to the north-northeast, is the source of our trade winds. Showers will be limited by a low trade wind inversion, with what few showers that do manage to fall…will arrive along our windward sides. The leeward beaches will remain generally dry, if not totally dry. This should allow lots of sunshine to beam down, especially along our leeward sides. Air temperatures will be warm to very warm at sea level.
Two new tropical cyclones have formed in the eastern Pacific Monday, neither of which are a threat to the Hawaiian Islands at the moment. We may need to keep an eye on these storms as they enter our central Pacific later on.Here’s atracking map, showing these two tropical systems…along with now retired Lana to our southwest. Here’s asatellite imageshowing these tropical cyclones in relation to the Hawaiian Islands.
It’s Monday evening here in Kihei, Maui, as I begin writing this last part of this evening’s narrative. As mentioned in the paragraph above, we’ve lost former tropical cyclone Lana here in the central Pacific, but gained two new storms in the eastern Pacific. These storms will be named Enrique, and Felicia, and will become our focus through the next week…as they track more or less in our direction. I’ll have more to say about these two systems each day going forward. ~~~ Back to the present, we have great weather here in the islands now! Our air mass is dry and stable, and the trade winds are blowing, weather conditions that are absolutely normal for this time of year. I see no reason to believe that we’ll see great weather prevailing through the rest of this week, at least the work week. ~~~ I’ll be back here early Tuesday morning with your next new weather narrative from paradise! Aloha for now…Glenn.
Interesting: Seven out of ten U.S. children have low levels of vitamin D, raising their risk of bone and heart disease, according to a study of over 6,000 children by researchers at Albert Einstein College of Medicine of Yeshiva University. The striking findings suggest that vitamin D deficiency could place millions of children at risk for high blood pressure and other risk factors for heart disease.
Vitamin D deficiency was thought to be relatively rare in the U.S. However, recent studies have documented this growing problem in adults. With cases of rickets (a bone disease in infants caused by low vitamin D levels) on the rise, it became clear that many children were also not getting enough of this essential vitamin, which is needed for healthy bone growth, among other biological processes.
"Several small studies had found a high prevalence of vitamin D deficiency in specific populations of children, but no one had examined this issue nationwide," says study leader Michal L. Melamed, M.D., assistant professor of medicine and of epidemiology & population health at Einstein. Dr. Melamed has published extensively on the importance of vitamin D.
Interesting2:The potential for energy-efficiency improvements throughout the U.S. economy is huge and entirely within reach if annual investments increase fivefold, according to a new McKinsey & Company report. The global consulting firm estimates that $520 billion in investments would reduce U.S. non-transportation energy usage by 9.1 quadrillion BTUs by 2020 – roughly 23 percent of projected demand.
As a result, the U.S. economy would save more than $1.2 trillion and avoid the release of some 1.1 gigatons of annual greenhouse gases, an amount equal to replacing 1,000 conventional 500-megawatt coal-fired power plants with renewable energy. "There’s more potential for energy efficiency in this country than anywhere else in the world," said Kenneth Ostrowski, a senior partner at McKinsey.
"If we do nothing, we will waste $1.2 trillion." If the United States applied all available efficiency technologies, the country would save more energy by 2020 than is used annually by all of Canada’s homes, commercial buildings, and industries combined. Several McKinsey recommendations require simple changes.
For example, if all U.S. office buildings turned off their computers at night, or at least switched to standby mode, trillions of BTUs of energy would be unnecessary. Many measures would require substantial evaluations of the energy wastage from buildings or industries.
Potential responses, such as duct sealing, would add insulation to areas where heated and cooled air leaks outdoors. Applying duct sealing to all residential homes would save about 500 trillion BTUs, McKinsey estimates. McKinsey reached its conclusion after an analysis of 675 energy efficiency measures.
The study was supported by utilities, environmental organizations, and the U.S. government. U.S. Environmental Protection Agency (EPA) Administrator Lisa Jackson responded to the report by promoting the government’s appliance-efficiency standard program, Energy Star, and encouraging consumers to improve their own energy efficiency.
"The McKinsey report reveals new possibilities for energy efficiency, and will be instrumental in engaging consumers, businesses, and everyone else to cut energy consumption, reduce harmful emissions, and save money on electricity," Jackson said in a statement.
"The energy that most effectively cuts costs, protects us from climate change, and reduces our dependence on foreign oil is the energy that’s never used in the first place." The U.S. economy currently spends $10-12 billion each year on energy-efficiency measures, McKinsey said. This does not include federally funded programs authorized in the $787 billion economic stimulus act, which President Barack Obama signed in February.
Interesting3:China closed a chemical plant after local residents in central Hunan Province protested against cadmium pollution, which killed two people and affected hundreds of others, media reported on Monday. The closure follows a number of recent high profile "mass incidents" which turned violent and prompted media criticism of officials’ failure to respond quickly.
Two villagers near the Xianghe Chemical Factory, which had produced zinc sulfate for six years, died in May and June. Autopsies found high levels of cadmium in their bodies, the semi-official China News Agency said.
Tests conducted after their deaths found that over 500 out of nearly 3,000 local residents also had elevated levels of cadmium in their urine, it added. Around 30 people were admitted to hospital after checkups, Hong Kong media reported.
Interesting4:Nissan Motor Co took the wraps off its much-awaited electric car on Sunday, naming the hatchback "Leaf" and taking a step toward its goal of leading the industry in the zero-emissions field. Japan’s No.3 automaker and its French partner, Renault SA, have been the most aggressive proponents of pure electric vehicles in the auto industry, announcing plans to mass-market the clean but expensive cars globally in 2012.
Nissan will begin selling the first Leaf cars in the United States, Japan and Europe toward the end of 2010, adding two more models soon after. It expects production to start with around 200,000 units a year at the global roll-out in 2012.
Twinning the car’s unveiling with the inauguration of Nissan’s new global headquarters in Yokohama, south of Tokyo, Chief Executive Carlos Ghosn drove up to a stage in a sky-blue Leaf prototype, carrying former Japanese Prime Minister Junichiro Koizumi and two other guests to greet a throng of journalists who made the trip from all over the world.
"We celebrate today the start of a new chapter of our company’s life," Ghosn said. Nissan is returning to the port city of Yokohama, where it was founded in 1933, after being based in Tokyo’s posh Ginza district for the last 41 years.
Interesting5:The kelp, known as wakame (pronounced wa-KA-me), is on a list of "100 of the World’s Worst Invasive Alien Species," compiled by the Invasive Species Specialist Group. Since her discovery in May, Dr. Zabin and colleagues have pulled up nearly 140 pounds of kelp attached to pilings and boats in the San Francisco Marina alone.
Every year the damage wrought by aquatic invaders in the United States and the cost of controlling them is estimated at $9 billion, according to a 2003 study by a Cornell University professor, David Pimentel, whose research is considered the most comprehensive.
The bill for controlling two closely-related invasive mussels — the zebra and the quagga — in the Great Lakes alone is $30 million annually, says the United States Federal Aquatic Nuisance Species Task Force.
Many scientists say that San Francisco Bay has more than 250 nonnative species, like European green crab, Asian zooplankton and other creatures and plants that out compete native species for food, space and sunlight.
Interesting6:New research by a team of scientists from Scripps Institution of Oceanography at UC San Diego and the U.S. Geological Survey (USGS) offers new insight into the San Andreas Fault as it extends beneath Southern California’s Salton Sea. The team discovered a series of prominent faults beneath the sea, which transfer motion away from the San Andreas Fault as it disappears beneath the Salton Sea.
The study provides new understanding of the intricate earthquake faults system beneath the sea and what role it may play in the earthquake cycle along the southern San Andreas Fault.
"The stretch of the San Andreas Fault that extends into the Salton Sea is an important part of the overall fault system but it remains poorly understood," said Danny Brothers, a Scripps graduate student and lead author on the study.
"Our results provide crucial information on how deformation is transferred from the San Andreas Fault to the Imperial Fault and how young basins along strike-slip faults, such as the Salton Sea, evolve through time."
In a study published in the July 26 early online edition of the journal Nature Geoscience, the Scripps-led research team including Brothers, Neal Driscoll, Graham Kent, Alistair Harding, Jeff Babcock and Rob Baskin, from the USGS, used geophysical methods to image the faults beneath the Salton Sea.
This study offers new information on the location of faults and how they communicate tectonic deformation with neighboring faults located onshore. The Salton Sea is flanked by two major faults – the San Andreas and San Jacinto – and recent studies have revealed that the region has experienced magnitude-7 earthquakes roughly every 200 years for the last thousand years. Previous studies conducted by researchers at San Diego State University and Cal Tech indicate that it has been approximately 300 years since the last rupture.
Interesting7:A recent report published in July’s Nature Reviews Cancer reveals the consequences of improper disposal and dumping. According to "Wildlife Cancer: a conservation perspective," scientists are now concerned about humans’ contribution to carcinogenesis in wild animal habitats. "The more we contaminate the environment, the more we will see problems.
If you dump a pollutant, it doesn’t just go away," Frances Gulland, director of veterinary science at the Marine Mammal Center in Sausalito, Calif., tells Newsweek. According to Gulland, the problem is shockingly evident in the famous barking male sea lions on San Francisco’s Pier 39. He says he periodically receives calls about crippling tumors on the sea lions, and 17 percent of these sea lions die of renal failure or paralysis.
August 2-3, 2009
Air Temperatures – The following maximum temperatures were recorded across the state of Hawaii Sunday afternoon: Lihue, Kauai – 83 Honolulu, Oahu – 90 Kaneohe, Oahu – 84 Kahului, Maui – 88 Hilo, Hawaii – 85 Kailua-kona – 88 Air Temperaturesranged between these warmest and coolest spots near sea level – and on the highest mountains…at 5 p.m. Sunday evening:
Port Allen, Kauai – 86F
Hilo, Hawaii- 78
Haleakala Crater – 55 (near 10,000 feet on Maui)
Mauna Kea summit – 41 (near 14,000 feet on the Big Island) Precipitation Totals – The following numbers represent the largest precipitation totals (inches) during the last 24 hours on each of the major islands, as ofSunday afternoon: 0.86 Mount Waialaele, Kauai 0.35 Oahu Forest NWR, Oahu
0.00 Molokai
0.00 Lanai
0.00 Kahoolawe 1.01 West Wailuaiki, Maui 0.31 Kamuela upper, Big Island
Marine Winds – Here’s the latest (automatically updated) weather mapshowing a 1027 millibar high pressure system to the northeast of the islands. This high pressure cell, along with its associated ridge to our north, will keep the trade winds blowing through Tuesday. Tropical depression Lana is now to the southwest of the state.
Satellite and Radar Images:To view the cloud conditions we have here in Hawaii, please use the following satellite links, starting off with thisInfrared Satellite Image of the islands to see all the clouds around the state during the day and night. This next image is one that gives close images of the islands only during the daytime hours, and is referred to as a Close-up visible image. This next image shows a larger view of the Pacific…giving perspective to the wider ranging cloud patterns in the Pacific Ocean. Finally, here’s a LoopingIR satelliteimage, making viewable the clouds around the islands 24 hours a day. To help you keep track of where any showers may be around the islands, here’s the latest animatedradar image.
Hawaii’s Mountains – Here’s a link to the live webcam on the summit of near 14,000 footMauna Kea on the Big Island of Hawaii. The tallest peak on the island of Maui is theHaleakala Crater, which is near 10,000 feet in elevation. These two webcams are available during the daylight hours here in the islands…and when there’s a big moon rising just after sunset for an hour or two! Plus, during the nights and early mornings you will be able to see stars, and the sunrise too…depending upon weather conditions.
Tropical Cyclone activity in the eastern and central Pacific – Here’s the latest weather information coming out of the National Hurricane Center, covering the eastern north Pacific. You can find the latest tropical cyclone information for the central north Pacific (where Hawaii is located) by clicking on this link to the Central Pacific Hurricane Center. Here’s a tracking map covering both the eastern and central Pacific Ocean. A satellite image, which shows the entire ocean area between Hawaii and the Mexican coast…can be found here.
Aloha Paragraphs
Tropical depression Lana – south of Hawaii
We’ll see the blustery trade winds easing back a little as we move into the new work week. The trade winds are expected to decrease enough soon, that the small craft wind advisory has been pared back some across Hawaii’s coastal and channel waters. We find that the high surf advisory along our south and west facing leeward beaches continues Sunday evening. We should find that the breezy trade winds continue well into the new week, while the high surf conditions should be gone by Monday…if not sooner. The overlying atmosphere across the islands is dry and stable now, with the majority of showers falling over the windward coasts and slopes…into the new work week ahead. The leeward beaches will remain generally dry, if not totally dry. The high clouds streaming off the tops of thunderstorms around tropical depression Lana, will likely diminish as we move into Monday. These clouds should produce some nice sunrise and sunset colors before they depart.
Weakening tropical depression Lana will be moving away southwest of our Hawaiian Islands, with little direct influence on our local weather circumstances.Here’s atracking map, showing her expected course of travel to our southwest. The most pronounced effect we saw was a fairly minor surge in our local trade wind speeds Sunday. Here’s asatellite imageshowing this tropical cyclone to the south of the Hawaiian Islands.This weakening tropical cyclone will pass by southwest of Kauai Monday into Tuesday.
It’s Sunday evening here in Kula, Maui, as I begin writing this last part of today’s narrative. The paragraph above gives the main points about tropical depression Lana, in case you skipped over that section. Here’s a looping satellite image of this depression down to the south of Hawaii Sunday evening. You can see the clouds spreading northeast from the center of this weakening area of thunderstorms, associated with Lana. This is a good sign, showing that the upper level winds are shearing the top portions of this storm…which in turn is causing a fairly dynamic weakening of the system. The latest forecast has this tropical depression diminishing into a remnant low pressure system soon.
~~~ I’ll be back back again early Monday morning with your next new weather narrative. I hope you have a great Sunday night from wherever you happen to be reading! Aloha for now…Glenn.
Interesting: Next time you go for a dip in the sea, bear in mind that your deft front crawl is helping to mix up the waters. In fact, marine life may be stirring the oceans and moving nutrients around as much as winds or tides. According to a theory proposed by Darwin’s grandson, Charles Galton Darwin, a body moving through water drags some of the fluid with it.
In "Darwin drift", a high-pressure zone forms at the front of each swimming animal, leaving an area of lower pressure behind, which draws in adjacent water. This results in a net movement of fluid in the direction of the swimmer.
To test the idea, Kakani Katija and John Dabiri at the California Institute of Technology in Pasadena went to a lake in the Republic of Palau in the Pacific Ocean. Diving among swarms of jellyfish, the pair used suspended dyes and a newly designed laser velocimeter to measure the movement of water around the jellyfish.
They found that the animals did indeed drag water with them as they swam (Nature, vol 460, p 624). The researchers then estimated the total energy that all ocean swimmers impart on the water. They calculated that it was on a par with the mixing energy imparted by winds or tides. The findings suggest ocean swimmers can move water over long distances and that they could help run the vertical currents that push nutrients around between the sea floor and surface waters.
Interesting2:You probably hadn’t noticed — but the head shape and overall size of rodents has been changing over the past century. A University of Illinois at Chicago ecologist has tied these changes to human population density and climate change.
The finding is reported by Oliver Pergams, UIC research assistant professor of biological sciences, in the July 31 issue of PLoS One. Pergams said that such size-and-shape changes in mammals, occurring around the world in less than a century, are quite substantial.
He had done earlier studies on a century’s worth of anatomic changes between two geographically isolated rodents — Channel Island deer mice from coastal California and white-footed mice northwest of Chicago — and noted fast change among both.
"I suspected they weren’t unique examples," he said. "I wondered whether these changes were occurring elsewhere, whether they were global in nature, and what some of the causes may be."
Pergams examined specimen rodents from museums around the world, including the big collections held at Chicago’s Field Museum and the Smithsonian in Washington. Altogether, he recorded more than 17,000 body and skull measurements from 1,300 specimens from 22 locations in Africa, the Americas and Asia.
The animals were collected from 1892 to 2001, and Pergams compared those from before 1950 to those collected after. He also compared specimens gathered from sparsely populated islands to those from the mainland, where human populations were denser.
Pergams found both increases and decreases in the 15 anatomic traits he measured, with changes as great as 50 percent over 80 years. Ten of the 15 traits were associated with changes in human population density, current temperature, or trends in temperature and precipitation.
"Rapid change, contrary to previous opinion, really seems to be happening quite frequently in a number of locations around the world," Pergams said. "There seem to be significant correlations with ‘people-caused’ parameters, such as population density and anthropologically-caused climate change."
Interesting3:Comets have contained vast amounts of liquid water in their interiors during the first million years of their formation, a new study claims. The watery environment of early comets, together with the vast quantity of organics already discovered in comets, would have provided ideal conditions for primitive bacteria to grow and multiply.
So argue Professor Chandra Wickramasinghe and his colleagues at the Cardiff Centre for Astrobiology in a paper published in the International Journal of Astrobiology. The Cardiff team has calculated the thermal history of comets after they formed from interstellar and interplanetary dust approximately 4.5 billion years ago.
The formation of the solar system itself is thought to have been triggered by shock waves that emanated from the explosion of a nearby supernova. The supernova injected radioactive material such as Aluminium-26 into the primordial solar system and some became incorporated in the comets.
Professor Chandra Wickramasinghe together with Drs Janaki Wickramasinghe and Max Wallis claim that the heat emitted from radioactivity warms initially frozen material of comets to produce subsurface oceans that persist in a liquid condition for a million years. Professor Wickramasinghe said:
"These calculations, which are more exhaustive than any done before, leaves little doubt that a large fraction of the 100 billion comets in our solar system did indeed have liquid interiors in the past. Comets in recent times could also liquefy just below their surfaces as they approach the inner solar system in their orbits.
Evidence of recent melting has been discovered in recent pictures of comet Tempel 1 taken by the "Deep Impact" probe in 2005." The existence of liquid water in comets gives added support for a possible connection between life on Earth and comets. The theory, known as cometary panspermia, pioneered by Chandra Wickramasinghe and the late Sir Fred Hoyle argues the case that life was introduced to Earth by comets.
Interesting4:Scientists have joined forces in a groundbreaking assessment on the status of marine fisheries and ecosystems. The two-year study, led by Boris Worm of Dalhousie University and Ray Hilborn of the University of Washington and including an international team of 19 co-authors, shows that steps taken to curb overfishing are beginning to succeed in five of the ten large marine ecosystems that they examined.
The paper, which appears in the July 31 issue of the journal Science, provides new hope for rebuilding troubled fisheries. The study had two goals: to examine current trends in fish abundance and exploitation rates (the proportion of fish taken out of the sea) and to identify which tools managers have applied in their efforts to rebuild depleted fish stocks.
The work is a significant leap forward because it reveals that the rate of fishing has been reduced in several regions around the world, resulting in some stock recovery. Moreover, it bolsters the case that sound management can contribute to the rebuilding of fisheries elsewhere. It’s good news for several regions in the U.S., Iceland and New Zealand.
"These highly managed ecosystems are improving" says Hilborn. "Yet there is still a long way to go: of all fish stocks that we examined sixty-three percent remained below target and still needed to be rebuilt." "Across all regions we are still seeing a troubling trend of increasing stock collapse," adds Worm. "But this paper shows that our oceans are not a lost cause.
The encouraging result is that exploitation rate – the ultimate driver of depletion and collapse – is decreasing in half of the ten systems we examined in detail. This means that management in those areas is setting the stage for ecological and economic recovery. It’s only a start – but it gives me hope that we have the ability to bring overfishing under control."
The authors caution that their analysis was mostly confined to intensively managed fisheries in developed countries, where scientific data on fish abundance is collected. They also point out that some excess fishing effort is simply displaced to countries with weaker laws and enforcement capacity.
While most of the fisheries that showed improvement are managed by a few wealthy nations, there are some notable exceptions. In Kenya, for example, scientists, managers, and local communities have teamed up to close some key areas to fishing and restrict certain types of fishing gear.
This led to an increase in the size and amount of fish available, and a consequent increase in fishers’ incomes. "These successes are local – but they are inspiring others to follow suit," says Tim McClanahan of the Wildlife Conservation Society in Kenya.
"We know that more fish can be harvested with less fishing effort and less impact on the environment, if we first slow down and allow overfished populations to rebuild," adds co-author Jeremy Collie from the University of Rhode Island. "Scientists and managers in places as different as Iceland and Kenya, have been able to reduce overfishing and rebuild fish populations despite serious challenges."
Interesting5:Wild spider monkeys now have a new tool under their proverbial belt: a body scratcher that may release medicinal compounds, according to a study published in the latest issue of the journal Primates. The study is the first to report this spider monkey scratcher. Lead author Stacy Lindshield told Discovery News that two other instances of the use of objects as tools by the social monkeys have been documented.
"Spider monkeys have been observed rubbing crushed and chewed leaves on their bodies," said Lindshield, a researcher in Iowa State University’s Ecology and Evolutionary Biology Graduate Program. She explained that the smelly practice may "play a role in olfactory communication."
"Second, spider monkeys are known to break off branches and drop them on or near human observers," she added, "so it’s not a good idea to be directly beneath these guys!" She and co-author Michelle Rodrigues collected observational data on wild spider monkeys at El Zota Biological Field Station in northeastern Costa Rica.
They documented three instances where the monkeys used the scratcher tool. The first to scratch was an adult female. Holding a small, leafy branch in her hand, she scratched her chest and abdominal regions. The second, another adult female, used a detached stick lacking side branches and leaves to scratch her left side. She chewed the tool tip between bouts.
The third individual, a juvenile female, first chewed the distal tip of a stick before scratching the underside of her tail and her genital region. The scientists think that by modifying the scratcher tip, the monkeys could be providing "more relief and comfort during scratching."
The chewing alteration could "also be related to the chemical properties of the selected plant, as research on fur-rubbing and self-medication indicates that some primates select plants or invertebrates with chemical properties for this reason."
Like a human slathering on scented ointment, the plants may then be providing soothing compounds. Since the monkeys aren’t just scratching hard-to-reach spots, they could also be stimulating their own scent production glands, which are involved in nose-detecting communication.
Interesting6:There’s no question that the world’s fish are in trouble. Fishermen are pulling fish out of the seas far faster than these populations can grow back. Some fisheries are heading toward collapse or even extinction. But a major new analysis of this grim picture shows that fisheries aren’t doomed.
In fact, some are on the mend. This new study grew out of a raging controversy. Three years ago, Boris Worm and his colleagues at Dalhousie University in Canada sent shock waves through the world of fishing and fisheries science.
They published a paper in Science magazine showing that if current trends continued, the oceans would be essentially fished out by the middle of this century. Worm says this new analysis relies on much more scientific data to assess the state of the world’s fisheries.
And it is still not an upbeat report. Some of the good-news stories come from the United States. Strict federal fishing laws have cut back significantly on overfishing. And some stocks, such as haddock off New England, have rebounded so well, they are actually as healthy as they’ve ever been. Iceland, too, has rebuilt some of its fisheries.


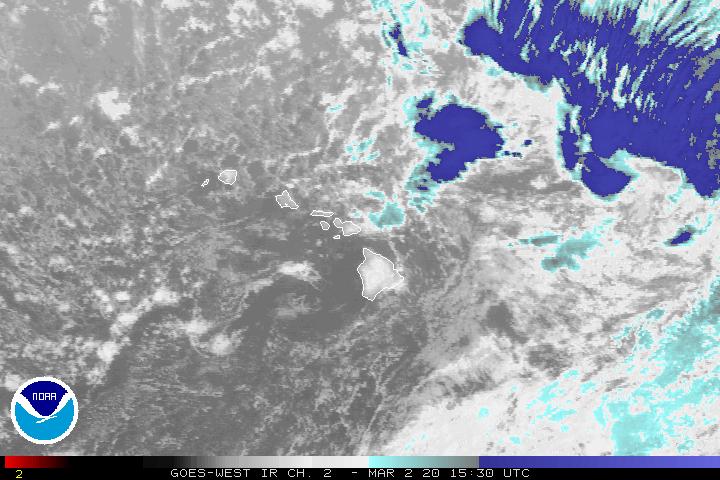


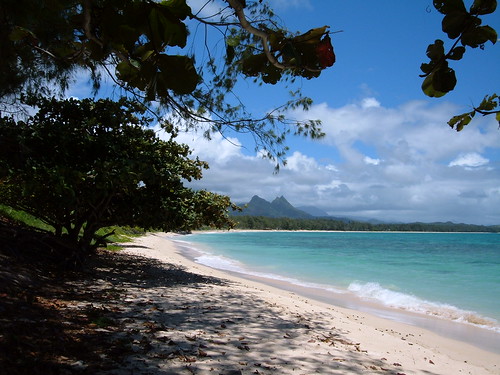


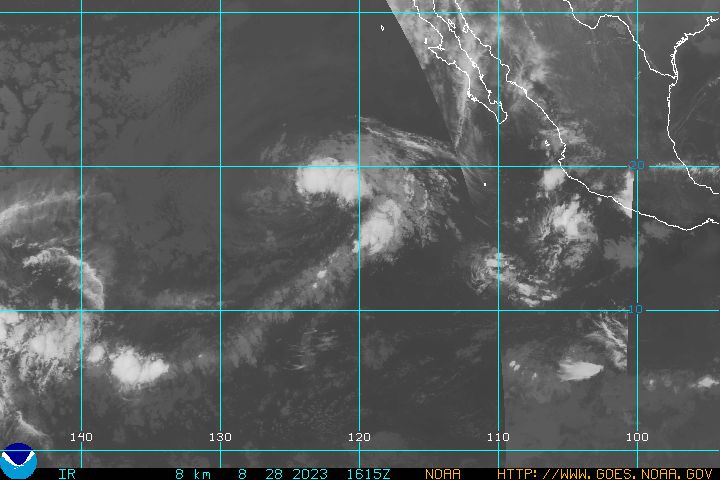