July 21-22, 2009
Air Temperatures – The following maximum temperatures were recorded across the state of Hawaii Tuesday afternoon: Lihue, Kauai – 84 Honolulu, Oahu – 88 Kaneohe, Oahu – 83 Kahului, Maui – 86 Hilo, Hawaii – 84 Kailua-kona – 86 Air Temperaturesranged between these warmest and coolest spots near sea level – and on the highest mountains…at 5 p.m. Tuesday evening:
Port Allen, Kauai – 86F
Kapalua, Maui – 77
Haleakala Crater – 55 (near 10,000 feet on Maui)
Mauna Kea summit – 68 (near 14,000 feet on the Big Island) Precipitation Totals – The following numbers represent the largest precipitation totals (inches) during the last 24 hours on each of the major islands, as ofTuesday afternoon: 0.38 Mount Waialaele, Kauai
0.60 Manoa Valley, Oahu
0.21 Molokai
0.00 Lanai
0.00 Kahoolawe 0.33 Puu Kukui, Maui 0.13 Hilo airport, Big Island
Marine Winds – Here’s the latest (automatically updated) weather mapshowing that high pressure systems remain active to the north of the islands Wednesday. These high pressure cells will keep the trade winds blowing into Wednesday…although gradually becoming lighter as a trough of low pressure moves across the state through Thursday.
Satellite and Radar Images:To view the cloud conditions we have here in Hawaii, please use the following satellite links, starting off with thisInfrared Satellite Image of the islands to see all the clouds around the state during the day and night. This next image is one that gives close images of the islands only during the daytime hours, and is referred to as a Close-up visible image. This next image shows a larger view of the Pacific…giving perspective to the wider ranging cloud patterns in the Pacific Ocean. Finally, here’s a LoopingIR satelliteimage, making viewable the clouds around the islands 24 hours a day. To help you keep track of where any showers may be around the islands, here’s the latest animatedradar image.
Hawaii’s Mountains – Here’s a link to the live webcam on the summit of near 14,000 footMauna Kea on the Big Island of Hawaii. The tallest peak on the island of Maui is theHaleakala Crater, which is near 10,000 feet in elevation. These two webcams are available during the daylight hours here in the islands…and when there’s a big moon rising just after sunset for an hour or two! Plus, during the nights and early mornings you will be able to see stars, and the sunrise too…depending upon weather conditions.
Tropical Cyclone activity in the eastern and central Pacific – Here’s the latest weather information coming out of the National Hurricane Center, covering the eastern north Pacific. You can find the latest tropical cyclone information for the central north Pacific (where Hawaii is located) by clicking on this link to the Central Pacific Hurricane Center. Here’s a tracking map covering both the eastern and central Pacific Ocean. A satellite image, which shows the entire ocean area between Hawaii and the Mexican coast…can be found here.
Aloha Paragraphs
Love that warm ocean…wow that color!
The trade winds remain rather blustery Tuesday, but will gradually get lighter over the next couple of days. We still find those two near 1029 millibar high pressure systems to the northwest of the islands Tuesday evening. Forecast charts continue to show our trades tapering off considerably during the second half of this week.This will bring us into a convective weather pattern, with humid conditions prevailing into the weekend. Fortunately, these sultry conditions won’t last long, as the trade winds fill back into our Hawaiian Islands weather picture thereafter. By the way, the NWS issued small craft wind advisory has been pared back again, now covering only the area from Maui County down to the Big Island.
Look for some increase in our shower activity, starting off first on the Big Island…then further into the state over the next several days. An area of moist air is coming our way, which will start off falling along our windward sides. Eventually though, as this moisture combines with the faltering trade winds, those showers will likely shift over to the mountains during the afternoon hours. The greatest likelihood of showers will be Thursday into the weekend, generally in the leeward upcountry areas. If the trade winds return as expected late this weekend or early next week, the emphasis for showers will return to the windward sides then. If we get back into alignment with climatology next week, we should see fairly normal trade wind weather conditions returning.
As noted above, showers will be at a minimum Tuesday, and probably into at least part of Wednesday in most areas. Later Wednesday into the upcoming weekend…should be a different story, as the aforementioned surge of moisture works its way over our islands from the deeper tropics. This will prime the pump so to speak, setting the stage for a possible increase in showers over and around the mountains generally. This last part of the work week will be a muggy one, with all that moisture around, and very little wind to provide relief from the heat. The winds may even take on a southeast orientation, which could carry some volcanic haze up over some parts of the island chain.
It’s Tuesday evening here in Kihei, Maui, as I begin writing this last part of today’s narrative. As expected, Tuesday was another nice day, albeit it on the windy side here and there. Case in point, at 5pm this evening, that windy Maalaea Bay on Maui was experiencing 44 mph wind gusts! Those gusts on the high side, were in contrast to the 9 mph winds at both the Hilo and Kona airports! As I was mentioning in one of the paragraphs above, we have a large area of tropical moisture making its way towards the islands, located to the east and southeast of the Big Island. Here’s a satellite image, showing this area. I’ll have more to say about that early Wednesday morning, when I come back online with your next new weather narrative. By the way, we’ll see larger surf rolling in along our leeward beaches Wednesday, and we have high surf advisory flags up now in anticipation of those potentially dangerous breakers…be careful! ~~~ I’m just about ready to take the drive back upcountry to Kula now. I hope you have a great Tuesday night from wherever you happen to be reading from! Aloha for now…Glenn.
Interesting:Dust clouds generated by a huge dust storm in China’s Taklimakan desert in 2007 made more than one full circle around the globe in just 13 days, a Japanese study using a NASA satellite has found. When the cloud reached the Pacific Ocean the second time, it descended and deposited some of its dust into the sea, showing how a natural phenomenon can impact the environment far away.
"Asian dust is usually deposited near the Yellow Sea, around the Japan area, while Sahara dust ends up around the Atlantic Ocean and coast of Africa," said Itsushi Uno of Kyushu University’s Research Institute for Applied Mechanics. "But this study shows that China dust can be deposited into the (Pacific Ocean)," he told Reuters by telephone.
"Dust clouds contain 5 percent iron that is important for the ocean." In a paper published in Nature Geoscience, scientists described how they used a NASA satellite and mathematical modeling to track and measure the movement of the dust cloud, which formed after the dust storm on May 8-9 in 2007. The desert is in the Chinese northwestern region of Xinjiang.
The researchers, led by Uno, found that the dust clouds were lifted 8-10 km (5-6 miles) above the earth’s surface, and transported more than one full circle around the earth. "The most important achievement is that we tracked this through one full circuit round the globe, nobody has done this before.
After half a circuit, usually the dust concentration gets very low and you can’t track it," Uno told Reuters. "This means that dust concentration, dust lifetime is very long, more than two weeks." The dust cloud measured about 3 km (1.9 miles) vertically and up to 2,000 km horizontally and it stayed that way even after one full trip around the globe.
"The reason why the cloud structure was very well maintained was because the dust was uplifted … where the atmosphere is very stable," Uno said. Researchers believe dust particles trigger the formation of high-altitude cirrus clouds — although experts have no idea whether such clouds warm or cool the earth.
Interesting2:Scientists in California have set up a unique experiment to track the life histories of some of the world’s oldest and tallest trees. The project is designed to follow up research, in the Yosemite National Park, which suggests that giant trees are perishing as a result of climate change.
An analysis of data collected over 60 years has led scientists from the University of Washington and the Yosemite Field Station of the US Geological Survey, to conclude that the density of large diameter trees fell by 24% between the 1930s and 1990s.
"We want to identify the reasons for tree mortality and if those are changing," says Dr James Lutz, a research associate at the university’s College of Forest Resources. Little research has been done on a long-term basis to monitor the lives of large trees.
Unlike studies with smaller plants and almost all animals, no individual scientist is able to track a forest giant for its entire lifespan – from germination to death. They live for hundreds of years and play a vital role in the ecosystem long after they have died.
Yosemite National Park is a vast area of wilderness covering 3,027 sq km (1,169 square miles), 321km (200 miles) from San Francisco. The park is best known for its breathtaking waterfalls, black bears and ancient giant sequoias, which are part of the redwood family of trees.
Interesting3:The Massachusetts Institute of Technology has launched a new program that calls on New York and Seattle residents to voluntarily tag their trash. Known as Trash Track, the program will distribute electronic garbage tags in order to track the journey of discarded products through the waste stream.
The tags will be wireless location markers and will be attached at random to thousands of products in the two cities. The system will record not only the current location of a product, but it will also track how long it has been in the waste stream.
In addition to analyzing the data, MIT will make the information available to the public in exhibits at the Architectural League in New York and the Seattle Public Library. These exhibits will begin in September.
Interesting4:Searing desert heat off the Sahara swept right to the normally cool Atlantic coast of Morocco on Monday and Tuesday. At the airport of Agadir, the temperature on Monday soared to a fiery 119 degrees, or nearly 30 degrees above the normal daily high. Farther north, the city of Casablanca sweltered.
The nearby town of Nouasser registered 117 degrees on Monday afternoon followed by readings into the 110s again on Tuesday. The capital city, Rabat, fared almost as badly. High temperatures on both Monday and Tuesday were 113 degrees, this notwithstanding a normal high temperature near 80 degrees.
Elsewhere, Marrakech was as hot as 114 degrees on Monday afternoon, and Fez reached 110 degrees on both Monday and Tuesday. Driving the withering blast was a southeasterly, off-shore wind off the Sahara. Not only did the hot winds block the usual cooling sea breeze, they were further heated in wafting down slope from the Atlas Mountains.
Interesting5:The National Oceanic and Atmospheric Administration (NOAA) has reported findings of preliminary analysis from the agency’s National Climatic Data Center in Asheville, North Carolina that shows global ocean surface temperatures for June broke the previous record set in 2005.
The combined average global/land and ocean surface temperature for June was the second warmest on record, 1.12 degrees Fahrenheit (0.62 degrees Celsius) above the 20th century average of 59.9 degrees F. Ocean surface temperatures for June ’09 were the warmest on record, 1.06 degrees F (0.59 degrees C) above the 20th century average of 61.5 degrees F.
The global land surface temperature for June was 1.26 degrees F above the 20th century average, and the sixth warmest June on record.
Interesting6:Two new sister lines of rice are defying rice’s reputation as a thirsty crop as they demonstrate their improved productivity in drought-prone regions of India and the Philippines. Rice Today’s July-September 2009 edition features the development of drought-tolerant rice and other research the International Rice Research Institute (IRRI) and its collaborators are doing to curb the devastating effects of drought.
With some degree of water shortages predicted to affect 15-20 million hectares of irrigated rice within 25 years, smart crop management and even genetically modified rice may also play a role in helping farmers cope with the crisis. Rice Today also reports that in Uganda rice production has increased 2.5 times from 2004 to 2008 through government initiatives, private investment, and farmer support.
Across the other side of the planet rice production, consumption, and prospects in Latin America are being explored. Rice is being promoted to consumers in Mexico and Central America and in Brazil production is improving. In light of further boosting production, IRRI takes a look at some practical solutions to help reduce grain losses and improve grain quality during postharvest. Between 15-20% of rice grains are often lost at this stage because of unsuitable drying techniques, pests, and other factors.
Interesting7:The dark bruise that appeared suddenly near the south pole of Jupiter several days ago, likely as the result of an impact by a comet or asteroid, is as big as the Pacific Ocean, astronomers report. The dark spot was first noticed by chance by amateur astronomer Anthony Wesley in Australia on Sunday, July 19.
The blemish is thought to be the result of an impact similar to that of Comet Shoemaker-Levy 9, which pummeled the gas giant 15 years ago. After he was convinced the spot was not just another storm or the shadow of one of Jupiter’s moons, Wesley alerted other astronomers around the world to the scar’s appearance.
University of California, Berkeley, astronomer Paul Kalas took advantage of previously scheduled observing time on the Keck II telescope in Hawaii to image the blemish in the early morning hours of Monday, July 20. The near-infrared image showed a bright spot in the clouds of Jupiter’s southern hemisphere, where the impact had propelled reflective particles high into the relatively clear stratosphere.
In visible light, the bruise appears dark against the bright surface of Jupiter. These observations mark only the second time that astronomers have been able to see the results of an impact on the planet, the first being Comet Shoemaker-Levy 9’s collision. Many theories were formed after that collision. "Now we have a chance to test these ideas on a brand new impact event," Kalas, said. Kalas and his colleagues hope their observations will shed light on the nature of the impact.
"The analysis of the shape and brightness of the feature will help in determining the energy and the origin of the impactor," said Marchis. "We don’t see other bright features along the same latitude, so this was most likely the result of a single asteroid, not a chain of fragments like for SL9 [Comet Shoemaker-Levy 9]."
Mike Wong, a UC Berkeley researcher currently on leave at the Space Telescope Science Institute in Baltimore, used the observations to calculate that the bruise is near the southern pole of Jupiter (305 degrees west longitude and 57 degrees south latitude in planetographic coordinates) and that the impact covers a 190-million-square-kilometer area, as big as the Pacific Ocean.
Because of the complex shape of the explosion, it is possible that tidal effects (the gravitational tugs of Jupiter and its moons) fragmented the impactor – a comet or asteroid – shortly before it collided with the planet.
July 20-21, 2009
Air Temperatures – The following maximum temperatures were recorded across the state of Hawaii Monday afternoon: Lihue, Kauai – 83 Honolulu, Oahu – 88 Kaneohe, Oahu – 84 Kahului, Maui – 87 Hilo, Hawaii – 83 Kailua-kona – 86 Air Temperaturesranged between these warmest and coolest spots near sea level – and on the highest mountains…at 4 p.m. Monday afternoon:
Port Allen, Kauai – 88F
Princeville, Kauai – 79
Haleakala Crater – 54 (near 10,000 feet on Maui)
Mauna Kea summit – missing (near 14,000 feet on the Big Island) Precipitation Totals – The following numbers represent the largest precipitation totals (inches) during the last 24 hours on each of the major islands, as ofMonday afternoon:
0.10 Mount Waialaele, Kauai 0.02 Waimanalo, Oahu
0.00 Molokai
0.00 Lanai
0.00 Kahoolawe 0.02 Hana airport, Maui 0.05 Honaunau, Big Island
Marine Winds – Here’s the latest (automatically updated) weather mapshowing two 1029 millibar high pressure systems to the northwest of the islands Tuesday. These high pressure cells will keep the trade winds blowing into Wednesday…although gradually becoming lighter.
Satellite and Radar Images:To view the cloud conditions we have here in Hawaii, please use the following satellite links, starting off with thisInfrared Satellite Image of the islands to see all the clouds around the state during the day and night. This next image is one that gives close images of the islands only during the daytime hours, and is referred to as a Close-up visible image. This next image shows a larger view of the Pacific…giving perspective to the wider ranging cloud patterns in the Pacific Ocean. Finally, here’s a LoopingIR satelliteimage, making viewable the clouds around the islands 24 hours a day. To help you keep track of where any showers may be around the islands, here’s the latest animatedradar image.
Hawaii’s Mountains – Here’s a link to the live webcam on the summit of near 14,000 footMauna Kea on the Big Island of Hawaii. The tallest peak on the island of Maui is theHaleakala Crater, which is near 10,000 feet in elevation. These two webcams are available during the daylight hours here in the islands…and when there’s a big moon rising just after sunset for an hour or two! Plus, during the nights and early mornings you will be able to see stars, and the sunrise too…depending upon weather conditions.
Tropical Cyclone activity in the eastern and central Pacific – Here’s the latest weather information coming out of the National Hurricane Center, covering the eastern north Pacific. You can find the latest tropical cyclone information for the central north Pacific (where Hawaii is located) by clicking on this link to the Central Pacific Hurricane Center. Here’s a tracking map covering both the eastern and central Pacific Ocean. A satellite image, which shows the entire ocean area between Hawaii and the Mexican coast…can be found here.
Aloha Paragraphs
Cruising between the islands
The trade winds will blow through this first part of the week, then falter quite a bit for a few days…gradually returning over the weekend into next week.We find two 1029 millibar high pressure systems to the northwest of the islands Monday evening. These two high pressure cells are the source of our gusty winds…and seem to be trying to merge together.Forecast charts show our trades tapering off considerably during the second half of the work week.This will bring us into a convective weather pattern, with muggy conditions for several days thereafter. Fortunately, these overly moist conditions won’t last long, as the trade winds fill back into our Hawaiian Islands weather picture over the weekend.
The atmosphere over the islands is dry and stable now, and will remain that way into mid-week, at which point a slug of moisture from the deeper tropics will arrive. This moist air mass, combined with the faltering trade winds, will make our air mass more shower prone. The greatest likelihood of showers Wednesday through Friday, will be during the afternoons in the leeward upcountry areas. If the trade winds return as expected, over the weekend, the emphasis for showers will return to the windward sides. Meanwhile, as this satellite imageshows, we have waves of high cirrus clouds to our south…which are being carried northward over us.
Our weather here in the in the islands will remain very nice through Tuesday…and probably into the first part of Wednesday too. Showers will be few and far between through Tuesday, and perhaps into part of Wednesday. Thursday and Friday will be a different story though, as a surge of moisture from the tropics works it way over our islands from the east or southeast. This will prime the pump so to speak, setting the stage for a possible increase in showers over and around the mountains generally. This last part of the work week will be a muggy affair, with all that moisture around, and very little wind to provide relief from the heat. The winds may even take on a southeast orientation, which could carry some volcanic haze up over some parts of the islands…time will tell.
It’s Monday evening here in Kihei, Maui, as I begin writing the last part of today’s narrative. This should be an interesting week, not exactly normal in several ways. The unusual aspects are likely to be the slacking off of our trade winds later this week, and the possible increase in showers later on too. Here on Monday, the winds are still blowing, and rainfall is at a minimal to say the least. We still those high cirrus clouds, which will more than likely provide us with a great sunset this evening, and if they’re still around Tuesday morning, like they were Monday morning…beautiful colors then too.~~~ I’m about ready to leave now, for the trip back upcountry to Kula. I’ll be back early Tuesday morning with your next new weather narrative from paradise! Aloha for now…Glenn.
Interesting:Fish have lost half their average body mass and smaller species are making up a larger proportion of European fish stocks as a result of global warming, a study has found. "It’s huge,” study author Martin Daufresne said. "Size is a fundamental characteristic that is linked to a number of biological functions, such as fecundity – the capacity to reproduce.”
Smaller fish tend to produce fewer eggs. They also provide less sustenance for predators – including humans – which could have significant implications for the food chain and ecosystem. A similar shrinking effect was recently documented in Scottish sheep and Mr Daufresne said it is possible that global warming could have "a significant impact on organisms in general”.
Earlier research has already established that fish have shifted their geographic ranges and their migratory and breeding patters in response to rising water temperatures. It has also been established that warmer regions tend to be inhabited by smaller fish.
Mr Daufresne and his colleagues examined long-term surveys of fish populations in rivers, streams and the Baltic and North Seas and also performed experiments on bacteria and plankton. They found the individual species lost an average of 50 per cent of their body mass over the past 20 to 30 years while the average size of the overall fishing stock had shrunk by 60 per cent.
This was a result of a decrease in the average size-at-age and an increase in the proportion of juveniles and small-sized species, Mr Daufresne said. "It was an effect that we observed in a number of organisms and in a number of very different environments – on fish, on plankton, on bacteria, in fresh water, in salt water – and we observed a global shrinking of size for all the organisms in all the environments.”
While commercial and recreational fishing did impact some of the fisheries studied, it "cannot be considered as the unique trigger” for the changes in size, the study published in the Proceedings of the National Academy of Sciences found. "Although not negating the role of other factors, our study provides strong evidence that temperature actually plays a major role in driving changes in the size structure of populations and communities,” the study concluded.
Interesting2:Consumers may be able to eat longer-lasting, potentially healthier fish fillets if research at Oregon State University makes its way to the supermarket. That’s because OSU scientists have extended the shelf life of lingcod fillets and possibly made them more nutritious by dipping them into an edible, protective coating enriched with fish oil.
"With this coating, you can easily keep the fillets in the display case for two to three more days," said OSU food science professor Yanyun Zhao, the lead researcher in the study. The liquid coating contained chitosan, which comes from crustacean shells and can be made into film for food wrapping to keep out bacteria and fungi and prolong storage life.
What’s unusual about the OSU study is that fish oil was added to the chitosan coating, which wasn’t visible once it dried. After the coating was applied, some fillets were refrigerated for three weeks while others were frozen for three months.
The study, which has been accepted for publication in the journal Food Chemistry and has been published on its Web site, found that the coating tripled the omega-3 fatty acids in the refrigerated and frozen fish when compared against the uncoated fish.
Interesting3:A new study of 30-million-year-old-fossil ‘mega-dung’ from extinct giant South American mammals, published in Palaeontology, reveals evidence of complex ecological interactions and theft of dung-beetles’ food stores by other animals. The dung-beetle has fallen on hard times. Once worshipped by the Ancient Egyptians its status has now slipped to that of unsung and forgotten hero, the butt of scatological jokes.
Yet the dung-beetle is truly heroic. It is a well known ‘fact’ that were it not for the dung-beetle the world would be knee-deep in animal droppings, especially those of large herbivores like cows, rhinos and elephants which, because they eat more food, produce more waste.
By burying that waste dung-beetles not only remove it from the surface, they improve and fertilise the soil and reduce the number of disease-carrying flies that would otherwise infest the dung.
If the modern dung beetle deserves praise for these global sanitation efforts, then the extinct dung beetles of ancient South America deserve a medal. Some 30 million years ago, the continent was home to what is known to palaeontologists as the South America Megafauna, including some truly giant extinct herbivores: bone covered armadillos the size of a small car, ground sloths 6 metres tall and elephant-sized hoofed-mammals unlike anything alive today.
And of course, megafauna would have produced mega-dung. The beetles certainly had their work cut out for them. And although the dung-beetles themselves did not fossilize, scientists know they were fully engaged in business because, amazingly, the results of their activities are preserved as fossil dung balls, some more than 40 million years old, and some as large as tennis balls.
Now palaeontologists in Argentina studying these dung balls have discovered that they have even more to tell us about the ecology of this lost world of giant mammals, but at a rather different scale. In a study published in the latest issue of the journal Palaeontology, Graduate Student Victoria Sánchez and Dr Jorge Genise report traces made by other creatures within fossil dung balls. "Some of these are just the results of chance interactions" explains Dr Sánchez.
"Burrowing bees, for example, dug cells in the ground where the dung balls were buried, and some of these happen to have been dug into the balls. But other traces record the behavior of animals actively stealing the food resources set aside by the dung beetles.
The shapes and sizes of these fossilized burrows and borings in the dung balls indicate that other beetles, flies and earthworms were the culprits. Although none of these animals is preserved in these rocks, the fossil dung balls preserve in amazing detail a whole dung-based ecosystem going on right under the noses of the giant herbivores of 30 million years ago."
Interesting4:Aluminum as a substitute for glass bottles has been inching its way into the consumer experience in the last few years, most notably in the US in the form of beer bottles from Anheuser-Busch and Iron City Beer, a popular regional brand founded in Pittsburgh. Coca-cola has also announced plans to roll out aluminum bottles in this country, though only in limited venues. Now Rexam, one of the world’s largest consumer packaging companies, has developed a lighter, resealable aluminum bottle that it hopes will replace glass bottles for many beverages, including wine.
The conclusion? Locally bottled beers are best served in glass, especially if your town has a strong glass recycling program. On the other hand, if you drink ales that hail from across state or national borders, aluminum cans are the way to go. Presumably this applies to the slightly heavier aluminum bottles, if and when they arrive in bars and supermarkets en masse.
Interesting5: The Los Angeles metropolitan area belches far more methane into its air than scientists had previously realized. If other megacities are equally profligate, urban methane emissions may represent a surprisingly important source of this potent greenhouse gas.
Atmospheric researchers have long had good estimates of global methane emissions, but less is known about exactly where these emissions come from, particularly in urban areas. To fill this void, a research team led by Paul Wennberg, an atmospheric chemist at Caltech in Pasadena, estimated methane emissions for the Los Angeles region, then subtracted all known sources of methane, such as livestock, landfills and sewage.
They ended up with an enormous amount of methane — about 0.14 to 0.34 megatons per year, or up to half of the total emissions that could not be accounted for by known sources. A separate study now underway by Amy Townsend-Small, a bio-geochemist at the University of California at Irvine, may help pinpoint the source.
She has been measuring the carbon isotope composition of methane released from different sources — for example, natural gas and other geologically old methane should be devoid of carbon-14, a relatively short-lived radioactive isotope.
Interesting6:The potential for a huge Pacific Ocean tsunami on the West Coast of America may be greater than previously thought, according to a new study of geological evidence along the Gulf of Alaska coast. The new research suggests that future tsunamis could reach a scale far beyond that suffered in the tsunami generated by the great 1964 Alaskan earthquake.
Official figures put the number of deaths caused by the earthquake at around 130: 114 in Alaska and 16 in Oregon and California. The tsunami killed 35 people directly and caused extensive damage in Alaska, British Columbia, and the US Pacific region.
The 1964 Alaskan earthquake – the second biggest recorded in history with a magnitude of 9.2 – triggered a series of massive waves with run up heights of as much as 12.7 meters in the Alaskan Gulf region and 52 meters in the Shoup Bay submarine slide in Valdez Arm.
The study suggests that rupture of an even larger area than the 1964 rupture zone could create an even bigger tsunami. Warning systems are in place on the west coast of North America but the findings suggest a need for a review of evacuation plans in the region.
The research team from Durham University in the UK, the University of Utah and Plafker Geohazard Consultants, gauged the extent of earthquakes over the last 2,000 years by studying subsoil samples and sediment sequences at sites along the Alaskan coast.
The team radiocarbon-dated peat layers and sediments, and analyzed the distribution of mud, sand and peat within them. The results suggest that earthquakes in the region may rupture even larger segments of the coast and sea floor than was previously thought.
The study published in the academic journal Quaternary Science Reviews and funded by the National Science Foundation, NASA, and the US Geological Survey shows that the potential impact in terms of tsunami generation, could be significantly greater if both the 800-km-long 1964 segment and the 250-km-long adjacent Yakataga segment to the east were to rupture simultaneously.
Interesting7:Rubber sidewalks are all grown up. Once perceived mainly as a safe surface for playgrounds, rubber sidewalks have developed into a means of preserving urban trees, reducing storm water runoff, recycling tires, and curbing greenhouse gas emissions. A company called Rubbersidewalks (what else?) began installing the modular units in 2002, and its rubber sidewalk products now appear in almost 100 cities across the country. Even the U.S. military is getting into the act.
Plans are in the works to install rubber sidewalks at Coast Guard Island in Alameda, California, and they’re being promoted by the Pollution Prevention Program at Aberdeen Proving Ground in Maryland. The Benefits of Rubber Sidewalks for Urban Trees Rubbersidewalks (the company, that is) attributes its core concept to Richard Valeriano, a senior public works inspector for the City of Santa Monica.
The original idea behind a rubber sidewalk was to achieve a flexible surface that would reduce cracking around tree roots. In turn, that would reduce the need to cut or drastically trim trees with overgrown roots. Over the course of several years, city workers noticed that the rubber surface seemed to slow the growth of roots while providing the tree with sufficient water and oxygen, helping to mitigate the problem of root overgrowth at the source. The modular installation system also enables workers to remove sections of sidewalk to inspect tree roots, without the need for pavement-breaking equipment that could damage a tree.
July 19-20, 2009
Air Temperatures – The following maximum temperatures were recorded across the state of Hawaii Sunday afternoon: Lihue, Kauai – 84 Honolulu, Oahu – 88 Kaneohe, Oahu – 82 Kahului, Maui – 87 Hilo, Hawaii – 83 Kailua-kona – 87 Air Temperaturesranged between these warmest and coolest spots near sea level – and on the highest mountains…at 4 p.m. Sunday afternoon:
Port Allen, Kauai – 86F
Kaneohe, Oahu – 81
Haleakala Crater – 55 (near 10,000 feet on Maui)
Mauna Kea summit – 41 (near 14,000 feet on the Big Island) Precipitation Totals – The following numbers represent the largest precipitation totals (inches) during the last 24 hours on each of the major islands, as ofSunday afternoon:
0.79 Mount Waialaele, Kauai 0.21 Oahu Forest NWR, Oahu
0.00 Molokai
0.00 Lanai
0.00 Kahoolawe 0.18 West Wailuaiki, Maui 0.41 Glenwood, Big Island
Marine Winds – Here’s the latest (automatically updated) weather mapshowing two 1029 millibar high pressure systems merging to the northwest of the islands Monday. This high pressure cell will keep the trade winds blowing into Tuesday.
Satellite and Radar Images:To view the cloud conditions we have here in Hawaii, please use the following satellite links, starting off with thisInfrared Satellite Image of the islands to see all the clouds around the state during the day and night. This next image is one that gives close images of the islands only during the daytime hours, and is referred to as a Close-up visible image. This next image shows a larger view of the Pacific…giving perspective to the wider ranging cloud patterns in the Pacific Ocean. Finally, here’s a LoopingIR satelliteimage, making viewable the clouds around the islands 24 hours a day. To help you keep track of where any showers may be around the islands, here’s the latest animatedradar image.
Hawaii’s Mountains – Here’s a link to the live webcam on the summit of near 14,000 footMauna Kea on the Big Island of Hawaii. The tallest peak on the island of Maui is theHaleakala Crater, which is near 10,000 feet in elevation. These two webcams are available during the daylight hours here in the islands…and when there’s a big moon rising just after sunset for an hour or two! Plus, during the nights and early mornings you will be able to see stars, and the sunrise too…depending upon weather conditions.
Tropical Cyclone activity in the eastern and central Pacific – Here’s the latest weather information coming out of the National Hurricane Center, covering the eastern north Pacific. You can find the latest tropical cyclone information for the central north Pacific (where Hawaii is located) by clicking on this link to the Central Pacific Hurricane Center. Here’s a tracking map covering both the eastern and central Pacific Ocean. A satellite image, which shows the entire ocean area between Hawaii and the Mexican coast…can be found here.
Aloha Paragraphs
A beach in Kihei…Maui
As expected the trade winds will remain on the blustery side of the wind scale through the first part of the upcoming new week…then become much lighter.We find near 1030 millibar high pressure systems to the northwest of the islands Sunday evening. These two high pressure cells are the source of our gusty winds…and will be merging together by Monday.The expectation is that these gusty trades will continue through at least the first half of the new week ahead…then taper off considerably around mid-week.This could put us into a convective weather pattern, with muggy conditions for several days thereafter. Showers have backed off now, with relatively drier conditions prevailing until mid-week…when it may turn showery again. This satellite imageshows a considerable amount of high cirrus clouds to our south…which could easily shift northward over us. The forecast calls for drier air arriving today into Monday, and remaining somewhat drier until around Tuesday night or Wednesday…when another possible area of showers arrives then for a couple of days. The leeward sides in particular will be nice and sunny for the time being, and ready for lots of sun bathing and beach walking during the days.
It’s Sunday evening here in Kula, Maui, as I begin writing the last part of today’s narrative. Sunday was such a sunny day here in the islands, and very warm too. Air temperatures around the state, at sea level locations, all were in the middle 80F’s…topping out at 88 in the big city of Honolulu during the afternoon hours. The trade winds were pretty gusty as well, and at around 5pm, the top gust around the state was 38 mph at that windy bay at Maalaea. I expect similar conditions through the next several days, with a change to lighter wind speeds, and more showers waiting until around mid-week coming up. ~~~ I’ll be back early Monday morning with your next new weather narrative from paradise, I hope you have a good Sunday night! Aloha for now…Glenn.
Interesting:It has been assumed that global warming would cause an expansion of the world’s deserts, but now some scientists are predicting a contrary scenario in which water and life slowly reclaim these arid places. They think vast, dry regions like the Sahara might soon begin shrinking. The evidence is limited and definitive conclusions are impossible to reach but recent satellite pictures of North Africa seem to show areas of the Sahara in retreat.
It could be that an increase in rainfall has caused this effect. Farouk el-Baz, director of the Centre for Remote Sensing at Boston University, believes the Sahara is experiencing a shift from dryer to wetter conditions. "It’s not greening yet.
But the desert expands and shrinks in relation to the amount of energy that is received by the Earth from the Sun, and this over many thousands of years," Mr el-Baz told the BBC World Service. "The heating of the Earth would result in more evaporation of the oceans, in turn resulting in more rainfall."
Interesting2:The findings of a major new study are consistent with gradual changes of current systems in the North Atlantic Ocean, rather than a more sudden shutdown that could lead to rapid climate changes in Europe and elsewhere. The research, based on the longest experiment of its type ever run on a "general circulation model" that simulated the Earth’s climate for 21,000 years back to the height of the last Ice Age, shows that major changes in these important ocean current systems can occur, but they may take place more slowly and gradually than had been suggested.
The newest findings, to be published July 17 in the journal Science, are consistent with other recent studies that are moving away from the theory of an abrupt "tipping point" that might cause dramatic atmospheric temperature and ocean circulation changes in as little as 50 years. "Research is now indicating that this phenomenon may happen, but probably not as a sudden threshold we’re crossing," said Peter Clark, a professor of geosciences at Oregon State University.
"For those who have been concerned about extremely abrupt changes in these ocean current patterns, that’s good news. "In the past it appears the ocean did change abruptly, but only because of a sudden change in the forcing," he said. "But when the ocean is forced gradually, such as we anticipate for the future, its response is gradual. That would give ecosystems more time to adjust to new conditions."
The findings do not change broader concerns about global warming. Temperatures are still projected to increase about four to 11 degrees by the end of this century, and the study actually confirms that some of the world’s most sophisticated climate models are accurate.
"The findings from this study, which also match other data we have on recorded climate change, are an important validation of the global climate models," Clark said. "They seem to be accurately reflecting both the type and speed of changes that have taken place in the past, and that increases our ability to trust their predictions of the future."
Interesting3:New evidence for ice-free summers with intermittent winter sea ice in the Arctic Ocean during the Late Cretaceous – a period of greenhouse conditions – gives a glimpse of how the Arctic is likely to respond to future global warming. Records of past environmental change in the Arctic should help predict its future behaviour.
The Late Cretaceous, the period between 100 and 65 million years ago leading up to the extinction of the dinosaurs, is crucial in this regard because levels of carbon dioxide (CO2) were high, driving greenhouse conditions.
But scientists have disagreed about the climate at this time, with some arguing for low Arctic late Cretaceous winter temperatures (when sunlight is absent during the Polar night) as against more recent suggestions of a somewhat milder 15°C mean annual temperature.
Writing in Nature, Dr Andrew Davies and Professor Alan Kemp of the University of Southampton’s School of Ocean and Earth Science based at the National Oceanography Centre, Southampton, along with Dr Jennifer Pike of Cardiff University take this debate a step forward by presenting the first seasonally resolved Cretaceous sedimentary record from the Alpha Ridge of the Arctic Ocean.
The scientists analyzed the remains of diatoms – tiny free-floating plant-like organisms – preserved in late Cretaceous marine sediments. In modern oceans, diatoms play a dominant role in the ‘biological carbon pump’ by which carbon dioxide is drawn down from the atmosphere through photosynthesis and a proportion of it exported to the deep ocean.
Unfortunately, the role of diatoms in the Cretaceous oceans has until now been unclear, in part because they are often poorly preserved in sediments. But the researchers struck lucky. "With remarkable serendipity," they explain, " successive US and Canadian expeditions that occupied floating ice islands above the Alpha Ridge of the Arctic Ocean, recovered cores containing shallow buried upper Cretaceous diatom ooze with superbly preserved diatoms."
This has allowed them to conduct a detailed study of the diatom fossils using sophisticated electron microscopy techniques. In the modern ocean, scientists use floating sediment traps to collect and study settling material. These electron microscope techniques that have been pioneered by Professor Kemp’s group at Southampton have unlocked a ‘palaeo-sediment trap’ to reveal information about Late Cretaceous environmental conditions.
Interesting4:June 2009 was the planet’s second-warmest June ever on record, the National Oceanographic and Atmospheric Administration (NOAA) reported Friday. Only 2005 was warmer. When just ocean areas are included, it was the warmest June ever. Global records began in 1880. "Large portions of each inhabited continent were substantially warmer than average during June 2009," NOAA’s National Climatic Data Center wrote in an online report
"The warmest anomalies were most notable in parts of Africa and most of Eurasia." The main cause for the warmth was the development of El Niño, a warming of tropical Pacific Ocean water that affects weather patterns worldwide. "If El Niño conditions continue to mature as projected by NOAA, global temperatures are likely to continue to threaten previous record highs," noted the report.
Overall, for the first half of the year, 2009 is the fifth-warmest year on record for the Earth, with an average global temperature nearly 1 degree above average. Only 1998, 2002, 2005, and 2007 had a higher average temperature for the first six months of the year.
In 2009, warmer-than-average conditions were recorded across much of the world’s land areas, with the exception of cooler-than-average temperatures across Canada. In the USA, the climate center reported earlier this week that the USA is having its 25th-warmest year on record, with only North Dakota experiencing below-average temperatures.
July 18-19, 2009
Air Temperatures – The following maximum temperatures were recorded across the state of Hawaii Saturday afternoon: Lihue, Kauai – 84 Honolulu, Oahu – 87 Kaneohe, Oahu – 82 Kahului, Maui – 85 Hilo, Hawaii – 80 Kailua-kona – 86 Air Temperaturesranged between these warmest and coolest spots near sea level – and on the highest mountains…at 5 p.m. Saturday evening:
Barking Sands, Kauai – 86F
Hilo, Hawaii – 74
Haleakala Crater – 45 (near 10,000 feet on Maui)
Mauna Kea summit – 32 (near 14,000 feet on the Big Island) Precipitation Totals – The following numbers represent the largest precipitation totals (inches) during the last 24 hours on each of the major islands, as ofSaturday afternoon:
0.22 Mount Waialaele, Kauai 0.93 Mano Valley, Oahu
0.07 Molokai
0.00 Lanai
0.00 Kahoolawe 3.74 Puu Kukui, Maui 2.77 Waiakea Uka, Big Island
Marine Winds – Here’s the latest (automatically updated) weather mapshowing large 1031 millibar high pressure systems to the north and northwest of the islands. These high pressure cells will keep the trade winds blowing through Monday.
Satellite and Radar Images:To view the cloud conditions we have here in Hawaii, please use the following satellite links, starting off with thisInfrared Satellite Image of the islands to see all the clouds around the state during the day and night. This next image is one that gives close images of the islands only during the daytime hours, and is referred to as a Close-up visible image. This next image shows a larger view of the Pacific…giving perspective to the wider ranging cloud patterns in the Pacific Ocean. Finally, here’s a LoopingIR satelliteimage, making viewable the clouds around the islands 24 hours a day. To help you keep track of where any showers may be around the islands, here’s the latest animatedradar image.
Hawaii’s Mountains – Here’s a link to the live webcam on the summit of near 14,000 footMauna Kea on the Big Island of Hawaii. The tallest peak on the island of Maui is theHaleakala Crater, which is near 10,000 feet in elevation. These two webcams are available during the daylight hours here in the islands…and when there’s a big moon rising just after sunset for an hour or two! Plus, during the nights and early mornings you will be able to see stars, and the sunrise too…depending upon weather conditions.
Tropical Cyclone activity in the eastern and central Pacific – Here’s the latest weather information coming out of the National Hurricane Center, covering the eastern north Pacific. You can find the latest tropical cyclone information for the central north Pacific (where Hawaii is located) by clicking on this link to the Central Pacific Hurricane Center. Here’s a tracking map covering both the eastern and central Pacific Ocean. A satellite image, which shows the entire ocean area between Hawaii and the Mexican coast…can be found here.
Aloha Paragraphs
Windward Oahu…what a great place to walk
As expected the trade winds are on the blustery side of the wind scale this weekend…and will remain that way through the first part of the upcoming new week.We find near 1030 millibar high pressure systems to the north and northwest of the islands Saturday. These two high pressure cells are the source of our locally strong and gusty winds…as shown on thisweather map. As these winds have gained some strength overnight, we find small craft wind advisories active over most of our marine areas statewide. The expectation is that these gusty trades will continue through at least the first half of the new week ahead…then taper off some around mid-week. An area of moisture, which extends over 300 miles east of the islands, will keep off and on showers falling, carried our way on the gusty trades…arriving generally along the windward coasts and slopes into Sunday.In sum, there continues to be lots of clouds upstream of the islands, which will bring this increase in shower activity. This satellite imageshows those clouds, and also wisps of high cirrus clouds, which may spread overhead at times too. The forecast calls for drier air arriving later Sunday or by Monday, and remaining somewhat drier until around Wednesday…when another possible area of showers arrives then for a couple of days.~~~ At least part of these two areas of moisture may consist of former tropical systems Blanca and Dolores, which were active in the eastern Pacific. These remnant showery clouds are being brought to us thanks to the low level trade wind flow.
I had planned on going to see the new Harry Potter film last evening after work, but decided it would still be too crowded. Therefore, I decided to drive upcountry to Pukalani, to what is called the Maikalani Community Lectures…at the Institute for Astronomy. My neighbor, Dr. Jeff Kuhn, is the Director there, and invited me to attend this talk. This lecture is called Helioseismology: Song of the Sun, given by Dr. JD Armstrong. The description of this talk included: "The sun is the dominant influence on the weather, climate, and consequently, all life on our planet. Understanding how the sun works may therefore be essential to our survival. Measuring what happens inside the sun is difficult, so scientists have developed helioseismology, the study of sound waves inside the sun, to probe its interior." This sounded pretty interesting to me, so I went up for that. I must admit however, that most of what was discussed flew right over the top of my head!
I joined Jeff, his wife, and daughter for dinner in Makawao afterwards. This was the fun part of the evening for me, as I rarely go out socializing. It was funny, as soon as we sat down in the dining room of this restaurant, a very nice looking young lady came over to our table, and introduced herself to me. She, and two friends were on vacation from San Francisco, and used to watch my TV weather show, and read this website everyday. At any rate, I walked over and met her friends, and then came back and had a fine dinner, along with a glass of red wine. We had good talks, on a variety of subjects, as we almost always do.
It’s Saturday morning here in Kula, Maui, as I begin writing the last part of this morning’s narrative. I can see all those clouds over on the windward sides this morning. It’s even somewhat cloudy over here on the leeward slopes of the Haleakala Crater. Actually, now that I look over towards the leeward beaches, it looks cloudy there too…although appears to clearing fast over there. This is good, as we can use what water that this area of moisture can bring our way! ~~~ I honestly don’t know what I’ll be doing today, although since it’s Saturday, it’s a day off from work, which gives me a lot of freedom to let things fill in naturally. I’ll be back later in the day with more weather updates, I hope you have a great day until then! One last thing, I was sad to see the passing away of Walter Cronkite, it seems like so many people are leaving us lately. Aloha for now…Glenn.
As it turns out it’s Saturday evening now, and this afternoon I attended a circle of friends for a dear friend, who is dying of lung cancer. Her name is Julie…Dr. Julie Holmes, who I’ve had a long close friendship with on many levels over the years. I’m not really in the space to write much now, as about all I can do is sit here and be with all the memories that I have. I’ll come back on Sunday with more weather information. Aloha…Glenn.
Interesting:It has been assumed that global warming would cause an expansion of the world’s deserts, but now some scientists are predicting a contrary scenario in which water and life slowly reclaim these arid places. They think vast, dry regions like the Sahara might soon begin shrinking. The evidence is limited and definitive conclusions are impossible to reach but recent satellite pictures of North Africa seem to show areas of the Sahara in retreat.
It could be that an increase in rainfall has caused this effect. Farouk el-Baz, director of the Centre for Remote Sensing at Boston University, believes the Sahara is experiencing a shift from dryer to wetter conditions. "It’s not greening yet.
But the desert expands and shrinks in relation to the amount of energy that is received by the Earth from the Sun, and this over many thousands of years," Mr el-Baz told the BBC World Service. "The heating of the Earth would result in more evaporation of the oceans, in turn resulting in more rainfall."
Interesting2:The findings of a major new study are consistent with gradual changes of current systems in the North Atlantic Ocean, rather than a more sudden shutdown that could lead to rapid climate changes in Europe and elsewhere. The research, based on the longest experiment of its type ever run on a "general circulation model" that simulated the Earth’s climate for 21,000 years back to the height of the last Ice Age, shows that major changes in these important ocean current systems can occur, but they may take place more slowly and gradually than had been suggested.
The newest findings, to be published July 17 in the journal Science, are consistent with other recent studies that are moving away from the theory of an abrupt "tipping point" that might cause dramatic atmospheric temperature and ocean circulation changes in as little as 50 years. "Research is now indicating that this phenomenon may happen, but probably not as a sudden threshold we’re crossing," said Peter Clark, a professor of geosciences at Oregon State University.
"For those who have been concerned about extremely abrupt changes in these ocean current patterns, that’s good news. "In the past it appears the ocean did change abruptly, but only because of a sudden change in the forcing," he said. "But when the ocean is forced gradually, such as we anticipate for the future, its response is gradual. That would give ecosystems more time to adjust to new conditions."
The findings do not change broader concerns about global warming. Temperatures are still projected to increase about four to 11 degrees by the end of this century, and the study actually confirms that some of the world’s most sophisticated climate models are accurate.
"The findings from this study, which also match other data we have on recorded climate change, are an important validation of the global climate models," Clark said. "They seem to be accurately reflecting both the type and speed of changes that have taken place in the past, and that increases our ability to trust their predictions of the future."
Interesting3:New evidence for ice-free summers with intermittent winter sea ice in the Arctic Ocean during the Late Cretaceous – a period of greenhouse conditions – gives a glimpse of how the Arctic is likely to respond to future global warming. Records of past environmental change in the Arctic should help predict its future behaviour.
The Late Cretaceous, the period between 100 and 65 million years ago leading up to the extinction of the dinosaurs, is crucial in this regard because levels of carbon dioxide (CO2) were high, driving greenhouse conditions.
But scientists have disagreed about the climate at this time, with some arguing for low Arctic late Cretaceous winter temperatures (when sunlight is absent during the Polar night) as against more recent suggestions of a somewhat milder 15°C mean annual temperature.
Writing in Nature, Dr Andrew Davies and Professor Alan Kemp of the University of Southampton’s School of Ocean and Earth Science based at the National Oceanography Centre, Southampton, along with Dr Jennifer Pike of Cardiff University take this debate a step forward by presenting the first seasonally resolved Cretaceous sedimentary record from the Alpha Ridge of the Arctic Ocean.
The scientists analyzed the remains of diatoms – tiny free-floating plant-like organisms – preserved in late Cretaceous marine sediments. In modern oceans, diatoms play a dominant role in the ‘biological carbon pump’ by which carbon dioxide is drawn down from the atmosphere through photosynthesis and a proportion of it exported to the deep ocean.
Unfortunately, the role of diatoms in the Cretaceous oceans has until now been unclear, in part because they are often poorly preserved in sediments. But the researchers struck lucky. "With remarkable serendipity," they explain, " successive US and Canadian expeditions that occupied floating ice islands above the Alpha Ridge of the Arctic Ocean, recovered cores containing shallow buried upper Cretaceous diatom ooze with superbly preserved diatoms."
This has allowed them to conduct a detailed study of the diatom fossils using sophisticated electron microscopy techniques. In the modern ocean, scientists use floating sediment traps to collect and study settling material. These electron microscope techniques that have been pioneered by Professor Kemp’s group at Southampton have unlocked a ‘palaeo-sediment trap’ to reveal information about Late Cretaceous environmental conditions.
Interesting4:June 2009 was the planet’s second-warmest June ever on record, the National Oceanographic and Atmospheric Administration (NOAA) reported Friday. Only 2005 was warmer. When just ocean areas are included, it was the warmest June ever. Global records began in 1880. "Large portions of each inhabited continent were substantially warmer than average during June 2009," NOAA’s National Climatic Data Center wrote in an online report
"The warmest anomalies were most notable in parts of Africa and most of Eurasia." The main cause for the warmth was the development of El Niño, a warming of tropical Pacific Ocean water that affects weather patterns worldwide. "If El Niño conditions continue to mature as projected by NOAA, global temperatures are likely to continue to threaten previous record highs," noted the report.
Overall, for the first half of the year, 2009 is the fifth-warmest year on record for the Earth, with an average global temperature nearly 1 degree above average. Only 1998, 2002, 2005, and 2007 had a higher average temperature for the first six months of the year.
In 2009, warmer-than-average conditions were recorded across much of the world’s land areas, with the exception of cooler-than-average temperatures across Canada. In the USA, the climate center reported earlier this week that the USA is having its 25th-warmest year on record, with only North Dakota experiencing below-average temperatures.
July 17-18, 2009
Air Temperatures – The following maximum temperatures were recorded across the state of Hawaii Friday afternoon: Lihue, Kauai – 84 Honolulu, Oahu – 89 Kaneohe, Oahu – 84 Kahului, Maui – 86 Hilo, Hawaii – 80 Kailua-kona – 85 Air Temperaturesranged between these warmest and coolest spots near sea level – and on the highest mountains…at 4 p.m. Friday afternoon:
Honolulu, Oahu – 87F
Hilo, Hawaii – 76
Haleakala Crater – 52 (near 10,000 feet on Maui)
Mauna Kea summit – 41 (near 14,000 feet on the Big Island) Precipitation Totals – The following numbers represent the largest precipitation totals (inches) during the last 24 hours on each of the major islands, as ofFriday afternoon:
0.71 Mount Waialaele, Kauai
1.86 Poamoho 2, Oahu
0.00 Molokai
0.00 Lanai
0.00 Kahoolawe 0.16 West Wailuaiki, Maui 0.34 Waiakea Uka, Big Island
Marine Winds – Here’s the latest (automatically updated) weather mapshowing a large 1031 millibar high pressure system to the north-northwest of the islands. This high pressure cell will keep the trade winds blowing through Sunday.
Satellite and Radar Images:To view the cloud conditions we have here in Hawaii, please use the following satellite links, starting off with thisInfrared Satellite Image of the islands to see all the clouds around the state during the day and night. This next image is one that gives close images of the islands only during the daytime hours, and is referred to as a Close-up visible image. This next image shows a larger view of the Pacific…giving perspective to the wider ranging cloud patterns in the Pacific Ocean. Finally, here’s a LoopingIR satelliteimage, making viewable the clouds around the islands 24 hours a day. To help you keep track of where any showers may be around the islands, here’s the latest animatedradar image.
Hawaii’s Mountains – Here’s a link to the live webcam on the summit of near 14,000 footMauna Kea on the Big Island of Hawaii. The tallest peak on the island of Maui is theHaleakala Crater, which is near 10,000 feet in elevation. These two webcams are available during the daylight hours here in the islands…and when there’s a big moon rising just after sunset for an hour or two! Plus, during the nights and early mornings you will be able to see stars, and the sunrise too…depending upon weather conditions.
Tropical Cyclone activity in the eastern and central Pacific – Here’s the latest weather information coming out of the National Hurricane Center, covering the eastern north Pacific. You can find the latest tropical cyclone information for the central north Pacific (where Hawaii is located) by clicking on this link to the Central Pacific Hurricane Center. Here’s a tracking map covering both the eastern and central Pacific Ocean. A satellite image, which shows the entire ocean area between Hawaii and the Mexican coast…can be found here.
Aloha Paragraphs
Mockingbird…one of my favorite birds here in the islands
The trade winds continue blowing, perhaps even having picked up a little in strength…as we move into the weekend time frame.We find a near 1030 millibar high pressure system to the north-northwest of the islands Friday evening, which is the source of our locally strong and gusty winds…as shown on thisweather map. As these winds have gained some steam, we find small craft wind advisories active over those windier areas from Molokai down through Maui and the Big Island. The expectation is that these gusty trades will continue through at least the first half of the new week ahead. It appears that we’ll see at least some increase in showers along our windward sides…as we move into Saturday.There continues to be lots of clouds to the east of the islands, which will bring this increase in shower activity. This satellite imageshows those clouds ustream (in relation to the incoming trades), and also wisps of high cirrus clouds, which will fly overhead at times. The forecast calls for drier air arriving Sunday, and remaining somewhat drier until around Tuesday…with another possible area of showers arriving by mid-week.
It’s Friday evening here in Kihei, Maui, as I begin writing this last section of this evening’s narrative. I had planned on going to see the new Harry Potter film this evening after work, but decided it would still be too crowded. As a second choice I’ve decided to drive upcountry to Pukalani, to what is called the Maikalani Community Lectures…at the Institute for Astronomy. My neighbor is the Director there, and invited me to come down for this talk. This lecture is called Helioseismology: Song of the Sun, given by Dr. JD Armstrong. The description of this talk is: "The sun is the dominant influence on the weather, climate, and consequently, all life on our planet. Understanding how the sun works may therefore be essential to our survival. Measuring what happens inside the sun is difficult, so scientists have developed helioseismology, the study of sound waves inside the sun, to probe its interior." This sounds pretty interesting to me, so I’ll attend. ~~~ I’ll meet you back here Saturday morning with the next new weather narrative, I hope you have a great Friday night until then! Aloha for now…Glenn.
Interesting:It has been assumed that global warming would cause an expansion of the world’s deserts, but now some scientists are predicting a contrary scenario in which water and life slowly reclaim these arid places. They think vast, dry regions like the Sahara might soon begin shrinking. The evidence is limited and definitive conclusions are impossible to reach but recent satellite pictures of North Africa seem to show areas of the Sahara in retreat.
It could be that an increase in rainfall has caused this effect. Farouk el-Baz, director of the Centre for Remote Sensing at Boston University, believes the Sahara is experiencing a shift from dryer to wetter conditions. "It’s not greening yet.
But the desert expands and shrinks in relation to the amount of energy that is received by the Earth from the Sun, and this over many thousands of years," Mr el-Baz told the BBC World Service. "The heating of the Earth would result in more evaporation of the oceans, in turn resulting in more rainfall."
Interesting2:The findings of a major new study are consistent with gradual changes of current systems in the North Atlantic Ocean, rather than a more sudden shutdown that could lead to rapid climate changes in Europe and elsewhere. The research, based on the longest experiment of its type ever run on a "general circulation model" that simulated the Earth’s climate for 21,000 years back to the height of the last Ice Age, shows that major changes in these important ocean current systems can occur, but they may take place more slowly and gradually than had been suggested.
The newest findings, to be published July 17 in the journal Science, are consistent with other recent studies that are moving away from the theory of an abrupt "tipping point" that might cause dramatic atmospheric temperature and ocean circulation changes in as little as 50 years. "Research is now indicating that this phenomenon may happen, but probably not as a sudden threshold we’re crossing," said Peter Clark, a professor of geosciences at Oregon State University.
"For those who have been concerned about extremely abrupt changes in these ocean current patterns, that’s good news. "In the past it appears the ocean did change abruptly, but only because of a sudden change in the forcing," he said. "But when the ocean is forced gradually, such as we anticipate for the future, its response is gradual. That would give ecosystems more time to adjust to new conditions."
The findings do not change broader concerns about global warming. Temperatures are still projected to increase about four to 11 degrees by the end of this century, and the study actually confirms that some of the world’s most sophisticated climate models are accurate.
"The findings from this study, which also match other data we have on recorded climate change, are an important validation of the global climate models," Clark said. "They seem to be accurately reflecting both the type and speed of changes that have taken place in the past, and that increases our ability to trust their predictions of the future."
Interesting3:New evidence for ice-free summers with intermittent winter sea ice in the Arctic Ocean during the Late Cretaceous – a period of greenhouse conditions – gives a glimpse of how the Arctic is likely to respond to future global warming. Records of past environmental change in the Arctic should help predict its future behaviour.
The Late Cretaceous, the period between 100 and 65 million years ago leading up to the extinction of the dinosaurs, is crucial in this regard because levels of carbon dioxide (CO2) were high, driving greenhouse conditions.
But scientists have disagreed about the climate at this time, with some arguing for low Arctic late Cretaceous winter temperatures (when sunlight is absent during the Polar night) as against more recent suggestions of a somewhat milder 15°C mean annual temperature.
Writing in Nature, Dr Andrew Davies and Professor Alan Kemp of the University of Southampton’s School of Ocean and Earth Science based at the National Oceanography Centre, Southampton, along with Dr Jennifer Pike of Cardiff University take this debate a step forward by presenting the first seasonally resolved Cretaceous sedimentary record from the Alpha Ridge of the Arctic Ocean.
The scientists analyzed the remains of diatoms – tiny free-floating plant-like organisms – preserved in late Cretaceous marine sediments. In modern oceans, diatoms play a dominant role in the ‘biological carbon pump’ by which carbon dioxide is drawn down from the atmosphere through photosynthesis and a proportion of it exported to the deep ocean.
Unfortunately, the role of diatoms in the Cretaceous oceans has until now been unclear, in part because they are often poorly preserved in sediments. But the researchers struck lucky. "With remarkable serendipity," they explain, " successive US and Canadian expeditions that occupied floating ice islands above the Alpha Ridge of the Arctic Ocean, recovered cores containing shallow buried upper Cretaceous diatom ooze with superbly preserved diatoms."
This has allowed them to conduct a detailed study of the diatom fossils using sophisticated electron microscopy techniques. In the modern ocean, scientists use floating sediment traps to collect and study settling material. These electron microscope techniques that have been pioneered by Professor Kemp’s group at Southampton have unlocked a ‘palaeo-sediment trap’ to reveal information about Late Cretaceous environmental conditions.
Interesting4:June 2009 was the planet’s second-warmest June ever on record, the National Oceanographic and Atmospheric Administration (NOAA) reported Friday. Only 2005 was warmer. When just ocean areas are included, it was the warmest June ever. Global records began in 1880. "Large portions of each inhabited continent were substantially warmer than average during June 2009," NOAA’s National Climatic Data Center wrote in an online report
"The warmest anomalies were most notable in parts of Africa and most of Eurasia." The main cause for the warmth was the development of El Niño, a warming of tropical Pacific Ocean water that affects weather patterns worldwide. "If El Niño conditions continue to mature as projected by NOAA, global temperatures are likely to continue to threaten previous record highs," noted the report.
Overall, for the first half of the year, 2009 is the fifth-warmest year on record for the Earth, with an average global temperature nearly 1 degree above average. Only 1998, 2002, 2005, and 2007 had a higher average temperature for the first six months of the year.
In 2009, warmer-than-average conditions were recorded across much of the world’s land areas, with the exception of cooler-than-average temperatures across Canada. In the USA, the climate center reported earlier this week that the USA is having its 25th-warmest year on record, with only North Dakota experiencing below-average temperatures.
July 16-17, 2009
Air Temperatures – The following maximum temperatures were recorded across the state of Hawaii Thursday afternoon: Lihue, Kauai – 83 Honolulu, Oahu – 90 Kaneohe, Oahu – 83 Kahului, Maui – 89 Hilo, Hawaii – 85 Kailua-kona – 86 Air Temperaturesranged between these warmest and coolest spots near sea level – and on the highest mountains…at 4 p.m. Thursday afternoon:
Honolulu, Oahu – 88F
Princeville, Kauai – 81
Haleakala Crater – 52 (near 10,000 feet on Maui)
Mauna Kea summit – 43 (near 14,000 feet on the Big Island) Precipitation Totals – The following numbers represent the largest precipitation totals (inches) during the last 24 hours on each of the major islands, as ofThursday afternoon:
1.23 Mount Waialaele, Kauai
1.30 Poamoho 2, Oahu
0.03 Molokai
0.00 Lanai
0.01 Kahoolawe 0.71 West Wailuaiki, Maui 0.39 Honaunau, Big Island
Marine Winds – Here’s the latest (automatically updated) weather mapshowing high pressure systems to the north and northeast of the islands Friday. These high pressure cells, along with their associated high pressure ridges…will keep the trade winds blowing through Saturday.
Satellite and Radar Images:To view the cloud conditions we have here in Hawaii, please use the following satellite links, starting off with thisInfrared Satellite Image of the islands to see all the clouds around the state during the day and night. This next image is one that gives close images of the islands only during the daytime hours, and is referred to as a Close-up visible image. This next image shows a larger view of the Pacific…giving perspective to the wider ranging cloud patterns in the Pacific Ocean. Finally, here’s a LoopingIR satelliteimage, making viewable the clouds around the islands 24 hours a day. To help you keep track of where any showers may be around the islands, here’s the latest animatedradar image.
Hawaii’s Mountains – Here’s a link to the live webcam on the summit of near 14,000 footMauna Kea on the Big Island of Hawaii. The tallest peak on the island of Maui is theHaleakala Crater, which is near 10,000 feet in elevation. These two webcams are available during the daylight hours here in the islands…and when there’s a big moon rising just after sunset for an hour or two! Plus, during the nights and early mornings you will be able to see stars, and the sunrise too…depending upon weather conditions.
Tropical Cyclone activity in the eastern and central Pacific – Here’s the latest weather information coming out of the National Hurricane Center, covering the eastern north Pacific. You can find the latest tropical cyclone information for the central north Pacific (where Hawaii is located) by clicking on this link to the Central Pacific Hurricane Center. Here’s a tracking map covering both the eastern and central Pacific Ocean. A satellite image, which shows the entire ocean area between Hawaii and the Mexican coast…can be found here.
Aloha Paragraphs Snorkeling with the turtles
Trade wind weather conditions to continue across all of the Hawaiian Islands Friday into the weekend.The 1024 millibar high pressure system to the northeast of us Thursday evening, is the source of our moderately strong winds…as shown on thisweather map. Our trade wind speeds will pick up a notch Friday into the weekend. As these winds gain that strength, we have already seen small craft wind advisories having gone up over those windier areas around Maui and the Big Island. Windward biased showers will continue, falling in the most generous manner during the nights…there could be a few heavy ones here and there.There continues to be some clouds upstream of the islands Thursday evening, which will keep off and on shower activity arriving along our windward coasts and slopes into Friday. We now find most of the high cirrus clouds steaming off the tops of thunderstorms over by the International Dateline. This satellite imageshows that most of these cirrus clouds are located to the southeast the Big Island now.
Former tropical cyclone Carlos has now dissipated, while tropical depression Dolores, is baring hanging onto live by a thread in the eastern Pacific. Here’s the NHC forecast track for now retired Carlos, andDolores. Here’s the bestsatellite image, showing both of these tropical systems in relation to Hawaii. Whatever few clouds that are left over with Carlos, will pass well south of the islands, while Dolores will be fading away…although there’s still the chance that we might get some showers from its remnant circulation next week about this time.
It’s Thursday evening here in Kihei, Maui, as I begin writing this last section of this evening’s narrative. As has been the case all this week, Thursday’s weather was near perfect. Yes, the trade winds were blowing, but those are what make our hot afternoon temperatures bearable at sea level locations. As you might have read in the paragraph above, former tropical cyclone Carlos is now been put in the history books, retired by the National Hurricane Center in Miami. They’re still working with tropical depression Dolores, in the eastern Pacific, but that too…should be over and out sometime soon. ~~~ Speaking of over and out, that’s the case with this Maui weatherman now. I’m just about ready to head up the mountain, to my haven in Kula. Make no mistake though, I’ll be up very early Friday morning, in order to prepare your next new weather narrative then. I hope you have a great Thursday night! Aloha for now…Glenn.
Interesting:Scientists at The Florida State University’s Center for Ocean-Atmospheric Prediction Studies (COAPS) have developed a new computer model that they hope will predict with unprecedented accuracy how many hurricanes will occur in a given season. After about five years developing and assessing the model, Associate Scholar Scientist Tim LaRow and his COAPS colleagues are putting the system to the test this year with their first-ever hurricane forecast.
The COAPS model is one of only a handful of so–called "dynamical models" in the world being used to study seasonal hurricane activity. The COAPS model has predicted a below-average season in the Atlantic Ocean, with a mean of eight named storms and four hurricanes based partially on emerging El Nino conditions.
During an El Nino, the warmer ocean temperatures in the tropical eastern Pacific tend to suppress hurricane activity in the Atlantic. The historical seasonal average is 11 tropical storms and six hurricanes. "Making a real-time forecast for the first time is always very interesting and a very good test of the model," LaRow said.
"The hard part is in the waiting to see how the model verifies." LaRow and COAPS researchers Lydia Stefanova and Dong-Wook Shin issued their forecast on June 1, the official start of the six-month hurricane season. The tropics traditionally don’t become active until the early fall months, so it’s too early to tell if the forecast is on track.
However, the researchers have good reason to feel confident. Before making this year’s prediction, they used the model to perform 20 years of re-forecasts, or hindcasts, using the sea surface temperatures determined by the National Oceanic and Atmospheric Administration on June 1 of every year from 1986 to 2005.
They found a very high correlation between the model’s predictions of the number and intensity of tropical cyclones and what actually occurred during those years. In addition, the model outperformed many statistical and other dynamical models, LaRow said.
Statistical models use statistical relationships between oceanic and atmospheric variables to make a forecast, while dynamical models, such as the COAPS model, require major computing resources in order to make trillions of calculations using the equations of motion along with the best physical understanding of the atmosphere.
The COAPS model uses the university’s high-performance computer to synthesize massive amounts of information including atmospheric, ocean and land data. A key component of the COAPS model is NOAA’s forecast of sea surface temperatures.
But COAPS researchers continue to study their own model in an effort to better understand the relationship between sea surface temperatures and climate predictability. "All models are unique, and what makes them unique is the physics inside them," LaRow said.
"How and why our model’s collection of physical processes captures the year-to-year variability so well needs to be better understood. This research will lead to even greater seasonal forecasting skill in the future." In 2006, COAPS received a $6.2 million, five-year grant from NOAA that has been used, in part, to support the development of this model.
Interesting2:Sweden is to become the first country to slap "climate-friendly" labels on food products. The hope is that the labels will prompt consumers to buy greener products, but there are worries that some companies may use the scheme to "greenwash".
A small milk producer north of Stockholm is expected to be the first company to sport the "climate-certified" tag. One way it cut its use of energy and nutrients was by switching from chemical-based fertilizers to manure. The scheme is voluntary and firms must prove they have reduced greenhouse gas emissions in order to earn a label.
"The only thing we’re guaranteeing is that improvements have been made," says Anna Richert, an adviser to the Federation of Swedish Farmers (LRF), and head of the team developing the criteria for labeling products. "This could mean reductions in emissions of anything from 5 to 80 per cent."
Interesting3:For the first time, NOAA scientists have demonstrated that tsunamis in the open ocean can change sea surface texture in a way that can be measured by satellite-borne radars. The finding could one day help save lives through improved detection and forecasting of tsunami intensity and direction at the ocean surface.
“We’ve found that roughness of the surface water provides a good measure of the true strength of the tsunami along its entire leading edge. This is the first time that we can see tsunami propagation in this way across the open ocean,” said lead author Oleg Godin of NOAA’s Earth System Research Laboratory and the Cooperative Institute for Research in Environmental Sciences, in Boulder, Colo.
Large tsunamis crossing the open ocean stir up and darken the surface waters along the leading edge of the wave, according to the study. The rougher water forms a long, shadow-like strip parallel to the wave and proportional to the strength of the tsunami. That shadow can be measured by orbiting radars and may one day help scientists improve early warning systems.
The research is published online this week in the journal, Natural Hazards and Earth System Sciences. The new research challenges the traditional belief that tsunamis are too subtle in the open ocean to be seen at the surface.
The findings confirm a theory, developed by Godin and published in 2002-05, that tsunamis in the deep ocean can be detected remotely through changes in surface roughness. In 1994, a tsunami shadow was captured by video from shore moments before the wave struck Hawaii.
That observation and earlier written documentation of a shadow that accompanied a deadly tsunami on April 1, 1946, inspired Godin to develop his theory. He tested the theory during the deadly December 26, 2004, Indian Ocean tsunami, the result of the Sumatra-Andaman earthquake.
Godin and colleagues analyzed altimeter measurements of the 2004 tsunami from NASA’s Jason-1 satellite. The data revealed clear evidence of an increased surface roughness along the leading edge of the tsunami as it passed across the Indian Ocean between two and six degrees south latitude.
Tsunamis can be detected in several ways. One detection method uses a buoy system that warns coastal communities in the United States of an approaching tsunami. NOAA’s Deep-ocean Assessment and Reporting of Tsunamis (DART) early warning system uses sensors on the ocean floor to measure changes in pressure at each location.
The DART network of 39 stations extends around the perimeter of the Pacific Ocean and along the western edge of the North Atlantic Ocean and Gulf of Mexico. The technology provides accurate, real-time information on the amplitude, over time, of an approaching tsunami. NOAA’s tsunami warning centers then use this information to forecast the tsunami’s impact on coastlines.
A second method uses space-borne altimeters to detect tsunamis by measuring small changes in sea surface height. Only a handful of these instruments are in orbit and the observations are limited to points along a line. The new study presents a third way to detect tsunamis — by changes in the texture of the surface water across a wide span of the open ocean.
Godin’s research confirmed his theory that a tsunami wave roughens the surface water through air-sea interaction. First the leading edge of the tsunami wave stirs up the surface winds. Those same winds, which become more chaotic than the wave itself, then churn the surface waters along the slope of the wave.
Because rough water is darker than smooth water, a contrast forms between the dark, rough water of the wave and the bright, smooth water on either side of it. Common scientific instruments, called microwave radars and radiometers, are able to detect this contrast, known as a tsunami shadow.
When orbiting the Earth, microwave radars and radiometers can observe a band of ocean surface hundreds of kilometers wide and thousands of kilometers long. If programmed correctly to observe sea surface roughness, they could potentially map an entire tsunami, said Godin.
Interesting4: The world will remain heavily dependent on fossil fuels such as oil, gas and coal for the rest of this century, despite the best efforts of governments to move toward renewable energy, an energy economist said on Wednesday. Peter Odell, professor of international energy studies at Erasmus University, Rotterdam, and author of the bestselling World and Oil Power, said the drive to limit greenhouse gases was likely to be held back by both technology and economics. Painting a gloomy picture of the short-term outlook for renewables, Odell told Reuters that even with a growing global effort to limit carbon dioxide emissions, the world would still be relying on hydrocarbons by 2100. Interesting5:Thousands of jumbo flying squid — aggressive 5-foot-long sea monsters with razor-sharp beaks and toothy tentacles — have invaded the shallow waters off San Diego, spooking scuba divers and washing up dead on tourist-packed beaches. The carnivorous calamari, which can grow up to 100 pounds, came up from the depths last week and swarms of them roughed up unsuspecting divers. Some divers report tentacles enveloping their masks and yanking at their cameras and gear.
Stories of too-close encounters with the alien-like cephalopods have chased many veteran divers out of the water and created a whirlwind of excitement among the rest, who are torn between their personal safety and the once-in-a-lifetime chance to swim with the deep-sea giants.
The so-called Humboldt squid, which can grow up to 100 pounds, are native to the deep waters off Mexico, where they have been known to attack humans and are nicknamed "red devils" for their rust-red coloring and mean streak.
Those who dive with them there chum the water with bait and sometimes get in a metal cage or wear chain mail to avoid being lashed by tentacles. "I wouldn’t go into the water with them for the same reason I wouldn’t walk into a pride of lions on the Serengeti," said Mike Bear, a local diver.
"For all I know, I’m missing the experience of a lifetime." The squid are too deep to bother swimmers and surfers, but many longtime divers say they are staying out of the surf until the sea creatures clear out.
Yet other divers, including Shandra Magill, couldn’t resist the chance to see the squid up close. On a recent night, Magill watched in awe as a dozen squid with doleful, expressive eyes circled her group, tapping and patting the divers and gently bumping them before dashing away.
One especially large squid suspended itself motionless in the water about three feet away and peered at her closely, its eyes rolling, before it vanished into the black. A shimmering incandescence rippled along its body, almost as if it were communicating through its skin.
But the next night, things were different: A large squid surprised Magill by hitting her from behind and grabbing at her with its arms, pulling her sideways in the water. The powerful creature ripped her buoyancy hose away from her chest and knocked away her light. When Magill recovered, she didn’t know which direction was up and at first couldn’t find the hose to help her rise to the surface.
The squid was gone. "I just kicked like crazy. The first thing you think of is, ‘Oh my gosh, I don’t know if I’m going to survive this. If that squid wanted to hurt me, it would have," she said. Other divers have reported squid pulling at their masks and gear and roughing them up.
July 15-16, 2009
Air Temperatures – The following maximum temperatures were recorded across the state of Hawaii Wednesday afternoon: Lihue, Kauai – 84 Honolulu, Oahu – 86 Kaneohe, Oahu – 82 Kahului, Maui – 84 Hilo, Hawaii – 84
Kailua-kona – 86 Air Temperaturesranged between these warmest and coolest spots near sea level – and on the highest mountains…at 5 p.m. Wednesday evening:
Port Allen, Kauai – 86F
Kapalua, Maui – 77
Haleakala Crater – 46 (near 10,000 feet on Maui)
Mauna Kea summit – 41 (near 14,000 feet on the Big Island) Precipitation Totals – The following numbers represent the largest precipitation totals (inches) during the last 24 hours on each of the major islands, as ofWednesday afternoon:
0.56 Mount Waialaele, Kauai
0.94 Oahu Forest NWR, Oahu
0.06 Molokai
0.00 Lanai
0.08 Kahoolawe 0.29 Puu Kukui, Maui 0.73 Honaunau, Big Island
Marine Winds – Here’s the latest (automatically updated) weather mapshowing a 1023 millibar high pressure system to the northeast of the islands Thursday. This high pressure cell, along with its associated high pressure ridge…will keep the trade winds blowing through Friday.
Satellite and Radar Images:To view the cloud conditions we have here in Hawaii, please use the following satellite links, starting off with thisInfrared Satellite Image of the islands to see all the clouds around the state during the day and night. This next image is one that gives close images of the islands only during the daytime hours, and is referred to as a Close-up visible image. This next image shows a larger view of the Pacific…giving perspective to the wider ranging cloud patterns in the Pacific Ocean. Finally, here’s a LoopingIR satelliteimage, making viewable the clouds around the islands 24 hours a day. To help you keep track of where any showers may be around the islands, here’s the latest animatedradar image.
Hawaii’s Mountains – Here’s a link to the live webcam on the summit of near 14,000 footMauna Kea on the Big Island of Hawaii. The tallest peak on the island of Maui is theHaleakala Crater, which is near 10,000 feet in elevation. These two webcams are available during the daylight hours here in the islands…and when there’s a big moon rising just after sunset for an hour or two! Plus, during the nights and early mornings you will be able to see stars, and the sunrise too…depending upon weather conditions.
Tropical Cyclone activity in the eastern and central Pacific – Here’s the latest weather information coming out of the National Hurricane Center, covering the eastern north Pacific. You can find the latest tropical cyclone information for the central north Pacific (where Hawaii is located) by clicking on this link to the Central Pacific Hurricane Center. Here’s a tracking map covering both the eastern and central Pacific Ocean. A satellite image, which shows the entire ocean area between Hawaii and the Mexican coast…can be found here.
Aloha Paragraphs
Windward side Koolau Mountains…Oahu
As one would expect during the summer months here in the tropics, the trade winds are blowing.They are with us now, as they have been all this month, and as they will likely be through the rest of the month. We can thank the high pressure systems, sitting up to the north-northwest, and northeast of us Wednesday evening, for their presence…as shown on thisweather map. As this forecast weather map shows, a 1030 millibar high pressure system will be sitting up to the north-northwest of Hawaii by Friday. This stronger high pressure cell will be the reason that our trade wind speeds pick up a notch then into the weekend. As these winds gain that strength, we should see small craft wind advisories going up over those typically windier areas around Maui and the BigIsland later tomorrow…in anticipation. There’s nothing that should be too surprising as far as precipitation goes, at least through the rest of this work week.There are some clouds upstream of the islands this afternoon, which will keep off and on shower activity arriving along our windward coasts and slopes…there’s no apparent end in this moisture. Perhaps the most dynamic picture that we can look at now is the high cirrus clouds steaming off the tops of thunderstorms over by the International Dateline. This satellite imageshows how this icy cloudiness has dipped south of the islands, at least for the moment. If it were to scoot northward, we could begin having our sunset and sunrise colors again.
This time of the year we can sometimes get much needed rainfall from dissipated tropical cyclones, which were spawned in the eastern Pacific…and then slide in our direction, carried by the low level trade wind flow.There was an old tropical cyclone named Blanca, which has dissipated, but may bring in some of its remnant moisture Friday into the weekend. It may be a long shot, since Dolores is so far away now, in the eastern Pacific, but it may eventually bring in some of its remnant moisture as well. While we’re talking about tropical cyclones, or dissipated ones, current tropical storm Carlos continues to mind his manners, with a projected forecast keeping its path well south of the Hawaiian Islands…as a weak tropical depression at best. Here’s the NHC forecast track forCarlosandDolores. Finally, here’s bestsatellite image, showing both of these tropical storms over in the eastern Pacific.
It’s Wednesday evening here in Kihei, Maui, as I begin writing this last section of today’s narrative. Wednesday was another nice day here in Hawaii, although a bit more cloudy than most of our sun worshippers would have liked. There were some blue patches around, so that I’m quite sure that there was a bit of sun tanning going on despite the somewhat cloudier than normal beaches. ~~~ The trade winds are of course still blowing, with the strongest gusts at both Kahului, Maui, and South Point, on the Big Island of Hawaii. These two typically windier areas were showing gusts to 31 mph at a bit past 5pm. As for rainfall early this evening, despite all the clouds around, there weren’t all that many showers falling. Here’s a looping radar image showing this activity. Looking at this wider angle picture, we see some showers that will take aim on the windward sides tonight into early Thursday morning. The main items in that picture are certainly the abundant high cloudiness to the southwest through southeast! ~~~ I’m about ready to take the drive back upcountry now, to Kula. I’ll be back early Thursday morning with your next new weather narrative from paradise. I hope you have a great Wednesday night until then! Aloha, Glenn.
Interesting: Carlos became a hurricane for about 24 hours over the previous weekend, then powered down to a tropical storm and now atmospheric conditions have enabled him to power back into a hurricane in the Eastern Pacific Ocean. NASA’s Tropical Rainfall Measuring Mission (TRMM) satellite has been capturing images of Carlos since it was born as tropical depression #4E last week.
Scientists at NASA can use TRMM data to provide forecasters a 3-D look at the storm’s cloud heights and rainfall, which is extremely helpful in forecasting. "One of the interesting capabilities of the TRMM satellite is its ability to see through clouds with its Precipitation Radar (PR) and reveal the 3-D structure within storms such as Hurricane Carlos," said Hal Pierce, on the TRMM mission team in the Mesoscale Atmospheric Processes Branch at NASA’s Goddard Space Flight Center, Greenbelt, Md. Pierce created a
He used data captured on July 13 when TRMM also got a "top down" view of the storm’s rainfall, and created a 3-D image that shows thunderstorm tops reaching to almost 15 kilometers (9.3 miles) high in the eastern side of the storm. On Tuesday, July 14, 2009 at 6 a.m. EDT (3 a.m. PDT), Carlos had regained hurricane status as a Category One storm on the Saffir-Simpson Scale with maximum sustained winds near 75 mph.
Carlos was located near latitude 9.7 north and longitude 127.2 west. That’s about 1,465 miles or southwest of the southern tip of Baja California. Carlos continues to move west near 9 mph and has a minimum central pressure of 987 millibars. Carlos is predicted to move to within about 720 miles southeast of the Hawaiian Islands on Saturday, July 18, 2009.
Interesting2:No one knows exactly how much Earth’s climate will warm due to carbon emissions, but a new study suggests scientists’ best predictions about global warming might be incorrect. The study, which appears in Nature Geoscience, found that climate models explain only about half of the heating that occurred during a well-documented period of rapid global warming in Earth’s ancient past.
The study, which was published online July 13, contains an analysis of published records from a period of rapid climatic warming about 55 million years ago known as the Palaeocene-Eocene thermal maximum, or PETM. "In a nutshell, theoretical models cannot explain what we observe in the geological record," said oceanographer Gerald Dickens, a co-author of the study and professor of Earth science at Rice University. "There appears to be something fundamentally wrong with the way temperature and carbon are linked in climate models."
Interesting3:A runaway spurt of global warming 55 million years ago turned Earth into a hothouse but how this happened remains worryingly unclear. Previous research into this period, called the Palaeocene-Eocene Thermal Maximum, or PETM, estimates the planet’s surface temperature blasted upwards by between five and nine degrees Celsius in just a few thousand years. The Arctic Ocean warmed to 23C, or about the temperature of a lukewarm bath.
How PETM happened is unclear but climatologists are eager to find out, as this could shed light on aspects of global warming today. What seems clear is that a huge amount of heat-trapping "greenhouse" gases — natural, as opposed to man-made — were disgorged in a very short time.
The theorized sources include volcanic activity and the sudden release of methane hydrates in the ocean. But all this CO2 can only account for between one and 3.5C of PETM’s warming if the models for climate sensitivity are right, the team found.
There must have been some other factor that stoked temperatures higher. Even though there are big differences between Earth’s geology and ice cover then and now, the findings are relevant as they highlight the risk of hidden mechanisms that add dramatically to warming, says the paper.
Interesting4:Researchers from NOAA’s National Centers for Coastal Ocean Science and the Monterey Bay Aquarium Research Institute (MBARI) have carried out the first remote detection of a harmful algal species and its toxin. Harmful algae blooms (HABs) and marine biotoxins impact the whole marine food web and the human endeavors associated with living marine resources.
HAB events can occur in relatively small areas, many of them have origins in far off-shore oceanic environments. It is believed that climate change is expected to exacerbate HAB events, due to changes in water temperature and ocean circulation, which are influenced by climate.
Because of the scale of these HAB events, NOAA developed a HAP Operational Forecast System, used to develop predictions of the transport and potential development of harmful algae conditions in the Gulf of Mexico. This remote detection system is a major milestone in NOAA’s effort to monitor the type and toxicity of harmful algal blooms (HABs) and forecast their development.
The remote detection system is called the Environmental Sample Processor, or ‘ESP.’ The processor is designed as a fully-functional underwater laboratory, allowing researchers to collect and analyze the algal cells identifying specific toxins and genetic information in order to assess the risk to humans and wildlife.
Interesting5:Biologically speaking, many animals besides dogs bark, according to Kathryn Lord at the University of Massachusetts Amherst, but the evolutionary biologist also says domestic dogs vocalize in this way much more than birds, deer, monkeys and other wild animals that use barks. The reason is related to dogs’ 10,000-year history of hanging around human food refuse dumps, she suggests.
In her recent paper in a special issue of the journal, Behavioral Processes, Lord and co-authors from nearby Hampshire College also provide the scientific literature with its first consistent, functional and acoustically precise definition of this common animal sound. As Lord, a doctoral candidate in organisms and evolutionary biology at UMass Amherst, explains,
“We suggest an alternative hypothesis to one that many biologists seem to accept lately, which seeks to explain dog barking in human-centric terms and define it as an internally motivated vocalization strategy.” In the researchers’ view, however, barking is not a special form of communication between dogs and humans.
“What we’re saying is that the domestic dog does not have an intentional message in mind, such as, ‘I want to play’ or ‘the house is on fire,’” explains Lord. Rather, she and colleagues say barking is the auditory signal associated with an evolved behavior known as mobbing, a cooperative anti-predator response usually initiated by one individual who notices an approaching intruder.
A dog barks because she feels an internal conflict ? an urge to run plus a strong urge to stand her ground and defend pups, for example. When the group joins in, the barks intimidate the intruder, who often flees. “We think dogs bark due to this internal conflict and mobbing behavior, but domestic dogs bark more because they are put, and put themselves into, conflicting situations more often,” she says.
The reason traces back to the first dogs that started hanging around human food dumps about 8,000 to 10,000 years ago. They would have experienced a serious disadvantage if they had run a mile away every time a human or other animal approached.
As Lord explains, “In evolutionary terms, dogs self-selected the behavior of sticking around, overcoming their fear and being rewarded by getting to eat that meal before some other dog got it. Thus these animals allow people to get unusually close. The scared ones die while those less scared stay, eat, survive and reproduce. So they inherit the tendency.”
She adds, “By contrast, wild animals like wolves have a very long flight distance. They hear something and they run before you’d ever see them. Dogs hang around, but now they have committed to holding their ground and the closer an ‘intruder’ gets, the more likely mobbing is to occur rather than running away.”
July 14-15, 2009
Air Temperatures – The following maximum temperatures were recorded across the state of Hawaii Tuesday afternoon: Lihue, Kauai – 83 Honolulu, Oahu – 87 Kaneohe, Oahu – 83 Kahului, Maui – 85 Hilo, Hawaii – 83 Kailua-kona – 86 Air Temperaturesranged between these warmest and coolest spots near sea level – and on the highest mountains…at 5 p.m. Tuesday evening:
Barking Sands, Kauai – 85F
Lihue, Kauai – 79
Haleakala Crater – 50 (near 10,000 feet on Maui)
Mauna Kea summit – 43 (near 14,000 feet on the Big Island) Precipitation Totals – The following numbers represent the largest precipitation totals (inches) during the last 24 hours on each of the major islands, as ofTuesday afternoon:
0.42 Mount Waialaele, Kauai 0.20 Manoa Valley, Oahu
0.02 Molokai
0.00 Lanai
0.08 Kahoolawe 0.61 West Wailuaiki, Maui 1.59 Waiakea Uka, Big Island
Marine Winds – Here’s the latest (automatically updated) weather mapshowing high pressure systems to the northwest and northeast of the islands Wednesday. These high pressure cells, with their associated high pressure ridges, will keep the trade winds blowing through Thursday.
Satellite and Radar Images:To view the cloud conditions we have here in Hawaii, please use the following satellite links, starting off with thisInfrared Satellite Image of the islands to see all the clouds around the state during the day and night. This next image is one that gives close images of the islands only during the daytime hours, and is referred to as a Close-up visible image. This next image shows a larger view of the Pacific…giving perspective to the wider ranging cloud patterns in the Pacific Ocean. Finally, here’s a LoopingIR satelliteimage, making viewable the clouds around the islands 24 hours a day. To help you keep track of where any showers may be around the islands, here’s the latest animatedradar image.
Hawaii’s Mountains – Here’s a link to the live webcam on the summit of near 14,000 footMauna Kea on the Big Island of Hawaii. The tallest peak on the island of Maui is theHaleakala Crater, which is near 10,000 feet in elevation. These two webcams are available during the daylight hours here in the islands…and when there’s a big moon rising just after sunset for an hour or two! Plus, during the nights and early mornings you will be able to see stars, and the sunrise too…depending upon weather conditions.
Tropical Cyclone activity in the eastern and central Pacific – Here’s the latest weather information coming out of the National Hurricane Center, covering the eastern north Pacific. You can find the latest tropical cyclone information for the central north Pacific (where Hawaii is located) by clicking on this link to the Central Pacific Hurricane Center. Here’s a tracking map covering both the eastern and central Pacific Ocean. A satellite image, which shows the entire ocean area between Hawaii and the Mexican coast…can be found here.
Aloha Paragraphs
Lanikai Beach…windward Oahu
There remains no end in sight for our trade winds here in the Hawaiian Islands.Wind speeds will blow generally in the moderately strong category during the days, with a few of those typically windier locations finding somewhat stronger and gusty conditions. These common trade winds will be sourced by high pressure systems to the north-northwest and northeast of our Hawaiian Islands. Thisweather mapshows these two current high pressure cells, both weighing-in at 1027 millibars Tuesday evening.
Computer forecast models suggest that as we grade into the upcoming weekend time frame, our local trade wind speeds should accelerate a little bit.Today through Friday will likely see the small craft wind advisories laying low, although by the weekend, they could show themselves again…especially in those windy channels around Maui and the Big Island. The trade winds remain stronger upwind of the islands, than they are locally, so that the rough and choppy wind swell will keep the east shores active with surf…although considerably less than what would qualify as high surf advisory conditions. Besides an occasional isolated heavy shower, most areas will remain dry…with the bulk of the moisture falling along the windward sides.There remains a lobe of low pressure aloft over the islands. This is helping to bring an occasional heavy shower, most often over and around the windward coasts and slopes at night. Checking in with thislooping radar imageTuesday evening…there aren’t many showers around anyplace. There is a distinct lack of available moisture upstream from the islands, so that we will find less showers falling than the last several nights.
Hurricane Carlos in the eastern Pacific Ocean…is reaching its top strength now, and will become gradually weaker over the next several days.This NHC graphicaltrack mapshows where Carlos is, and where he’s headed. Most of the latest guidance shows this tropical system weakening as it moves by well to the south of the Hawaiian Islands, which is a good thing of course. Here’s asatellite pictureof Carlos in relation to the Hawaiian Islands…that small solid area of clouds, more or less around 129W longitude, and 10 degrees north latitude – in the eastern Pacific. Also showing up on this satellite image, is a second even larger tropical system…which has become tropical depression 05E…and will then take on the name tropical storm Dolores soon. That second storm won’t be getting as strong as hurricane Carlos (remaining a tropical storm), although might bring some rainfall to the Hawaiian Islands later next week.
It’s Tuesday evening here in Kula, Maui, as I begin writing this last section of today’s narrative. This evening finds hurricane Carlos is now sporting 90 knot sustained winds, with gusts to near 110 knots…which is impressive. The good thing here is that this hurricane is forecast to drop back down to a tropical storm or less, as it passes well south of the Hawaiian Islands early next week. That second storm, back to the east of Carlos has increased enough to be now be classified as a tropical depression. The long range forecast charts shows what will be called tropical storm Dolores, taking aim on our islands late next week, but it will likely have lost all of its strong winds by then. It may however bring some good rainfall to our islands as the remnant moisture gets carried towards us on the trade winds then.
~~~ It’s a little after 530pm at the time of this writing. The air temperature up here in Kula, I worked from home today, was 72.9F degrees, which is warm. Again, as I pointed out this morning, down at the Kahului airport, it was warmer at the same time, showing 81 degrees. I’m about ready to take my evening walk, and then come back and look for what I expect to be a colorful sunset. The reason I say that, is because we have more high cirrus clouds coming our way from the southwest…as shown on this looping satellite image. I’ll catch up with you again early Wednesday morning, I hope you have a great Tuesday night until then! Aloha for now…Glenn.
Interesting: A team of researchers from the University of Huelva has developed a environmentally friendly lubricating grease based on ricin oil and cellulose derivatives, according to the journal Green Chemistry. The new formula does not include any of the contaminating components used to manufacture traditional industrial lubricants.
"The objective of this research was to develop a product that could be used as a lubricating grease but that was made only from natural materials and was therefore 100% biodegradable", José María Franco, a chemical engineer at the University of Huelva and co-author of the study published recently in Green Chemistry, said.
Environmentally-friendly greases are "oleogels" that use cellulose derivatives from plants and ricin oil (from a bush in the Euphorbiaceae family) as a lubricant base. Franco says these new formulations are "an alternative to traditional lubricating greases, which create pollution that is difficult to combat once discharged into the environment".
Lubricants used in industry are made from non-biodegradable components, such as synthetic oils or petroleum derivatives, and thickeners made with metallic soaps or polyurea derivatives (a family of synthetic polymers). These are currently the best performers, but they also imply more problems from an environmental perspective.
Millions of tons of hydraulic and industrial oils, and others from machinery, are discharged each year into rivers, the sea and fields. Mineral-based oils can contaminate groundwater for more than 100 years, and can prevent the growth of trees and prove toxic to aquatic life.
Only partial solutions have been found to date for this problem, such as substituting mineral oil for vegetable ones, but no alternatives had been found to the metallic thickeners, which are also highly polluting. The new green grease provides an answer, although the scientists admit that "more research is needed" in order to perfect its lubricating and anti-wear performance.
Interesting2:Concern over access to clean water is no longer just an issue for the developing world, as California faces its worst drought in recorded history. According to state’s Department of Water Resources, supplies in major reservoirs and many groundwater basins are well below average. Court-ordered restrictions on water deliveries have reduced supplies from the two largest water systems, and an outdated statewide water system can’t keep up with population growth.
With these critical issues looming large, researchers at the UCLA Henry Samueli School of Engineering and Applied Science are working hard to help alleviate the state’s water deficit with their new mini-mobile-modular (M3) "smart" water desalination and filtration system. In designing and constructing new desalination plants, creating and testing pilot facilities is one of the most expensive and time-consuming steps.
Traditionally, small yet very expensive stationary pilot plants are constructed to determine the feasibility of using available water as a source for a large-scale desalination plant. The M3 system helps cut both costs and time.
"Our M3 water desalination system provides an all-in-one mobile testing plant that can be used to test almost any water source," said Alex Bartman, a graduate student on the M3 team who helped to design the sensor networks and data acquisition computer hardware in the system.
"The advantages of this type of system are that it can cut costs, and because it is mobile, only one M3 system needs to be built to test multiple sources. Also, it will give an extensive amount of information that can be used to design the larger-scale desalination plant."
The M3 demonstrated its effectiveness in a recent field study in the San Joaquin Valley in which it desalted agricultural drainage water that was nearly saturated with calcium sulfate salts, accomplishing this with just one reverse osmosis (RO) stage.
"In this specific field study by our team, in the first part of the reverse osmosis process, 65 percent of the water that was fed in was recovered as drinking water, or potable water," said Yoram Cohen, professor of chemical and biomolecular engineering and lead investigator on the team.
"We can potentially go up to 95 percent recovery using an accelerated chemical demineralization process that was also developed here at UCLA. This first field study with the M3 was a major achievement and the first phase of our high-recovery RO process demonstration program."
Interesting3:Rising levels of smokestack emissions from oceangoing ships will cause an estimated 87,000 deaths worldwide each year by 2012 — almost one-third higher than previously believed, according to the second major study on that topic. The study says that government action to reduce sulfur emissions from shipping fuel (the source of air pollution linked to an increased risk of illness and death) could reduce that toll.
James Winebrake and colleagues note that most oceangoing ships burn fuels with a high sulfur content that averages 2.4 percent. Their smokestacks emit sulfur-containing particles linked to increased risks of lung and heart disease.
A 2007 study by the researchers estimated that about 60,000 people died prematurely around the world due to shipping-related emissions in 2002. The new study estimates that the toll could rise to 87,000 by 2012, assuming that the global shipping industry rebounds from the current economic slump and no new regulation occurs.
Policymakers now are considering limiting ships emissions by either restricting sulfur content in fuel or designating air pollution control areas to reduce air pollution near highly populated coastal areas.
Requiring ships to use marine fuel with 0.5 percent sulfur within 200 nautical miles of shore would reduce premature deaths by about 41,200, the study concludes. Lower sulfur reductions could reduce deaths even further, they say, adding that designated emission control areas will also have a positive impact.
Interesting4:In 2009, the population of inadequately nourished people is projected to exceed 1 billion for the first time according to new estimates published by FAO. It is hard to imagine 1 billion people. Consider for example merely counting them: allowing just 1 second for each, counting day and night, it would take more than 30 years.
The most recent increase in hunger recorded by FAO is not the consequence of poor global harvests but is caused by the world economic crisis that has resulted in lower incomes and increased unemployment leading to reduced access to food by the poor.
If the new journal Food Security needed an early example to justify its breadth of coverage, the FAO report certainly provides it: originating from the International Society for Plant Pathology in a joint venture with Springer, Food Security is subtitled The Science, Sociology and Economics of Food Production and Access to Food.
The second issue of Food Security is now published, and is free online. It documents some of the multiple causes of food insecurity. Topics include desertification, flooding, adaptation of remote communities to modern technology, seasonality of food crops and the corresponding dearth between harvests, lack of iron in traditionally consumed food, resulting in anemia, and taboos that inhibit people from supplementing their diets with nutritious wild fruits that are readily available.
One paper also considers the vulnerability of our crops to acts of agro-terrorism. Conversely, the amelioration of dietary deficits is treated by several authors. Procedures include the establishment of policies that buffer countries against price swings of food materials on the international market, encouragement of domestic agriculture, a framework for deciding whether aid should be given in cash or in kind and construction of a dryer out of simple materials, which can be used to remove water from produce and consequently dramatically prolong its shelf life.
Interesting5:Last July, the City & County of San Francisco launched the first local solar energy incentive program in the nation. The results are in, and, the program is an unequivocal success. In the year since our solar energy incentive program GoSolarSF launched, we have seen a 450% increase in applications for solar installations in San Francisco over the previous year, from 200 to 850. And despite the current recession, 56 applicants met our low-income standards and will receive incentive payments.
And nonprofit and affordable housing organizations are going solar too. Just last week, I joined a local affordable housing developer, our San Francisco Housing Authority and our San Francisco Public Utilities Commission to announce three new solar installations at Hayes Valley North and South and Plaza East public housing in San Francisco.
Interesting6:The Food and Drug Administration believes antibiotics should be used on livestock only to cure or prevent disease and not to promote growth, a common use, said a high-ranking FDA official on Monday. Principal deputy FDA commissioner Joshua Sharfstein said restrictions on livestock use would reduce the opportunity for bacteria to develop resistance to drugs used by humans.
Critics of the heavy antibiotic use in livestock, such as the Union of Concerned Scientists, estimate 70 percent of all antibiotics sold in the United States are used on food animals, mostly in tiny doses that promote weight gain or more efficient feed consumption.
Other groups say livestock’s share of antibiotic use is much lower and the bulk of it goes to fighting or preventing disease. "Purposes other than for the advancement of animal or human health should not be considered judicious use" and not allowed, Sharfstein said in a statement for a House hearing. "Eliminating these uses will not compromise the safety of food.
Interesting7:Major China-based producers and users of palm oil have announced they intend to provide more support for sustainable palm oil, an important boost for efforts to halt tropical deforestation. The public statement, made at the 2nd International Oil and Fats Summit in Beijing on July 9, committed the companies to "support the promotion, procurement and use of sustainable palm oil in China," as well as "support the production of sustainable palm oil through any investments in producing countries."
China is currently the world’s largest importer of palm oil, accounting for one third of all global trade. Increasing demand for palm oil, which is used in everything from soap to chocolate bars, is causing considerable damage to fragile rainforest environments, threatening endangered species like tigers, and contributing to global climate change. Palm oil producers and buyers making the statement included Wilmar International, IOI Corporation, KLK Berhad, Kulim Malaysia Berhad, Asia Agri., Premier Foods PLC and Unilever PLC. Oxfam International, TransAsia Lawyers, and Solidaridad China were signatories.
July 13-14, 2009
Air Temperatures – The following maximum temperatures were recorded across the state of Hawaii Monday afternoon: Lihue, Kauai – 83 Honolulu, Oahu – 88 Kaneohe, Oahu – 83 Kahului, Maui – 85 Hilo, Hawaii – 80 Kailua-kona – 85 Air Temperaturesranged between these warmest and coolest spots near sea level – and on the highest mountains…at 5 p.m. Monday evening:
Port Allen, Kauai – 86F
Hilo, Hawaii – 78
Haleakala Crater – 52 (near 10,000 feet on Maui)
Mauna Kea summit – 43 (near 14,000 feet on the Big Island) Precipitation Totals – The following numbers represent the largest precipitation totals (inches) during the last 24 hours on each of the major islands, as ofMonday afternoon:
1.24 Mount Waialaele, Kauai 0.97 Manoa Valley, Oahu
0.15 Molokai
0.02 Lanai
0.00 Kahoolawe 1.76 Puu Kukui, Maui 1.46 Mountain View, Big Island
Marine Winds – Here’s the latest (automatically updated) weather mapshowing high pressure systems to the north-northwest and northeast of the islands. These high pressure cells, with their associated high pressure ridges, will keep the trade winds blowing through Wednesday.
Satellite and Radar Images:To view the cloud conditions we have here in Hawaii, please use the following satellite links, starting off with thisInfrared Satellite Image of the islands to see all the clouds around the state during the day and night. This next image is one that gives close images of the islands only during the daytime hours, and is referred to as a Close-up visible image. This next image shows a larger view of the Pacific…giving perspective to the wider ranging cloud patterns in the Pacific Ocean. Finally, here’s a looping IR satelliteimage, making viewable the clouds around the islands 24 hours a day. To help you keep track of where any showers may be around the islands, here’s the latest animatedradar image.
Hawaii’s Mountains – Here’s a link to the live webcam on the summit of near 14,000 footMauna Kea on the Big Island of Hawaii. The tallest peak on the island of Maui is theHaleakala Crater, which is near 10,000 feet in elevation. These two webcams are available during the daylight hours here in the islands…and when there’s a big moon rising just after sunset for an hour or two! Plus, during the nights and early mornings you will be able to see stars, and the sunrise too…depending upon weather conditions.
Tropical Cyclone activity in the eastern and central Pacific – Here’s the latest weather information coming out of the National Hurricane Center, covering the eastern north Pacific. You can find the latest tropical cyclone information for the central north Pacific (where Hawaii is located) by clicking on this link to the Central Pacific Hurricane Center. Here’s a tracking map covering both the eastern and central Pacific Ocean. A satellite image, which shows the entire ocean area between Hawaii and the Mexican coast…can be found here.
Aloha Paragraphs
Kona coast…on the Big Island
For the time being, and likely through the better part of this work week, our summertime trade winds will prevail.Wind speeds will blow generally in the moderately strong category during the days, with a few of those typically windier locations finding somewhat stronger and gusty conditions. These common trade winds will be sourced by high pressure systems to the north and northeast of our Hawaiian Islands. Thisweather mapshows these two current high pressure cells, weighing-in between 1027 and 1029 millibars Monday evening.
Computer forecast models suggest that as we grade into the upcoming weekend time frame, our local trade wind speeds should accelerate to some degree.Today through Thursday will likely see the small craft wind advisories laying low, although by Friday into the weekend, they could show themselves again…especially in those windy channels around Maui and the Big Island. The trade winds remain stronger upwind of the islands, than they are locally, so that the rough and choppy wind swell will keep the east shores active with surf…although considerably less than what would qualify as high surf advisory conditions. As is often the case during our summer month of July, most of the incoming showers, carried by the trade winds…fall along the windward sides during the night and early morning hours.There remains a lobe of low pressure aloft over the islands. This is having some influence, helping to wring-out an occasional heavy shower, most often over and around the windward coasts and slopes at night. Checking in with thislooping radar image, early Monday evening, when shower activity is often not enhanced this early…there wasn’t really anything too exciting going on.
When the sun goes down, and the air mass cools a little, the clouds often thicken, with increasing showers along those north and east facing windward areas.As we pull up our view, using this IRsatellite image, we see a few clouds stacked-up along our windward sides, from the Big Island up to Maui. If we pull back even more, we see the next possible batch of high cirrus clouds looming offshore to the southwest, coming our way on the upper winds from the deeper tropics…using thissatellite image.
Former tropical cyclone Blanca, which was a tropical storm in the eastern Pacific last week, poses some chance of bringing its remnant moisture our way this weekend.The bulk of these showers, if they hold together through this work week, would be a welcome source of summer rainfall. This time of year, when dry weather often prevails, we can use every drop that finds its way to our rainfall lacking islands.
The big news in terms of active tropical cyclones remains Carlos, which is scooting more or less westward…being classified as a tropical storm.This NHC graphicaltrack mapshows where Carlos is, and where it’s headed. Most of the latest guidance shows this tropical storm weakening as it moves by to the south of the Hawaiian Islands, which is a good thing of course. We don’t need any strong winds here in Hawaii, although we would, as noted above, like to see perhaps the northern fringe of this tropical system, bring a few showers to the BigIsland. Here’s asatellite pictureof Carlos in relation to the Hawaiian Islands…that small solid area of clouds, more or less around 128W longitude, and 10 degrees north latitude – in the eastern Pacific.
It’s Monday evening here in Kihei, Maui, as I begin writing this last section of today’s narrative.The cirrus clouds, which have been moving through the islands in an off and on manner lately, remain to the south and southwest of the islands Monday evening. However, there are more looming to our southwest, as shown on thissatellite image, and may spread overhead at times this week. Looking out the windows here in Kihei, after work, and before I drive back upcountry to Kula…it’s partly cloudy in general. I saw some showers in the Ulupalakua and Keokea area, on the Haleakala slopes earlier in the day. I would image that showers will fill back into the windward sides tonight, and remain active at times into early Tuesday morning. Speaking of which, I’ll meet you back here then, with the next new weather narrative. I hope you have a great Monday night! Aloha for now…Glenn.
Interesting: Attempting to tackle climate change by trapping carbon dioxide or switching to nuclear power will not solve the problem of global warming, according to energy calculations published in the July issue of the International Journal of Global Warming. Bo Nordell and Bruno Gervet of the Department of Civil and Environmental Engineering at Luleå University of Technology in Sweden have calculated the total energy emissions from the start of the industrial revolution in the 1880s to the modern day.
They have worked out that using the increase in average global air temperature as a measure of global warming is an inadequate measure of climate change. They suggest that scientists must also take into account the total energy of the ground, ice masses and the seas if they are to model climate change accurately.
The researchers have calculated that the heat energy accumulated in the atmosphere corresponds to a mere 6.6% of global warming, while the remaining heat is stored in the ground (31.5%), melting ice (33.4%) and sea water (28.5%).
They point out that net heat emissions between the industrial revolution circa 1880 and the modern era at 2000 correspond to almost three quarters of the accumulated heat, i.e., global warming, during that period.
Their calculations suggest that most measures to combat global warming, such as reducing our reliance on burning fossil fuels and switching to renewables like wind power and solar energy, will ultimately help in preventing catastrophic climate change in the long term.
But the same calculations also show that trapping carbon dioxide, so-called carbon dioxide sequestration, and storing it deep underground or on the sea floor will have very little effect on global warming.
Interesting2:H1N1 swine flu attacks the respiratory system in a more sustained way than the standard seasonal virus, research in animals shows. Tests showed swine flu multiplies in greater numbers across the respiratory system, and causes more damage.
And instead of staying in the head like seasonal flu, it penetrates deeper into the respiratory tissues – making it more likely to cause pneumonia. The University of Wisconsin study appears in the journal Nature.
It also suggests that swine flu may mimic the flu virus which caused the great pandemic of 1918, in which millions died. The 1918 virus also had a greater ability than standard flu to cause damage to the respiratory system. The researchers carried out their work on ferrets, monkeys and mice.
They also analyzed samples taken from people who survived the 1918 pandemic and found that they seem to have extra immune protection against the current virus – again suggesting similarities.
However, the Wisconsin team stressed that swine flu produced, in the vast majority of cases, only mild symptoms, and is still sensitive to anti-viral drugs. Professor Ian Jones, a flu expert at the University of Reading, said the latest study provided the complete analysis of the swine flu that researchers had been waiting for.
He said: "For a number of measures it shows that the new virus is more serious than seasonal H1N1 but that, nonetheless, the major outcome to infection is recovery. "For the few cases of severe infection the data should help in the clinical management of hospitalized patients.
Professor Wendy Barclay, an expert in virology at Imperial College London, said: "It must be borne in mind that typical circulating human strains of H1N1 have been associated with rather mild illness in recent years, and that the swine origin H1N1 may be behaving in these animal models more alike the type of H3N2 viruses that caused a pandemic in 1968." Swine flu is estimated to have infected more than a million people worldwide, and to have killed at least 500.
Interesting3:By the year 2050, about 30 million Americans are expected to suffer from Alzheimer’s disease. Experts in the field are trying to determine if sophisticated imaging equipment can help predict the development of the disease.
At 81, Alberta Sabin’s mind is not as sharp as it used to be, and she knows it. She frequently misplaces common items, forgets names and appointments, some of the most frustrating aspects of memory loss, she says. “I had been looking for my cell phone for three days and would you believe I found it laying on the counter in plain sight?,” Sabin says.
“There it was and I thought why didn’t I see it before?” It is that frustration that motivated Sabin to participate in U-M sponsored research designed to better diagnose and treat dementia before it escalates. Sabin is one of millions of Americans who experience memory loss and may eventually be diagnosed with dementia.
“This is an explosive disease,” says Sid Gilman, M.D., director of the Alzheimer’s Disease Research Center at University of Michigan Health System, who conducts research with Sabin and others in her community. “It’s a horrible disease that robs people of their humanity. They forget their families and friends.”
Roughly 50 percent of people who reach 85 will become demented, according to studies conducted by investigators at Rush Medical Center in Chicago. By age 100, the number spikes to 60 percent. Of those who develop dementia, roughly 60 percent will prove to have Alzheimer’s disease.
It’s predicted that the current number of patients with Alzheimer’s disease in the United States is roughly 5 million. By the year 2050, it will grow to about 30 million, presenting a significant financial burden to the health care system.
Interesting4:Honda Motor Co’s new chief executive said on Monday that Japan’s No.2 automaker would speed up the rollout of its hybrid cars as he aims to steer a nimble company that reacts more quickly to changing customer needs. In his first public appearance after taking office last month, Takanobu Ito said Honda would launch the planned CR-Z hybrid sports car next February and a gasoline-electric Fit subcompact by the end of 2010, citing the growing importance buyers place on fuel economy and environmental considerations. "I think everyone is going to go the way of hybrids," the 55-year-old former engineer told a media gathering at Honda’s headquarters in Tokyo.
Interesting5:Twelve European companies on Monday launched a 400-billion-euro (560-billion-dollar) initiative to set up huge solar farms in Africa and the Middle East to produce energy for Europe. The consortium says the massive project could provide up to 15 percent of Europe’s electricity needs by 2050. Engineering giants ABB and Siemens, energy groups E.ON and RWE and financial institutions Deutsche Bank and Munich Re are among companies which signed a protocol in Munich. "Today we have taken a step forward" towards the project’s realization, said Nikolaus von Bomhard, head of the reinsurance giant Munich Re, which hosted the signing.
Interesting6:One of Africa’s most important food crops is likely to become increasingly toxic as a result of carbon emissions. Cassava is a staple for more than half a billion of the world’s poorest people. It is promoted by UN agencies such as the Food and Agriculture Organization as a savior for Africa because it grows well in droughts.
But now research shows that increasing carbon dioxide in the air boosts cyanide levels in its leaves. Cassava leaves and roots both contain glycosides that break down to release toxic hydrogen cyanide when chewed or crushed. Villagers grind cassava roots to make flour, which can be processed to remove cyanide, but leaves are often eaten raw.
The cyanide can cause a condition called konzo that permanently paralyses the legs. One study found that 9 per cent of Nigerians suffer some form of cyanide poisoning from eating cassava. Interesting7:Electric car sales could jump to 86 percent of U.S. light vehicle sales in 2030 if consumers don’t have to buy batteries themselves, according to a University of California, Berkeley study to be released on Monday. A company called Better Place and emerging rivals plan to offer pay-per-mile plans, similar to cell phone minutes.
A family would buy a car but Better Place would own the battery, offer charging stations, and swap out batteries as needed to extend the driving range. The cost of building charging systems will be more than $320 billion over the next couple of decades, although health-related savings due to less vehicle pollution could be $210 billion, according to the study by economist Thomas Becker. The main benefit to drivers would be cars with price tags and operating costs similar to or less than gasoline models.
Interesting8:Early microbes may have relied on lightning to cook their dinner, say researchers. When lightning strikes sand or sediment, the path followed by the bolt can fuse into a glassy tube called a fulgurite. A new analysis of these remnants suggests that lightning fries the nutrient phosphorus into a more digestible form.
Most phosphorus on Earth exists as oxidised phosphate, but many microbes prefer a rarer, partially oxidized phosphorus – phosphite. Matthew Pasek and Kristin Block of the University of Arizona, Tucson, used an MRI scanner on 10 fulgurites and found that five contained phosphite. The surrounding soil only contained phosphate.
They suggest that the high energy of a lightning strike strips an oxygen atom from phosphate compounds, creating phosphites. "Early life may have used phosphite to form its key biomolecules, like RNA and DNA," says Pasek. Today, anthropogenic influences such as steel corrosion, provide the primary source of phosphites in the environment, but prior to anthropogenic input Pasek and Block believe lightning would have been the main source, producing up to 3000 kilograms of phosphites per year.
July 12-13, 2009
Air Temperatures – The following maximum temperatures were recorded across the state of Hawaii Sunday afternoon: Lihue, Kauai – 84 Honolulu, Oahu – 88 Kaneohe, Oahu – 82 Kahului, Maui – 86 Hilo, Hawaii – 83 Kailua-kona – 87 Air Temperaturesranged between these warmest and coolest spots near sea level – and on the highest mountains…at 4 p.m. Sunday afternoon:
Kapalua, Maui – 66F
Hilo, Hawaii – 79
Haleakala Crater – 54 (near 10,000 feet on Maui)
Mauna Kea summit – 45 (near 14,000 feet on the Big Island) Precipitation Totals – The following numbers represent the largest precipitation totals (inches) during the last 24 hours on each of the major islands, as ofSunday afternoon:
1.29 Mount Waialaele, Kauai 1.20 Poamoho 2, Oahu
0.03 Molokai
0.00 Lanai
0.00 Kahoolawe 0.55 Oheo Gulch, Maui 1.38 Glenwood, Big Island
Marine Winds – Here’s the latest (automatically updated) weather mapshowing 1027 and 1029 millibar high pressure systems to the northeast of the islands. These high pressure cells, with their associated high pressure ridges, will keep the trade winds blowing through Tuesday.
Satellite and Radar Images:To view the cloud conditions we have here in Hawaii, please use the following satellite links, starting off with thisInfrared Satellite Image of the islands to see all the clouds around the state during the day and night. This next image is one that gives close images of the islands only during the daytime hours, and is referred to as a Close-up visible image. This next image shows a larger view of the Pacific…giving perspective to the wider ranging cloud patterns in the Pacific Ocean. Finally, here’s a looping IR satelliteimage, making viewable the clouds around the islands 24 hours a day. To help you keep track of where any showers may be around the islands, here’s the latest animatedradar image.
Hawaii’s Mountains – Here’s a link to the live webcam on the summit of near 14,000 footMauna Kea on the Big Island of Hawaii. The tallest peak on the island of Maui is theHaleakala Crater, which is near 10,000 feet in elevation. These two webcams are available during the daylight hours here in the islands…and when there’s a big moon rising just after sunset for an hour or two! Plus, during the nights and early mornings you will be able to see stars, and the sunrise too…depending upon weather conditions.
Tropical Cyclone activity in the eastern and central Pacific – Here’s the latest weather information coming out of the National Hurricane Center, covering the eastern north Pacific. You can find the latest tropical cyclone information for the central north Pacific (where Hawaii is located) by clicking on this link to the Central Pacific Hurricane Center. Here’s a tracking map covering both the eastern and central Pacific Ocean. A satellite image, which shows the entire ocean area between Hawaii and the Mexican coast…can be found here.
Aloha Paragraphs
The famous Diamond Head Crater…Oahu
As has been the case through the last week, and will remain into the new work week ahead…the trade winds will continue to blow across our Hawaiian Islands. These common summertime trades will blow generally in the light to moderately strong levels, although those typically windier areas will be a bit more breezy. Here’s a weather map showing 1027 millibar high pressure systems to the northwest and northeast Sunday evening…the source of our breezy winds.
A weak upper level trough of low pressure remains over the Aloha state Sunday evening, which will keep showers in the forecast locally.The leeward sides will remain drier than the windward sides, although a few showers there, especially in the upcountary areas…could be locally heavy during the afternoons. This trough will remain around for several more days, with those enhanced showers sticking around too. As usual, the windward sides at night, will be the wettest areas.
Carlos has weakened from a hurricane, back to a tropical storm…in the eastern Pacific. Here’s atrack mapshowing Carlos, in relation to the Hawaiian Islands. It’s early to be talking about a tropical cyclone so far away, but if you have a chance to click on this track map, you’ll see that it will still be a tropical storm as it moves into our central Pacific…around the middle of the new week ahead. Here’s asatellite imageof Carlos, in relation to the Hawaiian Islands. It’s that orangish/red swirl far to the east-southeast, towards Mexico. It’s too early to know just what, if any, influence that this tropical cyclone may have on our Hawaiian Islands in about a week from now.
It’s Sunday evening here in Kula, Maui, as I begin writing this last paragraph of today’s narrative. Sunday remained drier than expected, with lots of sunshine, and not many showers. Checking out this looping radar image, we find few showers around this evening as well. There’s expected to be another surge in trade wind showers later tonight into Monday, so by the time you look at the radar image…there may be more showing up then. Looking at this IR satellite image, I see what looks to be the next area of high cirrus clouds moving in our direction…coming our way from the southwest of the islands. ~~~ My neighbors and I once again didn’t make it to the Haleakala Crater for a hike…I suppose there’s always next weekend. Looking out the window of my weather tower early this evening, I see mostly clear skies, with just the faint beginnings of those new high cirrus clouds showing up on the western horizon. Perhaps they will be more visible, and may become colorful towards sunset, when I’ll be out there on my weather deck watching. ~~~ I made a nice stir fry dish this afternoon, which included: organic zucchini, red onion, red pepper, mushrooms, and broccoli. I bbq’d some organic chicken thighs too, which I’ll plate together during the Monday through Thursday evening meals coming up. ~~~ I’ll be back early Monday morning with your next new weather narrative. I hope you have a great Sunday night until then! Aloha for now…Glenn.
Interesting: The Indian government has dramatically reduced water supplies in Mumbai. Water supplies have been reduced by 30% in Mumbai, as the region faces the worst drought in History. Homes, hotels and hospitals are surviving on extremely short water supplies due to the late arrival of the Monsoon rain.
Monsoon rain arrived later than normal to the region, and many of the major lakes rely solely on the Monsoon rain. This year so far the amount of rainfall is around 25% of what would normally have fallen by this time of year.
Mumbai is India’s most populated city with around 20 million people, and it’s a commercial film-making hub. Many of the inhabitants have never seen these measures being implemented.
Meteorologist Matt Keife explained that although the monsoonal moisture has moved into the region the rains are intermittent. There have been only a few days with significant rainfall. The lakes will suffer if they recede more due to the lack of heavy rain.
In many areas of the state of Maharashtra, there has been only 25% of the rainfall received compared to 2008. The residents are Mumbai are concerned that they will have to turn to private water companies as the wells feeding the city are below average levels.
Mumbai residents have been urged to use water sparingly as there may only be enough water for three more weeks in one lake. There are another two lakes which hold enough for a sparingly two-month use. Water is being given to each household for only two hours per day, so many people are waking up at the crack of dawn to shower.
Interesting2: International climate talks held in Italy this week ended with little progress. The rich industrial nations wouldn’t promise to cut back their emissions in the near term. And China, India and the rest of the developing world wouldn’t commit to cutting their emissions, ever.
All nations of the world need to act to reduce the risk of a climate catastrophe. But so far, there’s much more posturing than action. China argues that the United States and other rich nations put most of the carbon dioxide into the atmosphere, so they need to act first and most aggressively.
They demand that those nations slash their carbon dioxide emissions by a staggering 40 percent — in just 10 years. "Well, it’s obviously a totally unrealistic position, and it is not just the Chinese, it is the developing countries in general," says Eileen Claussen, president of the Pew Center on Global Climate Change, who was once a diplomat.
She regards this demand as little more than an over-the-top bargaining tactic. "I think, honestly, that doesn’t work, and it does create a backlash, because people think that they’re just not serious." But, Claussen says, China actually is serious about climate change.
The government believes it’s a real risk. But the country also feels it can’t wean itself from cheap fossil fuels just yet. Ken Lieberthal of the Brookings Institution says China is still struggling to pull hundreds of millions of people out of poverty.
Interesting3:Like most thoroughfares in booming cities of the developing world, Bogotá’s Seventh Avenue resembles a noisy, exhaust-coated parking lot — a gluey tangle of cars and the rickety, smoke-puffing private minibuses that have long provided transportation for the masses. But a few blocks away, sleek red vehicles full of commuters speed down the four center lanes of Avenida de las Américas. The long, segmented, low-emission buses are part of a novel public transportation system called bus rapid transit, or B.R.T.
It is more like an above-ground subway than a collection of bus routes, with seven intersecting lines, enclosed stations that are entered through turnstiles with the swipe of a fare card and coaches that feel like trams inside. Versions of these systems are being planned or built in dozens of developing cities around the world — Mexico City, Cape Town, Jakarta, Indonesia, and Ahmedabad, India, to name a few — providing public transportation that improves traffic flow and reduces smog at a fraction of the cost of building a subway.
Interesting4:Some cold medicines will shave a day off your suffering from the common cold, but they often produce unpleasant side effects. A new study shows, for the first time, that the doctor’s empathy may be an even better way to speed recovery.
People recover from the common cold faster if they believe their doctor shows greater compassion toward their illness, according to a University of Wisconsin School of Medicine and Public Health study, published in the July issue of Family Medicine.
The study, conducted in primary care clinics in southern Wisconsin, involved 350 participants who had one of three types of encounters with doctors: no interaction at all, a standard encounter with discussion of medical history and present illness, or an advanced interaction where the doctor asked more questions and seemed to show more concern for the patient.
Patients then rated doctors on a questionnaire which asked if the doctor made them feel at ease, allowed them to tell their story, listened to what they had to say, understood their concerns, acted positive, explained things clearly, helped them take control, and helped them create a plan of action.
Interesting5:Children and adults who build castles and dig in the sand at the beach are at greater risk of developing gastrointestinal diseases and diarrhea than people who only walk on the shore or swim in the surf, according to researchers from the University of North Carolina at Chapel Hill and the Environmental Protection Agency. People who playfully bury their bodies in the sand are at even greater risk, according to the study published online recently in the American Journal of Epidemiology.
It also shows children, who are more likely than adults to play with and possibly get sand in their mouths, stand the greatest chance of becoming ill after a day at the beach.
“Beach sand can contain indicators of fecal contamination, but we haven’t understood what that means for people playing in the sand,” said Chris Heaney, Ph.D., a postdoctoral epidemiology student at UNC’s Gillings School of Global Public Health and lead author of the study.
“This is one of the first studies to show an association between specific sand contact activities and illnesses.” The study is based on interviews with more than 27,000 people who visited seven freshwater and marine beaches in the agency’s National Epidemiological and Environmental Assessment of Recreational Water Study (NEEAR) between 2003 and 2005 as well as in 2007.
All beaches in the study had sewage treatment plant discharges within seven miles, although the source of sand pollution was unknown and could have included urban runoff as well as wild and domestic animal contamination. Water quality at the beaches was within acceptable limits, Heaney said.
“We have known for some time that swimming in waters polluted by fecal contamination can result in illness, but few previous studies have focused on sand,” said Tim Wade, Ph.D., an EPA epidemiologist and the study’s senior author.
“People should not be discouraged from enjoying sand at the beach, but should take care to use a hand sanitizer or wash their hands after playing in the sand.” People were asked about their contact with sand on the day they visited the beach (digging in the sand or whether they were buried in it).
Then, 10 to 12 days later, participants were telephoned and asked questions about any health symptoms they had experienced since the visit. Researchers found evidence of gastrointestinal illnesses, upper respiratory illnesses, rash, eye ailments, earache and infected cuts.
Diarrhea and other gastrointestinal illnesses were more common in about 13 percent of people who reported digging in sand, and in about 23 percent of those who reported being buried in sand. “A lot of people spend time at the beach, especially in the summer,” Heaney said.
“And while we found that only a small percentage of people who played at the beach became ill later – less than 10 percent in any age group, for any amount of exposure – it’s important to look at the situation more closely.
If we find evidence that shows exposure to sand really does lead to illness, then we can look for the sources of contamination and minimize it. That will make a day at the beach a little less risky.”


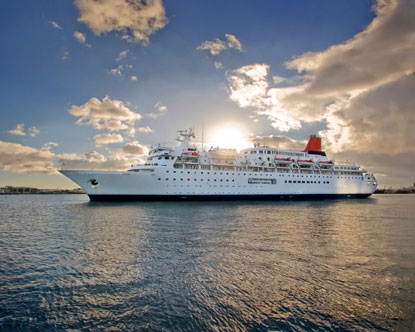


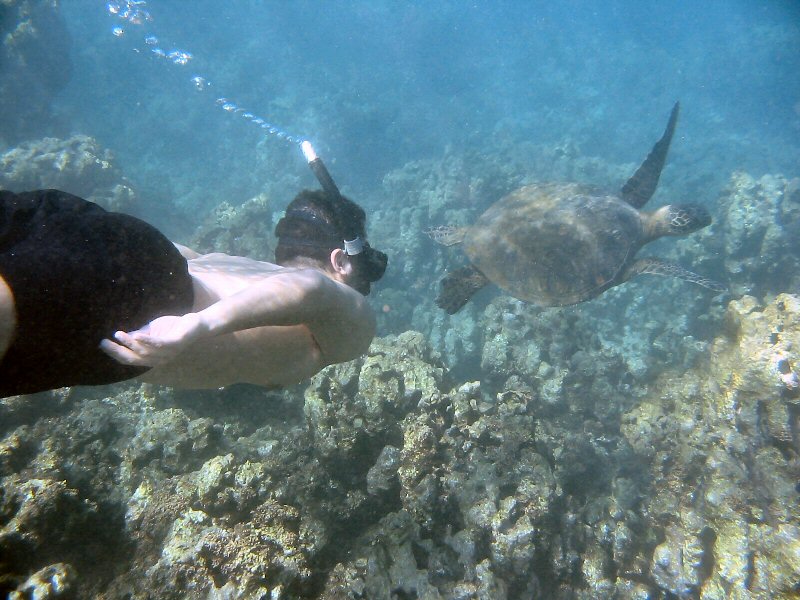


