July 2009
Monthly Archive
Posted by Glenn
No Comments
July 31-August 1, 2009
Air Temperatures – The following maximum temperatures were recorded across the state of Hawaii Friday afternoon:
Lihue, Kauai – 83
Honolulu, Oahu – 88
Kaneohe, Oahu – 83
Kahului, Maui – 87
Hilo, Hawaii – 85
Kailua-kona – 88
Air Temperatures ranged between these warmest and coolest spots near sea level – and on the highest mountains…at 5 p.m. Friday evening:
Port Allen, Kauai – 86F
Hilo, Hawaii – 77
Haleakala Crater – 52 (near 10,000 feet on Maui)
Mauna Kea summit – 73 (near 14,000 feet on the Big Island)
Precipitation Totals – The following numbers represent the largest precipitation totals (inches) during the last 24 hours on each of the major islands, as of Friday afternoon:
0.56 Mount Waialaele, Kauai
0.40 Oahu Forest NWR, Oahu
0.00 Molokai
0.00 Lanai
0.00 Kahoolawe
0.43 West Wailuaiki, Maui
0.11 Hakalau, Big Island
Marine Winds – Here’s the latest (automatically updated) weather map showing a high pressure system to the northeast of the islands. This high pressure cell, along with its associated ridge to our north, will keep the trade winds blowing through Sunday. Tropical storm Lana will move by to the south of the state.
Satellite and Radar Images: To view the cloud conditions we have here in Hawaii, please use the following satellite links, starting off with this Infrared Satellite Image of the islands to see all the clouds around the state during the day and night. This next image is one that gives close images of the islands only during the daytime hours, and is referred to as a Close-up visible image. This next image shows a larger view of the Pacific…giving perspective to the wider ranging cloud patterns in the Pacific Ocean. Finally, here’s a Looping IR satellite image, making viewable the clouds around the islands 24 hours a day. To help you keep track of where any showers may be around the islands, here’s the latest animated radar image.
Hawaii’s Mountains – Here’s a link to the live webcam on the summit of near 14,000 foot Mauna Kea on the Big Island of Hawaii. The tallest peak on the island of Maui is the Haleakala Crater, which is near 10,000 feet in elevation. These two webcams are available during the daylight hours here in the islands…and when there’s a big moon rising just after sunset for an hour or two! Plus, during the nights and early mornings you will be able to see stars, and the sunrise too…depending upon weather conditions.
Tropical Cyclone activity in the eastern and central Pacific – Here’s the latest weather information coming out of the National Hurricane Center, covering the eastern north Pacific. You can find the latest tropical cyclone information for the central north Pacific (where Hawaii is located) by clicking on this link to the Central Pacific Hurricane Center. Here’s a tracking map covering both the eastern and central Pacific Ocean. A satellite image, which shows the entire ocean area between Hawaii and the Mexican coast…can be found here.
Aloha Paragraphs

Sunset time in the islands
We should see a modest surge in our trade winds speeds this weekend, especially on Sunday…as tropical storm Lana moves by to the south of the Hawaiian Islands. The trade winds remain strong enough to keep a small craft wind advisory in those windiest areas around Maui County and the Big Island. Speaking of advisories, we also have a high surf advisory along our south and west facing leeward beaches as well. Looking into the future, it appears certain that the trades will extend well into the new week ahead.
The overlying atmosphere has become a little more stable and dry, which will limit shower activity as we move into the weekend…and likely beyond. The upper level trough of low pressure, which prompted a few thunderstorms the last couple of days, is moving away. The windward sides will continue to find a few passing showers, while the leeward sides should be mostly dry, and quite sunny during the days.
Tropical storm Lana is sticking pretty closely to her script, thank goodness…as this storm moves by to the south of our Hawaiian Islands. Here’s a track map, showing the expected course of travel to our south. At this point there doesn’t appear to be a threat to the Hawaiian Islands. We will however find our local trade winds picking up in strength this weekend, as it moves by. Here’s a satellite image showing this tropical cyclone to the southeast of the Hawaiian Islands.
Despite the passing of tropical storm Lana to the south of our islands, we should continue to see fair weather conditions prevailing through the weekend and beyond. The most likely influence, if any at all, would be for a modest surge in our local trade wind speeds. The storm will likely remain far enough south of the islands, that the northern fringe of rainfall associated with the storm, won’t reach far enough in our direction to bring precipitation to the Big Island. There are no other tropical cyclones active to the east, as far as the Mexican coast.
It’s Friday evening here in Kihei, Maui, as I begin writing this last part of this evening’s narrative. Friday was another nice day here in the islands, with lots of sunshine in most areas, although the usual daytime clouds prevailed as well. Showers will continue to be brought in by the trade winds, falling primarily along the windward sides. ~~~ I had plans to go to the movies with some friends, but that idea fell through. So, I’ve been invited to go have a drink with some of my co-workers here at the Pacific Disaster Center. I’ll stay for maybe an hour or so, and that made plans to have dinner with another friend here in Kihei. This is all pretty unusual, as I rarely stay in Kihei after work. I’m trying to branch out a little, push myself to do some new things, so this will be my first try to be a bit more social. ~~~ I’ll be back Saturday morning from Kula, where I’ll have your next new weather narrative from paradise available here. I hope you have a great Friday night from wherever you happen to be spending it! Aloha for now…Glenn.
Interesting: Next time you go for a dip in the sea, bear in mind that your deft front crawl is helping to mix up the waters. In fact, marine life may be stirring the oceans and moving nutrients around as much as winds or tides. According to a theory proposed by Darwin’s grandson, Charles Galton Darwin, a body moving through water drags some of the fluid with it.
In "Darwin drift", a high-pressure zone forms at the front of each swimming animal, leaving an area of lower pressure behind, which draws in adjacent water. This results in a net movement of fluid in the direction of the swimmer.
To test the idea, Kakani Katija and John Dabiri at the California Institute of Technology in Pasadena went to a lake in the Republic of Palau in the Pacific Ocean. Diving among swarms of jellyfish, the pair used suspended dyes and a newly designed laser velocimeter to measure the movement of water around the jellyfish.
They found that the animals did indeed drag water with them as they swam (Nature, vol 460, p 624). The researchers then estimated the total energy that all ocean swimmers impart on the water. They calculated that it was on a par with the mixing energy imparted by winds or tides. The findings suggest ocean swimmers can move water over long distances and that they could help run the vertical currents that push nutrients around between the sea floor and surface waters.
Interesting2: You probably hadn’t noticed — but the head shape and overall size of rodents has been changing over the past century. A University of Illinois at Chicago ecologist has tied these changes to human population density and climate change.
The finding is reported by Oliver Pergams, UIC research assistant professor of biological sciences, in the July 31 issue of PLoS One. Pergams said that such size-and-shape changes in mammals, occurring around the world in less than a century, are quite substantial.
He had done earlier studies on a century’s worth of anatomic changes between two geographically isolated rodents — Channel Island deer mice from coastal California and white-footed mice northwest of Chicago — and noted fast change among both.
"I suspected they weren’t unique examples," he said. "I wondered whether these changes were occurring elsewhere, whether they were global in nature, and what some of the causes may be."
Pergams examined specimen rodents from museums around the world, including the big collections held at Chicago’s Field Museum and the Smithsonian in Washington. Altogether, he recorded more than 17,000 body and skull measurements from 1,300 specimens from 22 locations in Africa, the Americas and Asia.
The animals were collected from 1892 to 2001, and Pergams compared those from before 1950 to those collected after. He also compared specimens gathered from sparsely populated islands to those from the mainland, where human populations were denser.
Pergams found both increases and decreases in the 15 anatomic traits he measured, with changes as great as 50 percent over 80 years. Ten of the 15 traits were associated with changes in human population density, current temperature, or trends in temperature and precipitation.
"Rapid change, contrary to previous opinion, really seems to be happening quite frequently in a number of locations around the world," Pergams said. "There seem to be significant correlations with ‘people-caused’ parameters, such as population density and anthropologically-caused climate change."
Interesting3: Comets have contained vast amounts of liquid water in their interiors during the first million years of their formation, a new study claims. The watery environment of early comets, together with the vast quantity of organics already discovered in comets, would have provided ideal conditions for primitive bacteria to grow and multiply.
So argue Professor Chandra Wickramasinghe and his colleagues at the Cardiff Centre for Astrobiology in a paper published in the International Journal of Astrobiology. The Cardiff team has calculated the thermal history of comets after they formed from interstellar and interplanetary dust approximately 4.5 billion years ago.
The formation of the solar system itself is thought to have been triggered by shock waves that emanated from the explosion of a nearby supernova. The supernova injected radioactive material such as Aluminium-26 into the primordial solar system and some became incorporated in the comets.
Professor Chandra Wickramasinghe together with Drs Janaki Wickramasinghe and Max Wallis claim that the heat emitted from radioactivity warms initially frozen material of comets to produce subsurface oceans that persist in a liquid condition for a million years. Professor Wickramasinghe said:
"These calculations, which are more exhaustive than any done before, leaves little doubt that a large fraction of the 100 billion comets in our solar system did indeed have liquid interiors in the past. Comets in recent times could also liquefy just below their surfaces as they approach the inner solar system in their orbits.
Evidence of recent melting has been discovered in recent pictures of comet Tempel 1 taken by the "Deep Impact" probe in 2005." The existence of liquid water in comets gives added support for a possible connection between life on Earth and comets. The theory, known as cometary panspermia, pioneered by Chandra Wickramasinghe and the late Sir Fred Hoyle argues the case that life was introduced to Earth by comets.
Interesting4: Scientists have joined forces in a groundbreaking assessment on the status of marine fisheries and ecosystems. The two-year study, led by Boris Worm of Dalhousie University and Ray Hilborn of the University of Washington and including an international team of 19 co-authors, shows that steps taken to curb overfishing are beginning to succeed in five of the ten large marine ecosystems that they examined.
The paper, which appears in the July 31 issue of the journal Science, provides new hope for rebuilding troubled fisheries. The study had two goals: to examine current trends in fish abundance and exploitation rates (the proportion of fish taken out of the sea) and to identify which tools managers have applied in their efforts to rebuild depleted fish stocks.
The work is a significant leap forward because it reveals that the rate of fishing has been reduced in several regions around the world, resulting in some stock recovery. Moreover, it bolsters the case that sound management can contribute to the rebuilding of fisheries elsewhere. It’s good news for several regions in the U.S., Iceland and New Zealand.
"These highly managed ecosystems are improving" says Hilborn. "Yet there is still a long way to go: of all fish stocks that we examined sixty-three percent remained below target and still needed to be rebuilt." "Across all regions we are still seeing a troubling trend of increasing stock collapse," adds Worm. "But this paper shows that our oceans are not a lost cause.
The encouraging result is that exploitation rate – the ultimate driver of depletion and collapse – is decreasing in half of the ten systems we examined in detail. This means that management in those areas is setting the stage for ecological and economic recovery. It’s only a start – but it gives me hope that we have the ability to bring overfishing under control."
The authors caution that their analysis was mostly confined to intensively managed fisheries in developed countries, where scientific data on fish abundance is collected. They also point out that some excess fishing effort is simply displaced to countries with weaker laws and enforcement capacity.
While most of the fisheries that showed improvement are managed by a few wealthy nations, there are some notable exceptions. In Kenya, for example, scientists, managers, and local communities have teamed up to close some key areas to fishing and restrict certain types of fishing gear.
This led to an increase in the size and amount of fish available, and a consequent increase in fishers’ incomes. "These successes are local – but they are inspiring others to follow suit," says Tim McClanahan of the Wildlife Conservation Society in Kenya.
"We know that more fish can be harvested with less fishing effort and less impact on the environment, if we first slow down and allow overfished populations to rebuild," adds co-author Jeremy Collie from the University of Rhode Island. "Scientists and managers in places as different as Iceland and Kenya, have been able to reduce overfishing and rebuild fish populations despite serious challenges."
Interesting5: Wild spider monkeys now have a new tool under their proverbial belt: a body scratcher that may release medicinal compounds, according to a study published in the latest issue of the journal Primates. The study is the first to report this spider monkey scratcher. Lead author Stacy Lindshield told Discovery News that two other instances of the use of objects as tools by the social monkeys have been documented.
"Spider monkeys have been observed rubbing crushed and chewed leaves on their bodies," said Lindshield, a researcher in Iowa State University’s Ecology and Evolutionary Biology Graduate Program. She explained that the smelly practice may "play a role in olfactory communication."
"Second, spider monkeys are known to break off branches and drop them on or near human observers," she added, "so it’s not a good idea to be directly beneath these guys!" She and co-author Michelle Rodrigues collected observational data on wild spider monkeys at El Zota Biological Field Station in northeastern Costa Rica.
They documented three instances where the monkeys used the scratcher tool. The first to scratch was an adult female. Holding a small, leafy branch in her hand, she scratched her chest and abdominal regions. The second, another adult female, used a detached stick lacking side branches and leaves to scratch her left side. She chewed the tool tip between bouts.
The third individual, a juvenile female, first chewed the distal tip of a stick before scratching the underside of her tail and her genital region. The scientists think that by modifying the scratcher tip, the monkeys could be providing "more relief and comfort during scratching."
The chewing alteration could "also be related to the chemical properties of the selected plant, as research on fur-rubbing and self-medication indicates that some primates select plants or invertebrates with chemical properties for this reason."
Like a human slathering on scented ointment, the plants may then be providing soothing compounds. Since the monkeys aren’t just scratching hard-to-reach spots, they could also be stimulating their own scent production glands, which are involved in nose-detecting communication.
Interesting6: There’s no question that the world’s fish are in trouble. Fishermen are pulling fish out of the seas far faster than these populations can grow back. Some fisheries are heading toward collapse or even extinction. But a major new analysis of this grim picture shows that fisheries aren’t doomed.
In fact, some are on the mend. This new study grew out of a raging controversy. Three years ago, Boris Worm and his colleagues at Dalhousie University in Canada sent shock waves through the world of fishing and fisheries science.
They published a paper in Science magazine showing that if current trends continued, the oceans would be essentially fished out by the middle of this century. Worm says this new analysis relies on much more scientific data to assess the state of the world’s fisheries.
And it is still not an upbeat report. Some of the good-news stories come from the United States. Strict federal fishing laws have cut back significantly on overfishing. And some stocks, such as haddock off New England, have rebounded so well, they are actually as healthy as they’ve ever been. Iceland, too, has rebuilt some of its fisheries.
Posted by Glenn
No Comments
July 30-31, 2009
Air Temperatures – The following maximum temperatures were recorded across the state of Hawaii Thursday afternoon:
Lihue, Kauai – 83
Honolulu, Oahu – 89
Kaneohe, Oahu – 83
Kahului, Maui – 87
Hilo, Hawaii – 84
Kailua-kona – 87
Air Temperatures ranged between these warmest and coolest spots near sea level – and on the highest mountains…at 5 p.m. Thursday evening:
Kailua-kona – 79F
Hilo, Hawaii – 71
Haleakala Crater – 48 (near 10,000 feet on Maui)
Mauna Kea summit – 34 (near 14,000 feet on the Big Island)
Precipitation Totals – The following numbers represent the largest precipitation totals (inches) during the last 24 hours on each of the major islands, as of Thursday afternoon:
1.96 Mount Waialaele, Kauai
0.29 Manoa Valley, Oahu
0.01 Molokai
0.00 Lanai
0.00 Kahoolawe
0.51 Puu Kukui, Maui
0.36 Glenwood, Big Island
Marine Winds – Here’s the latest (automatically updated) weather map showing a high pressure system to the northeast of the islands Friday. This high pressure cell, along with its associated ridge to our north, will keep the trade winds blowing through Saturday.
Satellite and Radar Images: To view the cloud conditions we have here in Hawaii, please use the following satellite links, starting off with this Infrared Satellite Image of the islands to see all the clouds around the state during the day and night. This next image is one that gives close images of the islands only during the daytime hours, and is referred to as a Close-up visible image. This next image shows a larger view of the Pacific…giving perspective to the wider ranging cloud patterns in the Pacific Ocean. Finally, here’s a Looping IR satellite image, making viewable the clouds around the islands 24 hours a day. To help you keep track of where any showers may be around the islands, here’s the latest animated radar image.
Hawaii’s Mountains – Here’s a link to the live webcam on the summit of near 14,000 foot Mauna Kea on the Big Island of Hawaii. The tallest peak on the island of Maui is the Haleakala Crater, which is near 10,000 feet in elevation. These two webcams are available during the daylight hours here in the islands…and when there’s a big moon rising just after sunset for an hour or two! Plus, during the nights and early mornings you will be able to see stars, and the sunrise too…depending upon weather conditions.
Tropical Cyclone activity in the eastern and central Pacific – Here’s the latest weather information coming out of the National Hurricane Center, covering the eastern north Pacific. You can find the latest tropical cyclone information for the central north Pacific (where Hawaii is located) by clicking on this link to the Central Pacific Hurricane Center. Here’s a tracking map covering both the eastern and central Pacific Ocean. A satellite image, which shows the entire ocean area between Hawaii and the Mexican coast…can be found here.
Aloha Paragraphs
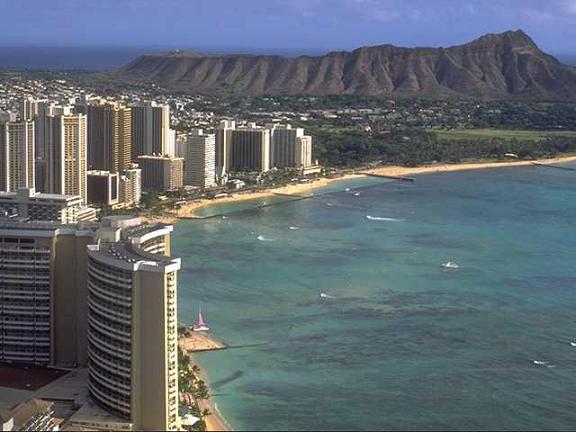
The famous Waikiki Beach…with Diamond Head Crater
The trade winds, despite being ever so slightly lighter now, will continue blowing through the rest of this work week…strengthening again by the weekend. A 1028 millibar high pressure system, located to the northeast of Hawaii, as shown on this weather map…is the source of our gusty breezes Thursday evening. It appears that our trade winds will extend well into the month of August. These refreshing trade winds will continue to moderate the afternoon heat near sea level.
The low pressure system over the islands, at upper levels of the atmosphere, will keep the chance of a heavy localized shower in the forecast into this evening. It looked as if the low prompted a few localized thunderstorms on the leeward slopes on the Big Island Thursday afternoon…and over the ocean north of Maui Thursday afternoon as well. This upper level trough of low pressure will fairly quickly lose its influence over our islands Friday into the weekend.
Strengthening tropical storm Lana may briefly reach hurricane strength, before weakening…as it passes south of the Hawaiian Islands. The hurricane models show that this storm should pass to the south of the Hawaiian Islands Sunday and Monday. Here’s a track map, showing the expected course of travel to our south. At this point there doesn’t appear to be a threat to the Hawaiian Islands. We will however find our local trade winds picking up in strength this weekend, as it moves by…and there’s a chance that some of this tropical storm’s precipitation might spread northward enough to clip the southern part of the Big Island. Here’s a satellite image showing this tropical cyclone to the southeast of the Hawaiian Islands.
It’s Thursday evening here in Kihei, Maui, as I begin writing this last part of this evening’s narrative. Our local trade winds may ease up a touch, but they won’t stay lighter for very long. As a matter of fact, as noted in the paragraphs above, they will become blustery again as we move into the weekend. The threat of locally heavy showers will be moving away soon, although there’s still the chance of a few downpours around Maui and the Big Island into the evening hours. The most interesting weather concern, I suppose we could call it that, will be strengthening tropical storm Lana, down to the southeast of the Hawaiian Islands. There’s a tracking map, and a satellite image available in the paragraph above. Current tropical storm Lana is expected to become a hurricane for part of the day Friday, but by the weekend, it should come under the influence of stronger winds aloft (a weakening process)…which should begin to shear the top layers of the tropical cyclone. I’ll have more to say about all this early Friday morning, when I get back online with your next new weather narrative. I hope you have a great Thursday night until then! Aloha for now…Glenn.
Interesting: The National Oceanic and Atmospheric Administration (NOAA) has published a final rule in the Federal Register prohibiting the harvesting of krill in the Exclusive Economic Zone (EEZ) off the coasts of California, Oregon, and Washington. The rule goes into effect on August 12, 2009. Krill are a small shrimp-like crustacean and a key source of nutrition in the marine food web.
"Krill are the foundation for a healthy marine ecosystem," said Mark Helvey, NOAA’s Fisheries Service Southwest Assistant Regional Administrator for Sustainable Fisheries. "Protecting this vital food resource will help protect and maintain marine resources and put federal regulations in line with West-Coast states."
While the States of California, Oregon and Washington currently have regulations prohibiting the harvesting of krill within three miles of their coastlines, there was no similar federal restriction within the three to 200-mile confines of the EEZ.
The krill prohibition was adopted as Amendment 12 to the Coastal Pelagic Species Fishery Management Plan (FMP), which was developed by the Pacific Fishery Management Council (PFMC) under the Magnuson-Stevens Fishery Conservation and Management Act.
The krill harvest prohibition was originally proposed to the PFMC and NOAA Fisheries Service by NOAA’s Office of National Marine Sanctuaries. Today’s rule implements Amendment 12 to the FMP and is intended to preserve key nutritional relationships in the California Current ecosystem, which includes five National Marine Sanctuaries.
"This is a great success for protecting the entire California Current ecosystem", said William Douros, West Coast Regional Director for NOAA’s Office of National Marine Sanctuaries. "This decision reflects strong teamwork within NOAA and a commitment to addressing the issues raised by the Pacific Fishery Management Council and Sanctuary Advisory Councils."
Interesting2: Rates of severe childhood obesity have tripled in the last 25 years, putting many children at risk for diabetes and heart disease, according to a report in Academic Pediatrics by an obesity expert at Brenner Children’s Hospital, part of Wake Forest University Baptist Medical Center. "Children are not only becoming obese, but becoming severely obese, which impacts their overall health," said Joseph Skelton, M.D., lead author and director of the Brenner FIT (Families in Training) Program.
"These findings reinforce the fact that medically-based programs to treat obesity are needed throughout the United States and insurance companies should be encouraged to cover this care." The research was published online and will appear in the September print edition. Skelton and colleagues compared data from the National Health and Nutrition Examination Survey (NHANES).
They looked at the prevalence of obesity and severe obesity in a study population of 12,384 children, representing approximately 71 million U.S. children ages 2 to 19 years. Severe childhood obesity is a new classification for children and describes those with a body mass index (BMI) that is equal to or greater than the 99th percentile for age and gender.
For example, a 10-year-old child with a BMI of 24 would be considered severely obese, Skelton said, whereas in an adult, that is considered a normal BMI. An expert committee convened by the American Medical Association, the Centers for Disease Control and the Department of Health and Human Services proposed the new classification in 2007.
Interesting3: A mobile pilot system could make preliminary feasibility tests for desalination easier and cheaper for developing countries. The system — known as ‘M3’ — can test whether fresh water can be extracted from almost any water source, said a team from the US-based University of California, Los Angeles (UCLA).
It harnesses a popular desalination technique known as reverse osmosis, a filtration process that forces water through a membrane, filtering out impurities. Desalination is often costly but the M3 system can cut costs.
Normally, a new static pilot plant must be constructed at every potential water source both to test water quality and to assess strategies for pre-treating water. Pre-treatment is needed to remove impurities before they pollute the reverse osmosis membranes.
These are costly to clean and replacing them, means shutting down desalination plants, Nidal Hilal, director of the Centre for Clean Water Technologies at Nottingham University, United Kingdom said. M3’s flexible and portable nature means that a country interested in desalination could buy one system and use it to test all potential water sources, says UCLA team leader Yoram Cohen — saving time as well as money.
Interesting4: Several years ago, it looked as though the United States was running short of natural gas. Prices spiked as declining production in old fields collided with increasing industrial demand. Electric utilities shifted from ‘clean’ gas back to cheap coal, and suppliers began building terminals to import liquefied natural gas from abroad.
Yet today, coal-fired power is again on the wane, ports for liquefied natural gas are idling below capacity, and the nation is awash with gas. So what happened? Clearly, the threat of carbon regulation has curbed industry’s appetite for coal, and the sagging economy has depressed energy demand across the board. But just as importantly, natural-gas production is again on the rise.
Thanks to advances in drilling technology, including horizontal drilling and more effective rock fracturing, producers have at last unlocked the vast quantities of gas trapped underground in impermeable strata of shale.
The Potential Gas Committee, a volunteer group of industry, government and academic experts headquartered in Golden, Colorado, increased its estimate of recoverable gas reserves by 39% in its biennial report released last month, mostly because of shale gas.
The new total, almost 60 trillion cubic meters, is equivalent to about a century’s worth of gas at current usage rates. Policy-makers everywhere should take note. Shale formations similar to those that have upended the US natural-gas market exist all over the world.
Early explorations are already under way in Canada and several European countries, many of which are overly reliant on coal and politically risky Russian gas imports. And there is no reason to think the development will stop there.
Interesting5: The growing shortage of water – a perennial problem in the world’s poorer nations – is expected to eventually reach the rich nations in the Western world. The United States, Spain, Australia and the Netherlands are likely to face the consequences of climate change resulting in water-related disasters, including droughts, floods, hurricanes and sea-level rise.
"Even the world’s richest nations are not immune," U.N. Secretary-General Ban Ki-moon warned Tuesday. Citing official U.S. figures, he said the state of California, the world’s fifth largest economy, "could see prime farmland reduced to a dustbowl, and major cities running out of water by the end of the century".
Blaming it on the negative impact of global warming, he said that climate is changing – globally. "And so, therefore, must we." He quoted scientists as saying that by 2020, 75 to 250 million people in Africa will face growing shortages of water due to climate change.
Interesting6: Among many reasons not to flush medicines down the drain or throw them out with the trash is to prevent the chemicals from decomposing in soil and water supplies. Chemicals are passed on to wildlife and humans consuming that water, and the chemicals may destroy important bacteria in soils and water that actually help purify those resources.
To date, wastewater treatment systems are not setup to remove those contaminants, and that does not consider the runoff leaking directly into bodies of water or consumed by wildlife.
In an effort to halt flushing and tossing, the National Association of Counties has adopted a resolution the "Support of a Safe, Convenient Medicine Return Program" that places at least some of the responsibility of proper medicine disposal on the vendors supplying medicine to consumers.
The Association is identifying non-governmental funds available to locate a pharmaceutical manufacturer who can collect medicine for proper disposal. Similar functioning efforts, known as take back programs, are working throughout communities in America and Canada.
In an era when nearly everyone is taking some sort of medication, popular prescriptions including anti-depressants, cholesterol controllers, and oral contraceptives, statistics are showing frightening rates of improper disposal. According to the investigative work conducted in informing the policy’s reviewers and decision makers, medicine metabolites are found in the drinking supplies of "24 major metropolitan areas affecting 41 million Americans."
Posted by Glenn
No Comments
July 29-30, 2009
Air Temperatures – The following maximum temperatures were recorded across the state of Hawaii Wednesday afternoon:
Lihue, Kauai – 83
Honolulu, Oahu – 89
Kaneohe, Oahu – 83
Kahului, Maui – 87
Hilo, Hawaii – 84
Kailua-kona – 87
Air Temperatures ranged between these warmest and coolest spots near sea level – and on the highest mountains…at 4 p.m. Wednesday afternoon:
Port Allen, Kauai – 86F
Princeville, Kauai – 77
Haleakala Crater – 55 (near 10,000 feet on Maui)
Mauna Kea summit – 61 (near 14,000 feet on the Big Island)
Precipitation Totals – The following numbers represent the largest precipitation totals (inches) during the last 24 hours on each of the major islands, as of Wednesday afternoon:
2.95 Mount Waialaele, Kauai
0.70 South Fork Kaukonahua, Oahu
0.00 Molokai
0.00 Lanai
0.00 Kahoolawe
2.65 Puu Kukui, Maui
0.78 Kamuela upper, Big Island
Marine Winds – Here’s the latest (automatically updated) weather map showing a 1028 millibar high pressure system to the northeast of the islands Thursday. This high pressure cell, along with its associated ridge to our north, will keep the trade winds blowing through Friday.
Satellite and Radar Images: To view the cloud conditions we have here in Hawaii, please use the following satellite links, starting off with this Infrared Satellite Image of the islands to see all the clouds around the state during the day and night. This next image is one that gives close images of the islands only during the daytime hours, and is referred to as a Close-up visible image. This next image shows a larger view of the Pacific…giving perspective to the wider ranging cloud patterns in the Pacific Ocean. Finally, here’s a Looping IR satellite image, making viewable the clouds around the islands 24 hours a day. To help you keep track of where any showers may be around the islands, here’s the latest animated radar image.
Hawaii’s Mountains – Here’s a link to the live webcam on the summit of near 14,000 foot Mauna Kea on the Big Island of Hawaii. The tallest peak on the island of Maui is the Haleakala Crater, which is near 10,000 feet in elevation. These two webcams are available during the daylight hours here in the islands…and when there’s a big moon rising just after sunset for an hour or two! Plus, during the nights and early mornings you will be able to see stars, and the sunrise too…depending upon weather conditions.
Tropical Cyclone activity in the eastern and central Pacific – Here’s the latest weather information coming out of the National Hurricane Center, covering the eastern north Pacific. You can find the latest tropical cyclone information for the central north Pacific (where Hawaii is located) by clicking on this link to the Central Pacific Hurricane Center. Here’s a tracking map covering both the eastern and central Pacific Ocean. A satellite image, which shows the entire ocean area between Hawaii and the Mexican coast…can be found here.
Aloha Paragraphs

Stalk of bananas, ready for harvest…Hawaii
The trade winds are softening just a touch now, although most folks won’t notice. The winds are however light enough, that the NWS forecast office in Honolulu has dropped the small craft wind advisories, in those windiest areas around Maui and the Big Island Wednesday evening. A 1028 millibar high pressure system, far to our north-northeast, as shown on this weather map…is the source of our gusty breezes. It appears that our trade winds will extend well into the month of August. August on average has the trade winds blowing 94% of the time here in Hawaii.
An upper level low pressure system will continue to enhance our incoming trade wind showers…and cause a locally heavy shower along the leeward slopes of the Big Island. This upper level trough of low pressure will be in our area over the next several days. This low prompted a localized thunderstorm on the leeward slopes of Mauna Loa, on the Big Island Wednesday afternoon. As the low moves away towards the weekend, we should settle back into a fairly normal trade wind weather pattern.
The computer models, both the GFS and the NOGAPS show a tropical low pressure system moving by to the south of the state later this coming Sunday into early next week on Monday. At this point, the low looks like it will have little influence on our weather. It may be close enough however, that it would enhance the speed of our local trade winds as it passed by. There’s also a fairly good chance that its northward edge would be able to carry some showers towards the Big Island. Here’s a picture of this area, to the southeast of the islands.
As indicated above, the most interesting aspect of our weather circumstances, is the upper low pressure system, with its associated cold air aloft. This cold air has had some destabilizing influence our air mass, with some enhancement of showers along the windward sides, and over the leeward slopes on the southern islands during the afternoons. A good indication of this was the 2.95" amount of rain that fell during the last 24 hours, at Mount Waialaele on Kauai…and the 2.65" total atop the West Maui Mountains…at the Puu Kukui rain gauge.
It’s Wednesday evening here in Kihei, Maui, as I begin writing this last part of today’s narrative. Looking out the window here in Kihei, before I take the drive back upcountry to Kula, it’s windy out there. Speaking of wind, at around 530pm, the strongest gust around the islands was 40 mph gust at Maalaea Bay here on Maui. In contrast, the lightest was 4 mph breeze at wind protected Barking Sands, on the leeward side of Kauai. There are some clouds out there too, although no cumulonimbus (thunderstorm clouds), like were reported on the Big Island this afternoon. I expect more or less similar weather conditions on Thursday as we saw Wednesday. ~~~ My neighbors invited me down for dinner tonight, this particular neighbor is the Director of the Astronomy Institute here on Maui, along with his Acupuncturist daughter. She is a good cook, so I’m sure I’ll be eating well…and partaking in good conversation too. Before I go over there, I’ll fit in a nice walk. I’ll meet you here early Thursday morning with your next new weather narrative from paradise. I hope you have a good night, and will plan on meeting me here again soon. Aloha for now…Glenn.
Interesting: The water at American beaches was seriously polluted and jeopardized the health of swimmers last year with the number of closing and advisory days at ocean, bay and Great Lakes beaches reaching more than 20,000 for the fourth consecutive year, according to the 19th annual beach water quality report released today by the Natural Resources Defense Council (NRDC). "Pollution from dirty storm water runoff and sewage overflows continues to make its way to our beaches.
This not only makes swimmers sick — it hurts coastal economies," said Nancy Stoner, NRDC Water Program Co-Director. "Americans should not suffer the consequences of contaminated beach water. From contracting the flu or pink eye, to jeopardizing millions of jobs and billions of dollars that rely on clean coasts, there are serious costs to inaction."
Using data from the U.S. Environmental Protection Agency, NRDC’s report — Testing the Waters: A Guide to Water Quality at Vacation Beaches — confirms that our nation’s beach waters continue to suffer from serious contamination — including human and animal waste — that can make people sick. NRDC’s report also provides a 5-star rating guide for 200 of the nation’s most popular beaches, based on indicators of beach water quality, monitoring frequency, and public notification of contamination.
Five-star beaches included Gulf Shores Public Beach (AL), Laguna Beach-Main Beach (CA), Bolsa Chica State Beach in Huntington Beach (CA), Newport Beach (CA), Ocean City (MD), Park Point — Community Club Beach in Duluth (MN) and Hampton Beach State Park in Hampton (NH). Some of the lowest ranking beaches (1-star) were Zach’s Bay at Jones Beach State Park in Wantagh (NY), Ocean Beach Park in New London (CT), Venice Public Beach (FL) and Central Beach in Point Pleasant (NJ).
Interesting2: Smokeless tobacco products, as used in Europe and North America, do not appear to increase cancer risk. A large meta-analysis, published in the open access journal BMC Medicine, has shown that snuff as used in Scandinavia has no discernible effect on the risk of various cancers. Products used in the past in the USA may have increased the risk, but any effect that exists now seems likely to be quite small.
Peter Lee and Jan Hamling, from P.N. Lee Statistics and Computing Ltd, carried out the analysis of 89 studies from the United States and Scandinavia. They found that, after adjustment for concurrent smoking, any effect of current US products or Scandinavian snuff seems very limited.
According to Lee, "It is clear that any effect of smokeless tobacco on risk of cancer, if it exists at all, is quantitatively very much smaller than the known effects of smoking". In 2005 in US men aged 35 or over, there were a total of 142,205 deaths from seven cancers considered to be caused by smoking.
If these people had never smoked, Lee and Hamling estimated that the numbers would have reduced by 104,737, with the reduction in lung cancer deaths, 79,195, being the major contributor.
If smokeless tobacco was introduced to a similar population of never smokers, this meta-analysis shows that any increase in risk would be negligible compared to the lives saved by reducing cigarette use.
Lee said, "Our paper shows very clearly that, in marked contrast to smoking, smokeless tobacco use carries little or no risk of cancer. Concerns about possible effects of smokeless tobacco on oral cancer are answered by our analyses showing a lack of relationship based on the combined evidence from those 14 studies published since 1990 which allow adequate control for effects of smoking."
Interesting3: Governments must act urgently to halt loss of habitats and invading species that are posing major threats to biodiversity and causing species extinctions across Australia, New Zealand and the Pacific Islands, according to a landmark new study. Published in the international journal Conservation Biology, the report is the first comprehensive review of more than 24,000 scientific publications related to conservation in the Oceanic region.
Compiled by a team of 14 scientists, it reveals a sorry and worsening picture of habitat destruction and species loss. It also describes the deficiencies of and opportunities for governmental action to lessen this mounting regional and global problem.
"Earth is experiencing its sixth great extinction event and the new report reveals that this threat is advancing on six major fronts," says the report’s lead author, Professor Richard Kingsford of the University of New South Wales.
"Our region has the notorious distinction of having possibly the worst extinction record on earth. This is predicted to continue without serious changes to the way we conserve our environments and dependent organisms.
We have an amazing natural environment in our part of the world but so much of it is being destroyed before our eyes. Species are being threatened by habitat loss and degradation, invasive species, climate change, overexploitation, pollution and wildlife disease."
Interesting4: NOAA-supported scientists, led by Nancy Rabalais, Ph.D., from the Louisiana Universities Marine Consortium (LUMCON), found the size of this year’s Gulf of Mexico dead zone to be smaller than forecasted, measuring 3,000 square miles. However the dead zone, which is usually limited to water just above the sea floor, was severe where it did occur, extending closer to the water surface then in most years.
Earlier this summer, NOAA-sponsored forecast models developed by R. Eugene Turner, Ph. D. of Louisiana State University and Donald Scavia, Ph.D. of the University of Michigan, predicted a larger than normal dead zone area of between 7,450 – 8,456 square miles.
The forecast was driven primarily by the high nitrate loads and high freshwater flows from the Mississippi and Atchafalaya rivers in spring 2009 as measured by the U.S. Geological Survey. Rabalais believes the smaller than expected dead zone is due to unusual weather patterns that re-oxygenated the waters, among other factors.
"The winds and waves were high in the area to the west of the Atchafalaya River delta and likely mixed oxygen into these shallower waters prior to the cruise, thus reducing the area of the zone in that region," said Rabalais.
"The variability we see within each summer highlights the continuing need for multiple surveys to measure the size of the dead zone in a more systematic fashion."
"The results of the 2009 cruise at first glance are hopeful, but the smaller than expected area of hypoxia appears to be related to short-term weather patterns before measurements were taken, not a reduction in the underlying cause, excessive nutrient runoff." said Robert Magnien, PhD., director of NOAA’s Center for Sponsored Coastal Ocean Research.
"The smaller area measured by this one cruise, therefore, does not represent a trend and in no way diminishes the need for a harder look at efforts to reduce nutrient runoff." The average size of the dead zone over the past five years, including this cruise, is now 6,000 square miles.
The interagency Gulf of Mexico/Mississippi River Watershed Nutrient Task Force has a goal to reduce or make significant progress toward reducing this dead zone average to 2,000 square miles or less by 2015. The Task Force uses a five year average due to relatively high interannual variability.
The dead zone is fueled by nutrient runoff, principally from agricultural activity, which stimulates an overgrowth of algae that sinks, decomposes, and consumes most of the life-giving oxygen supply in the water. The Gulf of Mexico dead zone is of particular concern because it threatens valuable commercial and recreational Gulf fisheries that generate about $2.8 billion annually.
Interesting5: We’ve all experienced it after long hours driving, the eyelids getting heavy, a deep yawn, neck muscles relaxing, the urge to sleep, the head nodding down… But, you’re hands are still on the wheel and you only just stopped yourself nodding off in time to avoid the oncoming traffic. But what if your car could keep an eye on you while you drive and nudge you when you starting yawning and warn you to pull over and take a break?
That’s the aim of a new in-car yawn-detection system being developed by an international team in the US and India. Aurobinda Mishra of Vanderbilt University, in Nashville, TN, and colleagues Mihir Mohanty of ITER, in Orissa and Aurobinda Routray of IIT, West Bengal, India, have developed a computer program that can tell when you are yawning and could prevent road traffic accidents.
The US National Highway Traffic Safety Administration estimates that at least 100,000 road crashes are caused by driver fatigue each year. The new program is based around an in-car camera hooked up to image-processing software that captures a sequence of images of the driver’s face. It then analyses changes in the face and accurately identifies yawning as distinct from other facial movements such as smiling, talking, and singing.
The yawn frequency is then correlated with fatigue behavior and could then be hooked up to a warning system to alert drivers to the need to take a break. The algorithm is effective at yawn detection regardless of image intensity and contrast, small head movements, viewing angle, spectacle wearing, and skin color.
Interesting6: As the climate warms in the coming decades, atmospheric scientists at Harvard’s School of Engineering and Applied Sciences (SEAS) and their colleagues expect that the frequency of wildfires will increase in many regions. The spike in the number of fires could also adversely affect air quality due to the greater presence of smoke.
The study, led by SEAS Senior Research Fellow Jennifer Logan, was published in the June 18th issue of Journal of Geophysical Research. In their pioneering work, Logan and her collaborators investigated the consequences of climate change on future forest fires and on air quality in the western United States.
Previous studies have probed the links between climate change and fire severity in the West and elsewhere. The Harvard study represents the first attempt to quantify the impact of future wildfires on the air we breathe.
"Warmer temperatures can dry out underbrush, leading to a more serious conflagration once a fire is started by lightning or human activity," says Logan. "Because smoke and other particles from fires adversely affect air quality, an increase in wildfires could have large impacts on human health."
Using a series of models, the scientists predict that the geographic area typically burned by wildfires in the western United States could increase by about 50% by the 2050s due mainly to rising temperatures. The greatest increases in area burned (75-175%) would occur in the forests of the Pacific Northwest and the Rocky Mountains.
In addition, because of extra burning throughout the western U.S., one important type of smoke particle, organic carbon aerosols, would increase, on average, by about 40 percent during the roughly half-century period.
Interesting7: Large trees have declined in Yosemite National Park during the 20th century, and warmer climate conditions may play a role. The number of large-diameter trees in the park declined 24 percent between the 1930s and 1990s.
U.S. Geological Survey and University of Washington scientists compared the earliest records of large-diameter trees densities from 1932–1936 to the most recent records from 1988–1999.
A decline in large trees means habitat loss and possible reduction in species such as spotted owls, mosses, orchids and fishers (a carnivore related to weasels). Fewer new trees will grow in the landscape because large trees are a seed source for the surrounding landscape.
Large-diameter trees generally resist fire more than small-diameter trees, so fewer large trees could also slow forest regeneration after fires. “Although this study did not investigate the causes of decline, climate change is a likely contributor to these events and should be taken into consideration,” said USGS scientist emeritus Jan van Wagtendonk.
“Warmer conditions increase the length of the summer dry season and decrease the snowpack that provides much of the water for the growing season. A longer summer dry season can also reduce tree growth and vigor, and can reduce trees’ ability to resist insects and pathogens.”
Posted by Glenn
No Comments
July 28-29, 2009
Air Temperatures – The following maximum temperatures were recorded across the state of Hawaii Tuesday afternoon:
Lihue, Kauai – 83
Honolulu, Oahu – 88
Kaneohe, Oahu – 83
Kahului, Maui – 86
Hilo, Hawaii – 85
Kailua-kona – 86
Air Temperatures ranged between these warmest and coolest spots near sea level – and on the highest mountains…at 4 p.m. Tuesday afternoon:
Poipu, Kauai – 86F
Lihue, Kauai – 77
Haleakala Crater – 55 (near 10,000 feet on Maui)
Mauna Kea summit – 41 (near 14,000 feet on the Big Island)
Precipitation Totals – The following numbers represent the largest precipitation totals (inches) during the last 24 hours on each of the major islands, as of Tuesday afternoon:
0.63 Mount Waialaele, Kauai
0.97 Manoa Valley, Oahu
0.11 Molokai
0.01 Lanai
0.00 Kahoolawe
1.13 West Wailuaiki, Maui
0.45 Kamuela upper, Big Island
Marine Winds – Here’s the latest (automatically updated) weather map showing a 1030 millibar high pressure system far to the northeast of the islands Wednesday. This high pressure cell, along with its associated ridge to our north, will keep the trade winds blowing through Thursday.
Satellite and Radar Images: To view the cloud conditions we have here in Hawaii, please use the following satellite links, starting off with this Infrared Satellite Image of the islands to see all the clouds around the state during the day and night. This next image is one that gives close images of the islands only during the daytime hours, and is referred to as a Close-up visible image. This next image shows a larger view of the Pacific…giving perspective to the wider ranging cloud patterns in the Pacific Ocean. Finally, here’s a Looping IR satellite image, making viewable the clouds around the islands 24 hours a day. To help you keep track of where any showers may be around the islands, here’s the latest animated radar image.
Hawaii’s Mountains – Here’s a link to the live webcam on the summit of near 14,000 foot Mauna Kea on the Big Island of Hawaii. The tallest peak on the island of Maui is the Haleakala Crater, which is near 10,000 feet in elevation. These two webcams are available during the daylight hours here in the islands…and when there’s a big moon rising just after sunset for an hour or two! Plus, during the nights and early mornings you will be able to see stars, and the sunrise too…depending upon weather conditions.
Tropical Cyclone activity in the eastern and central Pacific – Here’s the latest weather information coming out of the National Hurricane Center, covering the eastern north Pacific. You can find the latest tropical cyclone information for the central north Pacific (where Hawaii is located) by clicking on this link to the Central Pacific Hurricane Center. Here’s a tracking map covering both the eastern and central Pacific Ocean. A satellite image, which shows the entire ocean area between Hawaii and the Mexican coast…can be found here.
Aloha Paragraphs

Beautiful waterfall…on Maui
There will bee some slight day to day variations in wind speeds, but they will continue to blow through the next week…generally in the moderately strong realms. We find small craft wind advisory flags still up in those windiest areas around Maui and the Big Island Tuesday evening. A 1031 millibar high pressure system, far to our northeast, as shown on this weather map…is the source of our gusty breezes. There are really no indications that our trade winds will slow down significantly anytime soon.
The windward sides will see an increase in showers over the next day or two…with the leeward sides finding a possible shower here and there. The high cirrus clouds remain to the south of the islands Tuesday evening. This satellite image shows them in their arc southwest to southeast. An upper level trough of low pressure will be in our area over the next several days. This low will enhance our windward showers. This low may also prompt some afternoon showers to develop along the leeward slopes of the Big Island and Maui…there could even be a thunderstorm on the Big Island slopes Wednesday and Thursday afternoons.
It’s Tuesday evening here in Kihei, Maui, as I begin writing this last part of this evening’s narrative. The showers increased some during the afternoon hours along our windward sides. According to this looping radar image, the majority of the incoming showers are falling from Kauai down to Oahu at the time of this writing. As the sun sets and we move into the night hours, the showers should increase some elsewhere, as they usually do. Meanwhile, as the upper level low, written about above, arrives over the islands Wednesday into Thursday, there are apt to be somewhat more of an increase in showers. Since the trade winds will continue blowing, the majority of the showers will land on the windward coasts and slopes. The daytime heating however, could also trigger a few heavy showers over the leeward slopes during the afternoons on the Big Island and east Maui…perhaps a thunderstorm on the upper Big Island Kona slopes?
~~~ I’m about ready to leave Kihei, for the drive back upcountry to Kula. I can see that there are clouds hanging pretty low up that way, which is fine with me. One of my favorite things is to leave the relatively hot Kihei coast, and drive up into a thick cloud of fog at home. It’s so refreshing to get out of my work clothes, and into my walking stuff…and to get out into the moist fog! I’m not sure if I’ll have that pleasure today, but I love that when it happens. At any rate, I’ll catch up with you again early Wednesday morning, I hope you have a great Tuesday night from wherever you happen to be reading from! Aloha for now…Glenn.
Interesting: The U.N.’s climate panel has been backed over a key question as to how far global warming will drive up sea levels this century, a new study says. The UN experts are right that the oceans are unlikely to rise by an order of meters (many feet) by 2100, as some scientists have feared, it says.
But, its authors caution, low-lying countries and delta areas could still face potentially catastrophic flooding if the upper range of the new estimate proves right. In a landmark report in 2007, the U.N.’s Intergovernmental Panel on Climate Change (IPCC) predicted oceans would rise by 7.2 and 23.6 inches by 2100.
The increase would depend on warming, estimated at between 1.98-11.52 degrees Fahrenheit this century, which in turn depends on how much man-made greenhouse gas is poured into the atmosphere. It based the calculation on thermal expansion of the seas — when a liquid is warmed, it grows in volume.
Harder to calculate, the IPCC admitted, was how far melt water from glaciers and ice sheets on land would boost sea levels. It ventured a provisional calculation, suggesting contributions from those sources could push the upper limit to 76 cms (30.4 inches).
The new paper, led by Mark Siddall of Britain’s University of Bristol, used data from fossilized coral and from ice-core measurements to reconstruct sea-level fluctuations over the past 22,000 years, from the height of the last Ice Age to the balmy era of today.
This century, they calculate, the seas will rise by between seven and 82 cms, all sources included, on the basis of a 1.98-11.52 F warming — an estimated increase that is in the same ballpark as the IPCC’s.
Interesting2: Chicken feathers may help cars use hydrogen fuel in the future. The feathers would not be the fuel, but they could help store it, new research reveals. Hydrogen, the most common element in the universe, has long been touted as a clean and ample energy alternative to fossil fuels.
When hydrogen reacts with oxygen, instead of yielding pollutants as fossil fuels do, it simply generates water. Unfortunately, hydrogen is hard to store and transport. Hydrogen vehicles currently keep it in tanks in either liquid or pressurized gas form.
As a pressurized gas, it takes up roughly 40 times as much space as gasoline, and as a liquid it needs to be kept at extremely low temperatures. "Using currently available technology, if you had a 20-gallon tank and filled it with hydrogen at typical room temperature and pressure, you could drive about a mile," said researcher Richard Wool, director of the Affordable Composites from Renewable Resources program at the University of Delaware in Newark.
Interesting3: Nissan showed off its latest EV prototype today, a slick four-door, five-passenger hatchback that’s good for 100 miles and tells you when and where to charge up. Although it’s just a mule wearing a Tiida body, the car provides the best glimpse yet of the production EV we’ll see for the first time Sunday.
Nissan plans to offer an all-electric vehicle in Japan and the United States next year, then roll it out globally in 2012. "Nissan will be a leader in zero-emission vehicles," Toshiyuki Shiga said in Tokyo, according to Canadian Press. "EV is the answer."
Although most of the major automakers have promised to put EVs on the road within the next few years, Japan’s No. 3 automaker is placing the biggest bet on the technology. CEO Carlos Ghosn has made it clear he believes cars with cords are the future, and he has made developing such vehicles a top priority both within Nissan and Renault, its parent company.
The company reportedly plans to build 100,000 EVs within the next two years. The Department of Energy recently loaned Nissan $1.6 billion to retool its factory in Smyrna, Tennessee, to produce electric cars and the batteries to power them.
Range anxiety — the fear of being stranded by a dead battery — remains one impediment to the mass adoption of electric cars, and Nissan hopes to alleviate such worries with a car that tells you when and where to charge up. Nissan calls it "EV-IT" and says it will work with the car’s navigation system to:
* Show the driving radius within range under the current state of charge.
* Calculate whether the vehicle is within range of a pre-set destination like your home or office.
* Provide information about available charging stations within the current driving range and provide info about those stations.
Interesting4: Recent news reports about scuba divers off San Diego being menaced by large numbers of Humboldt’s or jumbo squid have raised the ire of University of Rhode Island biologist Brad Seibel. As a leading expert on the species who has dived with them several times, he calls the reports "alarmist" and says the squid’s man-eating reputation is seriously overblown.
For years Seibel has heard stories claiming that Humboldt squid will devour a dog in minutes and could kill or maim unsuspecting divers. "Private dive companies in Mexico play up this myth by insisting that their customers wear body armor or dive in cages while diving in waters where the squid are found.
Many also encourage the squid’s aggressive behavior by chumming the waters. I didn’t believe the hype, but there was still some doubt in my mind, so I was a little nervous getting into the water with them for the first time," Seibel said.
Scuba diving at night in the surface waters of the Gulf of California in 2007, Seibel scanned the depths with his flashlight and saw the shadows of Humboldt squid far in the distance. After he got up his nerve, he turned off the light.
When he turned it back on again 30 seconds later, he was surrounded by what seemed like hundreds of the squid, many just five or six feet away from him. Most were in the 3-4 foot size range, while larger ones were sometimes visible in deeper waters.
But the light appeared to frighten them, and they immediately dashed off to the periphery. The URI researcher’s dive was more than just a personal test. It was part of a scientific examination of the species some call "red devil" to learn more about their physiology, feeding behavior and swimming abilities.
Humboldt squid feed in surface waters at night, then retreat to great depths during daylight hours. "They spend the day 300 meters deep where oxygen levels are very low," Seibel said. "We wanted to know how they deal with so little oxygen."
Seibel said that while the squid are strong swimmers with a parrot-like beak that could inflict injury, man-eaters they are not. Unlike some large sharks that feed on large fish and marine mammals, jumbo squid use their numerous small, toothed suckers on their arms and tentacles to feed on small fish and plankton that are no more than a few centimeters in length.
The highlight of Seibel’s research cruise with colleagues from the Monterey Bay Aquarium Research Institute was diving with the impressive animals. Other divers participating were Lloyd Trueblood of URI, Steve Haddock of MBARI, and Alison Sweeney of the University of California, Santa Barbara.
Seibel was surprised by the large number of squid he encountered, which made it easy to imagine how they could be potentially dangerous to anything swimming with them. Their large numbers also made Seibel somewhat pleased that they appeared frightened of his dive light.
Yet he said the animals were also curious about other lights, like reflections off his metal equipment or a glow-in-the-dark tool that one squid briefly attacked. "Based on the stories I had heard, I was expecting them to be very aggressive, so I was surprised at how timid they were. As soon as we turned on the lights, they were gone," he said.
"I didn’t get the sense that they saw the entire diver as a food item, but they were definitely going after pieces of our equipment." According to Seibel, there have been many active discussions among biologists and the dive community about the safety of diving with Humboldt squid.
As a result of his experience, the URI scientist is preparing a formal report with his recommendations for safely diving with the squid, including suggestions to always carry a back-up dive light and to be tethered to a boat.
Any time humans enter the habitat of a large animal, there is potential for dangerous interactions, he said, so divers should use caution. "However, I want to spread the word that they aren’t the aggressive man-eaters as they have been portrayed," Seibel said.
Interesting5: New research suggests that current regulations have failed to remove misleading information from cigarette packaging, revealing that a substantial majority of consumers believe cigarettes are less hazardous when the packs display words such as "silver" or "smooth," lower numbers incorporated into the brand name, lighter colors or pictures of filters. In a study of 603 adults published July 28 in the online edition of the Journal of Public Health, Canadian researchers call for the list of words banned from cigarette packaging to be expanded beyond the current prohibition of "light," "mild" and "low-tar" and suggest that other pack design elements may need to be eliminated to prevent consumers erroneously believing that one brand is less harmful than another.
"Research has already shown that using words such as ‘light,’ ‘mild’ and ‘low tar’ on cigarette packaging misleads consumers into thinking that one brand carries a lower health risk than another and that’s why those words have been outlawed in more than 50 countries, but there has been virtually no independent research on these other packaging tactics to support broader regulation," said the study’s leader, David Hammond, a professor of health studies at the University of Waterloo in Ontario, Canada.
"Our study found that commonly-used words not covered by the bans, as well as other packaging design elements such as color, the use of numbers and references to filters, were just as misleading, which means there’s a loophole that needs to be closed. "Tobacco use is the leading cause of preventable death worldwide.
The World Health Organization estimates that it kills more than 5 million people a year. Smoking is linked to an increasing number of diseases, including heart disease and stroke, respiratory diseases and 10 different forms of cancer. Globally, use of tobacco products is increasing. Smokers who perceive greater risks are more likely to try to quit and to remain abstinent.
Interesting6: Evidence for life on Earth stretches back billions of years, with simple single-celled organisms like bacteria dominating the record. When multi-celled animal life appeared on the planet after 3 billion years of single cell organisms, animals diversified rapidly.
Conventional wisdom has it that animal evolution began in the ocean, with animal life adapting much later in Earth history to terrestrial environments. Now a UC Riverside-led team of researchers studying ancient rock samples in South China has found that the first animal fossils in the paleontological record are preserved in ancient lake deposits, not marine sediments as commonly assumed.
"We know that life in the oceans is very different from life in lakes, and, at least in the modern world, the oceans are far more stable and consistent environments compared to lakes which tend to be short-lived features relative to, say, rates of evolution," said Martin Kennedy, a professor of geology in the Department of Earth Sciences who participated in the research.
"Thus it is surprising that the first evidence of animals we find is associated with lakes, a far more variable environment than the ocean." The study, published in the July 27-31 online edition of the Proceedings of the National Academy of Sciences, raises questions such as what aspects of the Earth’s environment changed to enable animal evolution.
Posted by Glenn
No Comments
July 27-28, 2009
Air Temperatures – The following maximum temperatures were recorded across the state of Hawaii Monday afternoon:
Lihue, Kauai – 83
Honolulu, Oahu – 90
Kaneohe, Oahu – 84
Kahului, Maui – 87
Hilo, Hawaii – 83
Kailua-kona – 89
Air Temperatures ranged between these warmest and coolest spots near sea level – and on the highest mountains…at 4 p.m. Monday afternoon:
Barking Sands, Kauai – 87F
Lihue, Kauai – 81
Haleakala Crater – 57 (near 10,000 feet on Maui)
Mauna Kea summit – 59 (near 14,000 feet on the Big Island)
Precipitation Totals – The following numbers represent the largest precipitation totals (inches) during the last 24 hours on each of the major islands, as of Monday afternoon:
0.43 Mount Waialaele, Kauai
0.42 Oahu Forest NWR, Oahu
0.00 Molokai
0.00 Lanai
0.00 Kahoolawe
0.36 Oheo Gulch, Maui
0.38 Kamuela upper, Big Island
Marine Winds – Here’s the latest (automatically updated) weather map showing a 1032 millibar high pressure system far to the northeast of the islands Tuesday. This high pressure cell, along with its associated ridge to our north, will keep the trade winds blowing through Wednesday.
Satellite and Radar Images: To view the cloud conditions we have here in Hawaii, please use the following satellite links, starting off with this Infrared Satellite Image of the islands to see all the clouds around the state during the day and night. This next image is one that gives close images of the islands only during the daytime hours, and is referred to as a Close-up visible image. This next image shows a larger view of the Pacific…giving perspective to the wider ranging cloud patterns in the Pacific Ocean. Finally, here’s a Looping IR satellite image, making viewable the clouds around the islands 24 hours a day. To help you keep track of where any showers may be around the islands, here’s the latest animated radar image.
Hawaii’s Mountains – Here’s a link to the live webcam on the summit of near 14,000 foot Mauna Kea on the Big Island of Hawaii. The tallest peak on the island of Maui is the Haleakala Crater, which is near 10,000 feet in elevation. These two webcams are available during the daylight hours here in the islands…and when there’s a big moon rising just after sunset for an hour or two! Plus, during the nights and early mornings you will be able to see stars, and the sunrise too…depending upon weather conditions.
Tropical Cyclone activity in the eastern and central Pacific – Here’s the latest weather information coming out of the National Hurricane Center, covering the eastern north Pacific. You can find the latest tropical cyclone information for the central north Pacific (where Hawaii is located) by clicking on this link to the Central Pacific Hurricane Center. Here’s a tracking map covering both the eastern and central Pacific Ocean. A satellite image, which shows the entire ocean area between Hawaii and the Mexican coast…can be found here.
Aloha Paragraphs

Rainbow wave
Our normal trade winds will stick with us through this entire week…and likely right on into next week. We find small craft wind advisory flags still up in those windiest areas around Maui and the Big Island Monday evening. A strong 1034 millibar high pressure system, far to our northeast, as shown on this weather map…as the source of our gusty breezes. There will be some fluctuations in our wind speeds, but in general, they will remain moderately strong well into the future.
Showers will focus their efforts most effectively along the windward sides…falling most often during the night and early morning hours. The high cirrus clouds, and some middle level altocumulus clouds, have mostly moved to the south of the islands Monday evening. There will be lower level clouds, dropping a few showers along our windward sides. An upper level trough of low pressure will be to the north of the islands over the next several days. This low will likely enhance our windward showers. This low may also prompt some afternoon showers to develop along the leeward slopes of the Big Island and Maui too.
It’s Monday evening here in Kihei, Maui, as I begin writing this last part of this evening’s narrative. Our weather here in the islands pretty much stuck to the forecast script. This meant that the trade winds blew briskly, and daytime temperatures rose well into the 80F’s near sea level…and topped out at 90 degrees at the Honolulu airport. As noted on this satellite image, the sun dimming cirrus clouds edged south of the state, which was good news for our local sun worshippers. The trade winds were still on the stiff side at 5pm Monday evening, with the strongest gust, registering 40 mph, being recorded at Maalaea Bay…slightly down from the 42 mph gust earlier in the day.
~~~ If we look at this looping satellite image, we can see the counterclockwise rotating upper level low to our north. This low aloft is what’s expected to enhance our showers along the windward sides…starting later tonight. I would imagine that the windward sides, which have been quite dry lately, will finally get an increase in showers. Looking out the window before I leave for the drive upcountry to Kula, I see no obvious signs of those showers over towards Makawao, Paia and Haiku just yet.
~~~ I’ll be back with your next new weather narrative early Tuesday morning. I hope you have a great Monday night until then! Aloha for now…Glenn
Interesting: Icy comets – not rocky asteroids – launched a dramatic assault on the Earth and moon around 3.85 billion years ago, a new study of ancient rocks in Greenland suggests. The work suggests much of Earth’s water could have been brought to the planet by comets. "We can see craters on the moon’s surface with the naked eye, but nobody actually knew what caused them – was it rocks, was it iron, was it ice?" says Uffe Gråe Jørgensen, an astronomer at the Niels Bohr Institute in Copenhagen, Denmark.
"It’s exciting to find signs that it was actually ice." Evidence suggests that the Earth and moon had both formed around 4.5 billion years ago. But almost all the craters on the moon date to a later period, the "Late Heavy Bombardment" 3.8 to 3.9 billion years ago, when around 100 million billion tons of rock or ice crashed onto the lunar surface.
The Earth would have been pummeled by debris at the same time, although plate tectonics on our restless planet have since erased the scars. To find out whether asteroids or comets were the main culprits for the bombardment, Jørgensen decided to measure levels of the element iridium in ancient terrestrial rocks. Iridium is rare on the Earth’s surface because almost all of it bound to iron and sank into the Earth’s core soon after the planet had formed.
But iridium is relatively common in comets and meteorites. His team calculated the amount of iridium that asteroids would leave on the Earth and moon compared to comets. Because comets have more volatile elements and higher impact speeds due to their more elongated orbits around the sun, they would create giant plumes on impact, allowing more iridium to escape into space than during asteroid impacts.
The team predicted that asteroid bombardment would leave iridium levels of 18,000 and 10,000 parts per trillion in rocks on the Earth and moon respectively, while the same figures for comet bombardment would be about 130 and 10. Ancient moon rocks returned by NASA’s Apollo missions have already confirmed that the lunar iridium levels are 10 parts per trillion or less.
To find out the terrestrial value, Jørgensen’s team sampled some of the world’s oldest rocks from Greenland, aged 3.8 billion years, and asked a Japanese laboratory to assess their iridium levels more accurately than ever before. They contained iridium levels of 150 parts per trillion. That strongly suggests comets, rather than asteroids, caused the violent bombardment.
Interesting2: Pulse Technology has developed a new type of car battery charger that it claims can increase the life of a lead-acid battery by three to five times, the equivalent of eight to 10 years of extra life. The Xtreme Charger’s goal is to reduce lead sulfate deposits that build up on the battery plates.
This build up occurs naturally no matter how often the vehicle is used but is increased in extreme hot and cold weather or extended periods of engine idling. While car batteries are able to recharge while you’re driving, conditions such as sulfate build-up eventually prevent them from holding a charge.
Interesting3: The oil and gas that fuels our homes and cars started out as living organisms that died, were compressed, and heated under heavy layers of sediments in the Earth’s crust. Scientists have debated for years whether some of these hydrocarbons could also have been created deeper in the Earth and formed without organic matter.
Now for the first time, scientists have found that ethane and heavier hydrocarbons can be synthesized under the pressure-temperature conditions of the upper mantle —the layer of Earth under the crust and on top of the core.
The research was conducted by scientists at the Carnegie Institution’s Geophysical Laboratory, with colleagues from Russia and Sweden, and is published in the July 26, advanced on-line issue of Nature Geoscience.
Methane (CH4) is the main constituent of natural gas, while ethane (C2H6) is used as a petrochemical feedstock. Both of these hydrocarbons, and others associated with fuel, are called saturated hydrocarbons because they have simple, single bonds and are saturated with hydrogen.
Using a diamond anvil cell and a laser heat source, the scientists first subjected methane to pressures exceeding 20 thousand times the atmospheric pressure at sea level and temperatures ranging from 1,300 F° to over 2,240 F°. These conditions mimic those found 40 to 95 miles deep inside the Earth.
The methane reacted and formed ethane, propane, butane, molecular hydrogen, and graphite. The scientists then subjected ethane to the same conditions and it produced methane. The transformations suggest heavier hydrocarbons could exist deep down. The reversibility implies that the synthesis of saturated hydrocarbons is thermodynamically controlled and does not require organic matter.
Interesting4: Bangladeshi farmers are benefiting from research that allows farmers to harvest rice earlier, giving them more time to grow a second crop to provide desperately needed food and ease hunger during monga – the hunger months. Monga is a yearly famine that occurs in northwest Bangladesh from September to November after the previous season’s food has run out and before the harvest of transplanted rice in December.
According to the Bangladesh Bureau of Statistics, monga affects more than 2 million households in 5 districts that depend on rice for their food. Through the Irrigated Rice Research Consortium (IRRC), the International Rice Research Institute (IRRI), the Bangladesh Rice Research Institute (BRRI), and the local alliance Northwest Area Focal Forum are encouraging practices to reduce the time it takes to grow a rice crop.
“Adopting direct seeding so rice can be sown earlier and planting a shorter-duration rice variety can bring the harvest forward 25–40 days,” said Dr. David Johnson, IRRI scientist and IRRC work group leader.
“This can significantly improve the quality of people’s lives and reduce monga by creating early harvest jobs for the landless poor, delivering an early food supply, increasing the chances that a second crop can be grown, spreading the demand for harvest labor, and creating jobs for the landless and income for farmers,” he added.
New management techniques, and particularly weed management, must be simultaneously adopted with these new practices. According to Dr. M.A. Mazid, head of the BRRI Rangpur station, direct-seeded rice can reduce crop establishment costs and may slightly increase rice yields.
“With a better chance to grow a second crop after rice, such as maize, potato, mustard, wheat, chickpea, or vegetables, farmers will have more food and an opportunity to make some income,” he said. The Bangladeshi government is now also promoting the adoption of the shorter-duration rice variety and direct seeding as part of a national program and three-year action plan to mitigate monga.
Interesting5: Oxford scientists have created a transparent form of aluminium by bombarding the metal with the world’s most powerful soft X-ray laser. ‘Transparent aluminium’ previously only existed in science fiction, featuring in the movie Star Trek IV, but the real material is an exotic new state of matter with implications for planetary science and nuclear fusion.
In the journal Nature Physics an international team, led by Oxford University scientists, report that a short pulse from the FLASH laser ‘knocked out’ a core electron from every aluminium atom in a sample without disrupting the metal’s crystalline structure.
This turned the aluminium nearly invisible to extreme ultraviolet radiation. ”What we have created is a completely new state of matter nobody has seen before,’ said Professor Justin Wark of Oxford University’s Department of Physics, one of the authors of the paper.
‘Transparent aluminium is just the start. The physical properties of the matter we are creating are relevant to the conditions inside large planets, and we also hope that by studying it we can gain a greater understanding of what is going on during the creation of ‘miniature stars’ created by high-power laser implosions, which may one day allow the power of nuclear fusion to be harnessed here on Earth.’
Interesting6: Scientists from NOAA’s Coral Reef Watch Program say conditions are favorable for significant coral bleaching and infectious coral disease outbreaks in the Caribbean, especially in the Lesser Antilles. The forecast is based on the July NOAA Coral Reef Watch outlook, which expects continued high water temperatures through October 2009.
Scientists are concerned that bleaching may reach the same levels or exceed those recorded in 2005, the worst coral bleaching and disease year in Caribbean history. In parts of the eastern Caribbean, as much as 90 percent of corals bleached and over half of those died during that event."
“Just like any climate forecast, local conditions and weather events can influence actual temperatures. However, we are quite concerned that high temperatures may threaten the health of coral reefs in the Caribbean this year,” said C. Mark Eakin, Ph.D., coordinator of NOAA’s Coral Reef Watch.
Prolonged coral bleaching of more than a week can lead to coral death and the subsequent loss of coral reef habitats for a range of marine life. It also affects local economies and tourism. “By providing local officials with advance warning that a bleaching event is about to occur, some steps can be taken to protect the corals,” said Eakin.
“Possible responses include mobilizing monitoring resources to measure extent and impact of bleaching, and establishing temporary restrictions on other reef uses like diving, boating and recreational fishing, to keep these activities from adding to the stress of higher sea temperatures already affecting the coral reefs.”
There is also potential for similar conditions in the central Gulf of Mexico and a region stretching from the Lesser Antilles to Puerto Rico, across to the southern coast of Hispaniola and the Caribbean coast of Nicaragua. Other areas of concern are the central Pacific region including the equatorial Line Islands and Kiribati. Some heat induced stress may also develop between the Northern Mariana Islands and Japan.
Posted by Glenn
[2] Comments
July 26-27, 2009
Air Temperatures – The following maximum temperatures were recorded across the state of Hawaii Sunday afternoon:
Lihue, Kauai – 84
Honolulu, Oahu – 89
Kaneohe, Oahu – 84
Kahului, Maui – 88
Hilo, Hawaii – 84
Kailua-kona – 86
Air Temperatures ranged between these warmest and coolest spots near sea level – and on the highest mountains…at 6 p.m. Sunday evening:
Barking Sands, Kauai – 85F
Kaneohe, Oahu – 79
Haleakala Crater – 54 (near 10,000 feet on Maui)
Mauna Kea summit – 57 (near 14,000 feet on the Big Island)
Precipitation Totals – The following numbers represent the largest precipitation totals (inches) during the last 24 hours on each of the major islands, as of Sunday afternoon:
0.08 Mount Waialaele, Kauai
0.04 Kahuku, Oahu
0.00 Molokai
0.00 Lanai
0.00 Kahoolawe
0.02 Hana airport, Maui
0.10 Kamuela, Big Island
Marine Winds – Here’s the latest (automatically updated) weather map showing a stronger 1033 millibar high pressure system far to the northeast of the islands Monday. This high pressure cell, along with its associated ridge to our north, will keep the trade winds blowing through Tuesday.
Satellite and Radar Images: To view the cloud conditions we have here in Hawaii, please use the following satellite links, starting off with this Infrared Satellite Image of the islands to see all the clouds around the state during the day and night. This next image is one that gives close images of the islands only during the daytime hours, and is referred to as a Close-up visible image. This next image shows a larger view of the Pacific…giving perspective to the wider ranging cloud patterns in the Pacific Ocean. Finally, here’s a Looping IR satellite image, making viewable the clouds around the islands 24 hours a day. To help you keep track of where any showers may be around the islands, here’s the latest animated radar image.
Hawaii’s Mountains – Here’s a link to the live webcam on the summit of near 14,000 foot Mauna Kea on the Big Island of Hawaii. The tallest peak on the island of Maui is the Haleakala Crater, which is near 10,000 feet in elevation. These two webcams are available during the daylight hours here in the islands…and when there’s a big moon rising just after sunset for an hour or two! Plus, during the nights and early mornings you will be able to see stars, and the sunrise too…depending upon weather conditions.
Tropical Cyclone activity in the eastern and central Pacific – Here’s the latest weather information coming out of the National Hurricane Center, covering the eastern north Pacific. You can find the latest tropical cyclone information for the central north Pacific (where Hawaii is located) by clicking on this link to the Central Pacific Hurricane Center. Here’s a tracking map covering both the eastern and central Pacific Ocean. A satellite image, which shows the entire ocean area between Hawaii and the Mexican coast…can be found here.
Aloha Paragraphs

Nice sunset and sunrise colors now
A fairly normal summertime trade wind weather pattern is gracing the Hawaiian Islands on this last day of the weekend. Looking into the new week ahead, these trade winds will remain active, with small craft wind advisory flags having been raised in those windiest areas around Maui and the Big Island. A stronger 1033 millibar high pressure system, far to our northeast, as shown on this weather map…is the source of our refreshing breezes.
Other than the locally gusty trade winds, and a few windward showers…our weather will be just fine. Meanwhile, we continue to see streaks of high cirrus clouds, and some middle level altocumulus clouds, streaming overhead Sunday evening. There will be a few lower level clouds, dropping a few showers along our windward sides. An upper level trough of low pressure will be to the north of the islands over the next several days…which may enhance our windward showers at times.
It’s Sunday evening here in Kula, Maui, as I begin writing this last part of this morning’s narrative. Sunday was another nice day here in the Aloha state, with lots of sunshine, filtering through the high cirrus clouds. The trade winds are blowing steadily as we end the week, and will remain active well into the new week ahead. By the way, those high and middle level clouds will likely continue to light up beautifully at both sunset and sunrise into Monday…keep an eye out for them. I’ll be out on my weather deck in a little while, looking for those wonderful orange and red colors myself. ~~~ I’ll be back with you next early Monday morning, preparing the next new weather narrative. I hope you have a great Sunday night until then.
Interesting: You drive to the office, sit at a computer all day, drive home and then park yourself on the couch. If that’s your life, leading obesity experts say, the government should be changing your environment and making it possible for you to become more active.
There has been a big reduction in "muscle-power transportation," such as walking or biking to work or to the store, says Russell Pate, an exercise researcher at the University of South Carolina-Columbia.
This is partly because of sprawling communities and long commutes, but he says it’s also because people don’t have safe places to walk.
"If we have safe routes, sidewalks, bike trails that go to destinations that people need to get to, then those trails will be more heavily used," Pate says.
The government’s responsibility to get Americans moving will be discussed at the three-day Weight of the Nation conference next week. Public health advocates, government leaders and obesity researchers will meet in Washington, D.C.
Intersting2: Global health officials stepped up efforts to prepare for quick vaccination against the H1N1 pandemic virus, saying on Friday it appeared now to be affecting older age groups spared earlier in the pandemic. The World Health Organization and the U.S. Centers for Disease Control and Prevention both said they can only estimate how many people have been infected but the swine flu virus was still spreading quickly.
"As the disease expands broadly into communities, the average age of the cases is appearing to increase slightly," the WHO said in a statement. "This may reflect the situation in many countries where the earliest cases often occurred as school outbreaks but later cases were occurring in the community."
The virus has been notable for affecting older children and young adults, groups normally not hard-hit by influenza. The CDC said summer camps and military facilities were affected, but both agencies said there was no evidence the virus was mutating into drug-resistant or more virulent forms.
The CDC broadened its recommendations for seasonal flu vaccine — saying all children over the age of 6 months should get one, in part to lower the overall burden of respiratory disease when autumn and winter come.
WHO said vaccination against H1N1 might start in weeks, even though clinical trials to test the safety, efficacy and needed dosage of H1N1 vaccines have barely started. "Manufacturers are expected to have vaccines for use around September.
A number of companies are working on the pandemic vaccine production and have different timelines," WHO said. At least 50 governments have placed orders or are currently negotiating with pharmaceutical companies to secure supplies of H1N1 vaccines, which are still being developed.
WHO is trying to ensure that health workers in poor countries can be vaccinated so hospitals can stay open if the flu becomes more debilitating as it spreads. Sanofi-Aventis and GlaxoSmithKline have promised to donate 150 million doses to this aim to date.
Interesting3: A habitually shod lifestyle has consequences for the biologically normal anatomy and function of the foot. Kristiaan D’Aout and Peter Aerts from the Biology Department at the University of Antwerp collaborated for their work on the biomechanics of barefoot walking with Dirk De Clercq (University of Gent, Belgium) and with Todd Pataky (University of Liverpool, UK).
This team made the first detailed analysis of foot function in people who have never worn shoes. For this project, they travelled to South India, where many people walk barefoot throughout life, mostly for spiritual or financial reasons.
In this way, the researchers wanted to gain an insight into the biologically normal function of the foot, which evolved for millions of years – unshod.
The research was funded by the Fund for Scientific Research – Flanders, and was based on dynamic measurements of pressure distribution under to foot sole during walking.
It showed that the foot of habitual barefoot walkers differs, both in shape and in function, from that of habitually shod peers.
Barefooters have a relatively wide forefoot and manage at better distributing pressures over the entire surface of the foot sole, resulting in lower (and most likely favorable) peak pressures.
As such, the fundamental scientific results are also important for clinicians and for the design of quality footwear, which should not hamper the foot’s biologically normal function.
Interesting4: How clouds over the ocean affect our climate, and how climate change may be affecting them, is not well known. There is no network of observing stations like on land, and climate models have not been shown to really simulate clouds well.
They may be just too fine a detail for models that cover such large scale phenomenon as oceanic circulation. But clouds over the oceans have been thought be important in our understanding of what drives our climate.
In a study published in the July 24 issue of Science, researchers Amy Clement and Robert Burgman from the University of Miami’s Rosenstiel School of Marine and Atmospheric Science and Joel Norris from Scripps Institution of Oceanography at UC San Diego begin to unravel this mystery.
Using observational data collected over the last 50 years and complex climate models, the team has established that low-level stratiform clouds appear to dissipate as the ocean warms, indicating that changes in these clouds may enhance the warming of the planet.
The result of their analysis was a surprising degree of agreement between two multi-decade datasets that were not only independent of each other, but that employed fundamentally different measurement methods.
One set consisted of collected visual observations from ships over the last 50 years, and the other was based on data collected from weather satellites.
"The agreement we found between the surface-based observations and the satellite data was almost shocking," said Clement, a professor of meteorology and physical oceanography at the University of Miami and winner of the American Geophysical Union’s 2007 Macelwane Award for her groundbreaking work on climate change.
"These are subtle changes that take place over decades. It is extremely encouraging that a satellite passing miles above the earth would document the same thing as sailors looking up at a cloudy sky from the deck of a ship."
Together, the observations and the Hadley Centre model results provide evidence that low-level stratiform clouds, which currently shield the earth from the sun’s radiation, may dissipate in warming climates, allowing the oceans to further heat up, which would then cause more cloud dissipation.
"This is somewhat of a vicious cycle potentially exacerbating global warming," said Clement. "But these findings provide a new way of looking at cloud changes.
This can help to improve the simulation of clouds in climate models, which will lead to more accurate projections of future climate changes."
Interesting5: By the 1970s, people were spewing so much soot, ash, and other tiny particles into the lower atmosphere that climate researchers called the effect the "human volcano." Now it looks like humans are imitating volcanoes in yet another part of the atmosphere.
New research blames this decade’s thickening of the haze in the stratosphere on the burst of coal burning around the world. The chief offender appears to be China. Until now, scientists could see no sign that anything but volcanic eruptions packed enough punch to pollute the stratosphere.
Smokestacks also spew sulfur, creating acid rain and attacking people’s lungs, but no smokestack can send it up through the lower atmosphere and into the stratosphere where it turns into haze.
Or can it? In a paper in press in Geophysical Research Letters, atmospheric scientist David Hofmann of the University of Colorado, Boulder, and colleagues report a human role in stratospheric haze pollution.
Since 1994, National Oceanic and Atmospheric Administration scientists have used lidar to probe stratospheric haze in the skies above Mauna Loa in Hawaii and, since 2000, above Boulder.
Like weather radar, which uses microwaves to measure rain, upward-pointing lidar bounces electromagnetic waves off distant objects–microscopic haze particles in the case of haze.
Both the Mauna Loa and Boulder lidars show a long-term upward trend in stratospheric haze since about 2001 of 4% to 7% per year (blue line in figure), the group reports.
"This trend is quite large," says Hofmann. Volcanoes aren’t to blame, he says, as the most recent major volcanic activity–Mt. Pinatubo’s "eruption of the century" in 1991–occurred long enough ago that any sulfurous gases it blasted into the stratosphere to form haze are long since gone.
So Hofmann turned to humans. Sulfur emitted by coal-burning industries and power plants could spread through the lower atmosphere, he explains, and then less than 1% of it might have been caught in the strong updrafts of tropical storms–the equivalent of a volcano’s plume–that could loft it into the stratosphere.
The world’s 5.2% per year increase in sulfur emissions from 2002 to 2007–mainly from China–could readily account for the increase in stratospheric haze, the group calculates. However, experts in stratospheric circulation caution that there’s an alternative explanation for increasing haze.
Rather than the human-induced increase in pollutant sulfur in the lower atmosphere, the cause could be an acceleration of the updrafts that loft air and any sulfur in it into the stratosphere. The speedup could be natural or another effect of global warming.
Still, Hofmann notes that humans don’t hold a candle to volcanoes when it comes to stratospheric pollution. Even if, as expected, China dramatically increases its coal burning by 2022, the resulting doubling of stratospheric haze would be just 5% of another Pinatubo–resulting in a slight cooling of the stratosphere and a tiny amount of ozone damage. The corrosive effects of China’s coal burning in the lower atmosphere would be another matter.
Posted by Glenn
No Comments
July 25-26, 2009
Air Temperatures – The following maximum temperatures were recorded across the state of Hawaii Saturday afternoon:
Lihue, Kauai – 84
Honolulu, Oahu – 91
Kaneohe, Oahu – 84
Kahului, Maui – 88
Hilo, Hawaii – 85
Kailua-kona – 87
Air Temperatures ranged between these warmest and coolest spots near sea level – and on the highest mountains…at 5 p.m. Saturday evening:
Barking Sands, Kauai – 86F
Hilo, Hawaii – 80
Haleakala Crater – 55 (near 10,000 feet on Maui)
Mauna Kea summit – 66 (near 14,000 feet on the Big Island)
Precipitation Totals – The following numbers represent the largest precipitation totals (inches) during the last 24 hours on each of the major islands, as of Saturday afternoon:
0.16 Kapahi, Kauai
0.03 Oahu Forest NWR, Oahu
0.00 Molokai
0.00 Lanai
0.00 Kahoolawe
0.03 Kula, Maui
0.04 Kamuela, Big Island
Marine Winds – Here’s the latest (automatically updated) weather map showing a 1026 millibar high pressure system far to the northeast of the islands. As the trough of low pressure, now to the west of the state, continues moving away…we’ll find strengthening trade winds Sunday into Monday.
Satellite and Radar Images: To view the cloud conditions we have here in Hawaii, please use the following satellite links, starting off with this Infrared Satellite Image of the islands to see all the clouds around the state during the day and night. This next image is one that gives close images of the islands only during the daytime hours, and is referred to as a Close-up visible image. This next image shows a larger view of the Pacific…giving perspective to the wider ranging cloud patterns in the Pacific Ocean. Finally, here’s a Looping IR satellite image, making viewable the clouds around the islands 24 hours a day. To help you keep track of where any showers may be around the islands, here’s the latest animated radar image.
Hawaii’s Mountains – Here’s a link to the live webcam on the summit of near 14,000 foot Mauna Kea on the Big Island of Hawaii. The tallest peak on the island of Maui is the Haleakala Crater, which is near 10,000 feet in elevation. These two webcams are available during the daylight hours here in the islands…and when there’s a big moon rising just after sunset for an hour or two! Plus, during the nights and early mornings you will be able to see stars, and the sunrise too…depending upon weather conditions.
Tropical Cyclone activity in the eastern and central Pacific – Here’s the latest weather information coming out of the National Hurricane Center, covering the eastern north Pacific. You can find the latest tropical cyclone information for the central north Pacific (where Hawaii is located) by clicking on this link to the Central Pacific Hurricane Center. Here’s a tracking map covering both the eastern and central Pacific Ocean. A satellite image, which shows the entire ocean area between Hawaii and the Mexican coast…can be found here.
Aloha Paragraphs

Strengthening trade winds into Monday
Our trade winds will be on the rise Sunday…continuing on into the new week ahead. As these easterly trade winds fill back into our Hawaiian Islands weather picture, we’ll feel relief from the sultry weather of late. Looking a bit further ahead, these trade winds will become rather blustery, with small craft wind advisories already having gone up in those windiest areas around Maui and the Big Island Saturday evening.
As the recent trough of low pressure moves further away, we’re moving back into a typical trade wind weather pattern. As a stronger version of the trade winds return soon, the bias for showers will shift back over to the windward sides in turn. We need to keep an eye on another trough of low pressure moving into our area Monday and Tuesday…which could perhaps bring back the chance of localized heavy showers again then.
Besides the quickening trade wind flow, the other weather feature that we’ll notice is the high cirrus clouds...which should make for a colorful sunset Saturday evening. As this looping satellite image shows, we’re going to continue to find sunshine muting and filtering cirrus moving over us during the day Sunday. As the aforementioned trough moves further west, we will eventually see less of this high cirrus cloudiness…which is streaming off of thunderstorms to our southwest.
I went down to Kahului Friday evening to see the new Harry Potter film called Harry Potter and the Half-Blood Prince (2009). Folks were telling me that this was the best one of these Harry Potter films. The short synopsis of this film is: Harry Potter returns back to Hogwarts and faces his darkest threat yet. As has been the case with all these films, I enjoyed them. I’m not sure if it was just the mood that I was in, or what, but it felt a little long. I enjoy it quite a bit though, and it certainly was entertaining enough to keep my interest peaked throughout. Here’s a trailer for this film in case you have the desire to check it out.
It’s Saturday evening here in Kula, Maui, as I begin writing this last part of this morning’s narrative. I had a good day, after experiencing deeply sad moments the last couple of days, as a very close friend of mine died Friday morning. Her name was Dr. Julie Claire Holmes, who I’ve had a long and close relationship with for many years. I went down to the Buddhist temple in Paia during the afternoon, where a group of Zen meditators were having a three day sitting practice. I ended up talking with the Zen Master, who is a good friend of mine from the old days, when I lived in Honolulu back in the middle 1970’s. I then took a nice walk on Baldwin Beach, and took a great swim after that. The swim in that warm ocean seemed to help wash off a lot of the deep loss that I’m been living with for quite a while now…leading up to Julie’s death. I’m leaving soon for the Maui Community College, down in Kahului. I’ll be attending a story telling event, which sounds like another good opportunity to move away from the sad thoughts that have been overtaking me. ~~~ I’ll be back Sunday morning with your next new weather narrative from paradise. I’ll let you know what I thought of the story telling session this evening. I hope you have a great Saturday night from wherever you happen to be reading from! Aloha for now…Glenn.
Interesting: You drive to the office, sit at a computer all day, drive home and then park yourself on the couch. If that’s your life, leading obesity experts say, the government should be changing your environment and making it possible for you to become more active.
There has been a big reduction in "muscle-power transportation," such as walking or biking to work or to the store, says Russell Pate, an exercise researcher at the University of South Carolina-Columbia.
This is partly because of sprawling communities and long commutes, but he says it’s also because people don’t have safe places to walk.
"If we have safe routes, sidewalks, bike trails that go to destinations that people need to get to, then those trails will be more heavily used," Pate says.
The government’s responsibility to get Americans moving will be discussed at the three-day Weight of the Nation conference next week. Public health advocates, government leaders and obesity researchers will meet in Washington, D.C.
Intersting2: Global health officials stepped up efforts to prepare for quick vaccination against the H1N1 pandemic virus, saying on Friday it appeared now to be affecting older age groups spared earlier in the pandemic. The World Health Organization and the U.S. Centers for Disease Control and Prevention both said they can only estimate how many people have been infected but the swine flu virus was still spreading quickly.
"As the disease expands broadly into communities, the average age of the cases is appearing to increase slightly," the WHO said in a statement. "This may reflect the situation in many countries where the earliest cases often occurred as school outbreaks but later cases were occurring in the community."
The virus has been notable for affecting older children and young adults, groups normally not hard-hit by influenza. The CDC said summer camps and military facilities were affected, but both agencies said there was no evidence the virus was mutating into drug-resistant or more virulent forms.
The CDC broadened its recommendations for seasonal flu vaccine — saying all children over the age of 6 months should get one, in part to lower the overall burden of respiratory disease when autumn and winter come.
WHO said vaccination against H1N1 might start in weeks, even though clinical trials to test the safety, efficacy and needed dosage of H1N1 vaccines have barely started. "Manufacturers are expected to have vaccines for use around September.
A number of companies are working on the pandemic vaccine production and have different timelines," WHO said. At least 50 governments have placed orders or are currently negotiating with pharmaceutical companies to secure supplies of H1N1 vaccines, which are still being developed.
WHO is trying to ensure that health workers in poor countries can be vaccinated so hospitals can stay open if the flu becomes more debilitating as it spreads. Sanofi-Aventis and GlaxoSmithKline have promised to donate 150 million doses to this aim to date.
Interesting3: A habitually shod lifestyle has consequences for the biologically normal anatomy and function of the foot. Kristiaan D’Aout and Peter Aerts from the Biology Department at the University of Antwerp collaborated for their work on the biomechanics of barefoot walking with Dirk De Clercq (University of Gent, Belgium) and with Todd Pataky (University of Liverpool, UK).
This team made the first detailed analysis of foot function in people who have never worn shoes. For this project, they travelled to South India, where many people walk barefoot throughout life, mostly for spiritual or financial reasons.
In this way, the researchers wanted to gain an insight into the biologically normal function of the foot, which evolved for millions of years – unshod.
The research was funded by the Fund for Scientific Research – Flanders, and was based on dynamic measurements of pressure distribution under to foot sole during walking.
It showed that the foot of habitual barefoot walkers differs, both in shape and in function, from that of habitually shod peers.
Barefooters have a relatively wide forefoot and manage at better distributing pressures over the entire surface of the foot sole, resulting in lower (and most likely favorable) peak pressures.
As such, the fundamental scientific results are also important for clinicians and for the design of quality footwear, which should not hamper the foot’s biologically normal function.
Interesting4: How clouds over the ocean affect our climate, and how climate change may be affecting them, is not well known. There is no network of observing stations like on land, and climate models have not been shown to really simulate clouds well.
They may be just too fine a detail for models that cover such large scale phenomenon as oceanic circulation. But clouds over the oceans have been thought be important in our understanding of what drives our climate.
In a study published in the July 24 issue of Science, researchers Amy Clement and Robert Burgman from the University of Miami’s Rosenstiel School of Marine and Atmospheric Science and Joel Norris from Scripps Institution of Oceanography at UC San Diego begin to unravel this mystery.
Using observational data collected over the last 50 years and complex climate models, the team has established that low-level stratiform clouds appear to dissipate as the ocean warms, indicating that changes in these clouds may enhance the warming of the planet.
The result of their analysis was a surprising degree of agreement between two multi-decade datasets that were not only independent of each other, but that employed fundamentally different measurement methods.
One set consisted of collected visual observations from ships over the last 50 years, and the other was based on data collected from weather satellites.
"The agreement we found between the surface-based observations and the satellite data was almost shocking," said Clement, a professor of meteorology and physical oceanography at the University of Miami and winner of the American Geophysical Union’s 2007 Macelwane Award for her groundbreaking work on climate change.
"These are subtle changes that take place over decades. It is extremely encouraging that a satellite passing miles above the earth would document the same thing as sailors looking up at a cloudy sky from the deck of a ship."
Together, the observations and the Hadley Centre model results provide evidence that low-level stratiform clouds, which currently shield the earth from the sun’s radiation, may dissipate in warming climates, allowing the oceans to further heat up, which would then cause more cloud dissipation.
"This is somewhat of a vicious cycle potentially exacerbating global warming," said Clement. "But these findings provide a new way of looking at cloud changes.
This can help to improve the simulation of clouds in climate models, which will lead to more accurate projections of future climate changes."
Interesting5: By the 1970s, people were spewing so much soot, ash, and other tiny particles into the lower atmosphere that climate researchers called the effect the "human volcano." Now it looks like humans are imitating volcanoes in yet another part of the atmosphere.
New research blames this decade’s thickening of the haze in the stratosphere on the burst of coal burning around the world. The chief offender appears to be China. Until now, scientists could see no sign that anything but volcanic eruptions packed enough punch to pollute the stratosphere.
Smokestacks also spew sulfur, creating acid rain and attacking people’s lungs, but no smokestack can send it up through the lower atmosphere and into the stratosphere where it turns into haze.
Or can it? In a paper in press in Geophysical Research Letters, atmospheric scientist David Hofmann of the University of Colorado, Boulder, and colleagues report a human role in stratospheric haze pollution.
Since 1994, National Oceanic and Atmospheric Administration scientists have used lidar to probe stratospheric haze in the skies above Mauna Loa in Hawaii and, since 2000, above Boulder.
Like weather radar, which uses microwaves to measure rain, upward-pointing lidar bounces electromagnetic waves off distant objects–microscopic haze particles in the case of haze.
Both the Mauna Loa and Boulder lidars show a long-term upward trend in stratospheric haze since about 2001 of 4% to 7% per year (blue line in figure), the group reports.
"This trend is quite large," says Hofmann. Volcanoes aren’t to blame, he says, as the most recent major volcanic activity–Mt. Pinatubo’s "eruption of the century" in 1991–occurred long enough ago that any sulfurous gases it blasted into the stratosphere to form haze are long since gone.
So Hofmann turned to humans. Sulfur emitted by coal-burning industries and power plants could spread through the lower atmosphere, he explains, and then less than 1% of it might have been caught in the strong updrafts of tropical storms–the equivalent of a volcano’s plume–that could loft it into the stratosphere.
The world’s 5.2% per year increase in sulfur emissions from 2002 to 2007–mainly from China–could readily account for the increase in stratospheric haze, the group calculates. However, experts in stratospheric circulation caution that there’s an alternative explanation for increasing haze.
Rather than the human-induced increase in pollutant sulfur in the lower atmosphere, the cause could be an acceleration of the updrafts that loft air and any sulfur in it into the stratosphere. The speedup could be natural or another effect of global warming.
Still, Hofmann notes that humans don’t hold a candle to volcanoes when it comes to stratospheric pollution. Even if, as expected, China dramatically increases its coal burning by 2022, the resulting doubling of stratospheric haze would be just 5% of another Pinatubo–resulting in a slight cooling of the stratosphere and a tiny amount of ozone damage. The corrosive effects of China’s coal burning in the lower atmosphere would be another matter.
Posted by Glenn
No Comments
July 24-25, 2009
Air Temperatures – The following maximum temperatures were recorded across the state of Hawaii Friday afternoon:
Lihue, Kauai – 82
Honolulu, Oahu – 90
Kaneohe, Oahu – 83
Kahului, Maui – 88
Hilo, Hawaii – 86
Kailua-kona – 86
Air Temperatures ranged between these warmest and coolest spots near sea level – and on the highest mountains…at 4 p.m. Friday afternoon:
Kahului, Maui – 86F
Hilo, Hawaii – 80
Haleakala Crater – 57 (near 10,000 feet on Maui)
Mauna Kea summit – 61 (near 14,000 feet on the Big Island)
Precipitation Totals – The following numbers represent the largest precipitation totals (inches) during the last 24 hours on each of the major islands, as of Friday afternoon:
2.51 Lihue airport, Kauai
0.37 Oahu Forest NWR, Oahu
0.00 Molokai
0.09 Lanai
0.00 Kahoolawe
0.22 Kula, Maui
0.15 Kealakekua, Big Island
Marine Winds – Here’s the latest (automatically updated) weather map showing a 1026 millibar high pressure system far to the northeast of the islands. As the trough of low pressure, now to the west of the state, continues moving away…we’ll find strengthening trade winds into Sunday.
Satellite and Radar Images: To view the cloud conditions we have here in Hawaii, please use the following satellite links, starting off with this Infrared Satellite Image of the islands to see all the clouds around the state during the day and night. This next image is one that gives close images of the islands only during the daytime hours, and is referred to as a Close-up visible image. This next image shows a larger view of the Pacific…giving perspective to the wider ranging cloud patterns in the Pacific Ocean. Finally, here’s a Looping IR satellite image, making viewable the clouds around the islands 24 hours a day. To help you keep track of where any showers may be around the islands, here’s the latest animated radar image.
Hawaii’s Mountains – Here’s a link to the live webcam on the summit of near 14,000 foot Mauna Kea on the Big Island of Hawaii. The tallest peak on the island of Maui is the Haleakala Crater, which is near 10,000 feet in elevation. These two webcams are available during the daylight hours here in the islands…and when there’s a big moon rising just after sunset for an hour or two! Plus, during the nights and early mornings you will be able to see stars, and the sunrise too…depending upon weather conditions.
Tropical Cyclone activity in the eastern and central Pacific – Here’s the latest weather information coming out of the National Hurricane Center, covering the eastern north Pacific. You can find the latest tropical cyclone information for the central north Pacific (where Hawaii is located) by clicking on this link to the Central Pacific Hurricane Center. Here’s a tracking map covering both the eastern and central Pacific Ocean. A satellite image, which shows the entire ocean area between Hawaii and the Mexican coast…can be found here.
Aloha Paragraphs

The beauty of the Hawaiian Islands
The trade winds are back, and will be around well into the future…gaining strength this weekend into the new week ahead. As these easterly trade winds fill back into our Hawaiian Islands weather picture more fully, we’ll begin to feel some relief from the heat. Looking a bit further ahead, these trade winds will become rather blustery, with small craft wind advisories going up as we move into the new work week ahead. The volcanic haze that has been around locally, will clear during the day Saturday.
As the recent trough of low pressure moves further away, we’ll move back into a typical trade wind weather pattern. As a stronger version of the trade winds return soon, the bias for showers will shift back over to the windward sides then. There are no organized rainmakers on our eastern horizon, so that showers will be fairly minimal, even along the windward sides. The leeward sides will generally be dry.
As noted above, the trough is moving away, and the trade winds will be moving back over us. Meanwhile, we’ll continue find a substantial amount of high cirrus clouds moving across our islands skies. As this looping satellite image shows, we’re going to see at least some sunshine muting and filtering cirrus moving over us. As the aforementioned trough moves further west, we will eventually see less of this high cirrus cloudiness.
It’s Friday evening here in Kula, Maui, as I begin writing this last part of this morning’s narrative. It has been a cloudy day across much of the island chain. There’s been a combination of daytime generated cumulus cloudiness…and those high cirrus clouds too. Again, looking at this IR satellite image, you can see what I’m talking about. I expect Saturday, and Sunday too, to be favorably inclined days, with returning trade winds, less haze, and hopefully less cloudiness for those sun bathers that got skunked Friday! ~~~ I’m going to take the drive down to Kahului this evening to see the new Harry Potter film called Harry Potter and the Half-blood Prince (2009). Folks are telling me that this is the best one of these films. The short and sweet synopsis is: Harry Potter returns back to Hogwarts and faces his darkest threat yet. I’ve always enjoyed these films, and am feeling the need to lose myself into a good story. Here’s a trailer for this film in case you have the desire to check it out. ~~~ I’ll be back again Saturday morning with your next new weather narrative, as well as my impression of the film. I hope you have a great Friday night from wherever you happen to be reading from! Aloha for now…Glenn.
Interesting: You drive to the office, sit at a computer all day, drive home and then park yourself on the couch. If that’s your life, leading obesity experts say, the government should be changing your environment and making it possible for you to become more active.
There has been a big reduction in "muscle-power transportation," such as walking or biking to work or to the store, says Russell Pate, an exercise researcher at the University of South Carolina-Columbia.
This is partly because of sprawling communities and long commutes, but he says it’s also because people don’t have safe places to walk.
"If we have safe routes, sidewalks, bike trails that go to destinations that people need to get to, then those trails will be more heavily used," Pate says.
The government’s responsibility to get Americans moving will be discussed at the three-day Weight of the Nation conference next week. Public health advocates, government leaders and obesity researchers will meet in Washington, D.C.
Intersting2: Global health officials stepped up efforts to prepare for quick vaccination against the H1N1 pandemic virus, saying on Friday it appeared now to be affecting older age groups spared earlier in the pandemic. The World Health Organization and the U.S. Centers for Disease Control and Prevention both said they can only estimate how many people have been infected but the swine flu virus was still spreading quickly.
"As the disease expands broadly into communities, the average age of the cases is appearing to increase slightly," the WHO said in a statement. "This may reflect the situation in many countries where the earliest cases often occurred as school outbreaks but later cases were occurring in the community."
The virus has been notable for affecting older children and young adults, groups normally not hard-hit by influenza. The CDC said summer camps and military facilities were affected, but both agencies said there was no evidence the virus was mutating into drug-resistant or more virulent forms.
The CDC broadened its recommendations for seasonal flu vaccine — saying all children over the age of 6 months should get one, in part to lower the overall burden of respiratory disease when autumn and winter come.
WHO said vaccination against H1N1 might start in weeks, even though clinical trials to test the safety, efficacy and needed dosage of H1N1 vaccines have barely started. "Manufacturers are expected to have vaccines for use around September.
A number of companies are working on the pandemic vaccine production and have different timelines," WHO said. At least 50 governments have placed orders or are currently negotiating with pharmaceutical companies to secure supplies of H1N1 vaccines, which are still being developed.
WHO is trying to ensure that health workers in poor countries can be vaccinated so hospitals can stay open if the flu becomes more debilitating as it spreads. Sanofi-Aventis and GlaxoSmithKline have promised to donate 150 million doses to this aim to date.
Interesting3: A habitually shod lifestyle has consequences for the biologically normal anatomy and function of the foot. Kristiaan D’Aout and Peter Aerts from the Biology Department at the University of Antwerp collaborated for their work on the biomechanics of barefoot walking with Dirk De Clercq (University of Gent, Belgium) and with Todd Pataky (University of Liverpool, UK).
This team made the first detailed analysis of foot function in people who have never worn shoes. For this project, they travelled to South India, where many people walk barefoot throughout life, mostly for spiritual or financial reasons.
In this way, the researchers wanted to gain an insight into the biologically normal function of the foot, which evolved for millions of years – unshod.
The research was funded by the Fund for Scientific Research – Flanders, and was based on dynamic measurements of pressure distribution under to foot sole during walking.
It showed that the foot of habitual barefoot walkers differs, both in shape and in function, from that of habitually shod peers.
Barefooters have a relatively wide forefoot and manage at better distributing pressures over the entire surface of the foot sole, resulting in lower (and most likely favorable) peak pressures.
As such, the fundamental scientific results are also important for clinicians and for the design of quality footwear, which should not hamper the foot’s biologically normal function.
Interesting4: How clouds over the ocean affect our climate, and how climate change may be affecting them, is not well known. There is no network of observing stations like on land, and climate models have not been shown to really simulate clouds well.
They may be just too fine a detail for models that cover such large scale phenomenon as oceanic circulation. But clouds over the oceans have been thought be important in our understanding of what drives our climate.
In a study published in the July 24 issue of Science, researchers Amy Clement and Robert Burgman from the University of Miami’s Rosenstiel School of Marine and Atmospheric Science and Joel Norris from Scripps Institution of Oceanography at UC San Diego begin to unravel this mystery.
Using observational data collected over the last 50 years and complex climate models, the team has established that low-level stratiform clouds appear to dissipate as the ocean warms, indicating that changes in these clouds may enhance the warming of the planet.
The result of their analysis was a surprising degree of agreement between two multi-decade datasets that were not only independent of each other, but that employed fundamentally different measurement methods.
One set consisted of collected visual observations from ships over the last 50 years, and the other was based on data collected from weather satellites.
"The agreement we found between the surface-based observations and the satellite data was almost shocking," said Clement, a professor of meteorology and physical oceanography at the University of Miami and winner of the American Geophysical Union’s 2007 Macelwane Award for her groundbreaking work on climate change.
"These are subtle changes that take place over decades. It is extremely encouraging that a satellite passing miles above the earth would document the same thing as sailors looking up at a cloudy sky from the deck of a ship."
Together, the observations and the Hadley Centre model results provide evidence that low-level stratiform clouds, which currently shield the earth from the sun’s radiation, may dissipate in warming climates, allowing the oceans to further heat up, which would then cause more cloud dissipation.
"This is somewhat of a vicious cycle potentially exacerbating global warming," said Clement. "But these findings provide a new way of looking at cloud changes.
This can help to improve the simulation of clouds in climate models, which will lead to more accurate projections of future climate changes."
Interesting5: By the 1970s, people were spewing so much soot, ash, and other tiny particles into the lower atmosphere that climate researchers called the effect the "human volcano." Now it looks like humans are imitating volcanoes in yet another part of the atmosphere.
New research blames this decade’s thickening of the haze in the stratosphere on the burst of coal burning around the world. The chief offender appears to be China. Until now, scientists could see no sign that anything but volcanic eruptions packed enough punch to pollute the stratosphere.
Smokestacks also spew sulfur, creating acid rain and attacking people’s lungs, but no smokestack can send it up through the lower atmosphere and into the stratosphere where it turns into haze.
Or can it? In a paper in press in Geophysical Research Letters, atmospheric scientist David Hofmann of the University of Colorado, Boulder, and colleagues report a human role in stratospheric haze pollution.
Since 1994, National Oceanic and Atmospheric Administration scientists have used lidar to probe stratospheric haze in the skies above Mauna Loa in Hawaii and, since 2000, above Boulder.
Like weather radar, which uses microwaves to measure rain, upward-pointing lidar bounces electromagnetic waves off distant objects–microscopic haze particles in the case of haze.
Both the Mauna Loa and Boulder lidars show a long-term upward trend in stratospheric haze since about 2001 of 4% to 7% per year (blue line in figure), the group reports.
"This trend is quite large," says Hofmann. Volcanoes aren’t to blame, he says, as the most recent major volcanic activity–Mt. Pinatubo’s "eruption of the century" in 1991–occurred long enough ago that any sulfurous gases it blasted into the stratosphere to form haze are long since gone.
So Hofmann turned to humans. Sulfur emitted by coal-burning industries and power plants could spread through the lower atmosphere, he explains, and then less than 1% of it might have been caught in the strong updrafts of tropical storms–the equivalent of a volcano’s plume–that could loft it into the stratosphere.
The world’s 5.2% per year increase in sulfur emissions from 2002 to 2007–mainly from China–could readily account for the increase in stratospheric haze, the group calculates. However, experts in stratospheric circulation caution that there’s an alternative explanation for increasing haze.
Rather than the human-induced increase in pollutant sulfur in the lower atmosphere, the cause could be an acceleration of the updrafts that loft air and any sulfur in it into the stratosphere. The speedup could be natural or another effect of global warming.
Still, Hofmann notes that humans don’t hold a candle to volcanoes when it comes to stratospheric pollution. Even if, as expected, China dramatically increases its coal burning by 2022, the resulting doubling of stratospheric haze would be just 5% of another Pinatubo–resulting in a slight cooling of the stratosphere and a tiny amount of ozone damage. The corrosive effects of China’s coal burning in the lower atmosphere would be another matter.
Posted by Glenn
No Comments
July 23-24, 2009
Air Temperatures – The following maximum temperatures were recorded across the state of Hawaii Thursday afternoon:
Lihue, Kauai – 88
Honolulu, Oahu – 90
Kaneohe, Oahu – 84
Kahului, Maui – 90
Hilo, Hawaii – 86
Kailua-kona – 86
Air Temperatures ranged between these warmest and coolest spots near sea level – and on the highest mountains…at 5 p.m. Thursday evening:
Kahului, Maui – 86F
Lihue, Kauai – 78
Haleakala Crater – 54 (near 10,000 feet on Maui)
Mauna Kea summit – 45 (near 14,000 feet on the Big Island)
Precipitation Totals – The following numbers represent the largest precipitation totals (inches) during the last 24 hours on each of the major islands, as of Thursday afternoon:
5.75 Hanalei River, Kauai
5.32 Oahu Forest NWR, Oahu
0.08 Molokai
0.230 Lanai
0.33 Kahoolawe
1.60 West Wailuaiki, Maui
3.48 Pali 2, Big Island
Marine Winds – Here’s the latest (automatically updated) weather map showing that high pressure systems remain active far to the northeast and northwest of the islands Friday. Our winds however will remain light, as a trough of low pressure, now to the west of the state, continues moving away…allowing the trade winds to gradually pick up in speed Saturday.
Satellite and Radar Images: To view the cloud conditions we have here in Hawaii, please use the following satellite links, starting off with this Infrared Satellite Image of the islands to see all the clouds around the state during the day and night. This next image is one that gives close images of the islands only during the daytime hours, and is referred to as a Close-up visible image. This next image shows a larger view of the Pacific…giving perspective to the wider ranging cloud patterns in the Pacific Ocean. Finally, here’s a Looping IR satellite image, making viewable the clouds around the islands 24 hours a day. To help you keep track of where any showers may be around the islands, here’s the latest animated radar image.
Hawaii’s Mountains – Here’s a link to the live webcam on the summit of near 14,000 foot Mauna Kea on the Big Island of Hawaii. The tallest peak on the island of Maui is the Haleakala Crater, which is near 10,000 feet in elevation. These two webcams are available during the daylight hours here in the islands…and when there’s a big moon rising just after sunset for an hour or two! Plus, during the nights and early mornings you will be able to see stars, and the sunrise too…depending upon weather conditions.
Tropical Cyclone activity in the eastern and central Pacific – Here’s the latest weather information coming out of the National Hurricane Center, covering the eastern north Pacific. You can find the latest tropical cyclone information for the central north Pacific (where Hawaii is located) by clicking on this link to the Central Pacific Hurricane Center. Here’s a tracking map covering both the eastern and central Pacific Ocean. A satellite image, which shows the entire ocean area between Hawaii and the Mexican coast…can be found here.
Aloha Paragraphs

The beautiful south shore…Oahu, Hawaii
The trough of low pressure, which has greatly slowed down our winds, was located near Kauai Thursday evening. This slack wind flow has brought us into what we call a modified convective weather pattern, with muggy conditions prevailing for a little while longer. Daytime air temperatures will feel very warm, and at times sticky too! During the nights, it will cool off a little, but not as much as usual, while stronger trade winds are blowing. Speaking of the trades, they will wait to return in the next day or two…at which point they’ll bring back relief from the heat.
This trough of low pressure brought localized heavy showers to the state Thursday…especially on Kauai. The trough will keep our atmosphere shower prone for another day or so, with still the chance of localized heavy precipitation at times. The most likely place for these showers to fall, will be over the interior sections during the afternoon hours…although a few heavy showers could break out just about anywhere at any time of day or night. If the trade winds return as expected later Friday or by Saturday, the bias for showers will shift back over to the windward sides then.
This trough of low pressure, causing the showery weather, is aligned more or less northeast to southwest to the south of Kauai Thursday evening. Here’s a weather map, which shows this dashed line trough. While this trough of low pressure is over, or around our area, showers will have an easier time falling. As I’m mentioned many times lately, this summertime precipitation event is good fortune for our islands, as we need every drop now. Summer is always our dry season, so to be on the receiving end of this moisture…is adding a valuable resource to our aquifers and water reservoirs.
In sum, it will be muggy and sultry for the time being, with little in the way of relief from the daytime heat just yet. We can see evidence of this trough of low pressure over us, by clicking on this satellite image…especially in the area around Kauai and Oahu at the time of this writing. There’s plenty of clouds around, with those larger brighter white areas…where the heaviest rains are falling. We can take a look at this looping radar image, so that we can track the rainfall as it crops up over the island chain.
It’s Thursday evening here in Kihei, Maui, as I begin writing this last part of today’s narrative. Wow, what a hot day, with the perfect example being both Honolulu and Kahului, where the mercury climbed all the way up to 90F degrees. Here in Kihei, I’m pretty sure it was at least that hot, and felt several degrees warmer than that! Besides the heat, caused by the excess humidity, and the lack of trade winds, we had showers around too. Most of the heavy stuff fell over and around Kauai, although Oahu was getting into the act late in the afternoon as well. There were showers on Maui at times, with even a thunderstorm or two reported on the Big Island. ~~~ It seems like the trade winds are already trying to get going again, at least that’s how it looks here in Kihei, before I take the drive back upcountry to Kula. There’s not that many clouds out the window here, and I don’t see any rain in my limited view. If I run into anything overly wet, on my drive home, I’ll come back online and let you know. Otherwise, I’ll be back early Friday morning with your next new weather narrative from paradise. I hope you have a great Thursday night from wherever you happen to be reading from! Aloha for now…Glenn.
Interesting: Feeling stressed? Then try savoring the scent of lemon, mango, lavender, or other fragrant plants. Scientists in Japan are reporting the first scientific evidence that inhaling certain fragrances alter gene activity and blood chemistry in ways that can reduce stress levels.
In the new study, Akio Nakamura and colleagues note that people have inhaled the scent of certain plants since ancient times to help reduce stress, fight inflammation and depression, and induce sleep.
Aromatherapy, the use of fragrant plant oils to improve mood and health, has become a popular form of alternative medicine today. And linalool is one of the most widely used substances to soothe away emotional stress. Until now, however, linalool’s exact effects on the body have been a deep mystery.
The scientists exposed lab rats to stressful conditions while inhaling and not inhaling linalool. Linalool returned stress-elevated levels of neutrophils and lymphocytes — key parts of the immune system — to near-normal levels.
Inhaling linalool also reduced the activity of more than 100 genes that go into overdrive in stressful situations. The findings could form the basis of new blood tests for identifying fragrances that can soothe stress, the researchers say.
Interesting2: Increasing numbers of children around the world are suffering from respiratory problems – coughing, wheezing and asthma attacks. Although the key external causes of these diseases were identified a long time ago (traffic and industrial air pollution), it had not previously been possible to distinguish clearly between these two factors so as to have a targeted impact on them.
Researchers at the Helmholtz Centre for Environmental Research (UFZ) and the University of Leipzig carried out research in this area together with colleagues from the University of La Plata and can now confirm that air pollution caused by industry has even more grave effects than vehicle exhaust fumes.
The recently completed study on ‘Combined effects of airborne pollutants as risk factors for environmental diseases’ was conducted as part of a long-standing collaborative venture, supported by the international office of the German Federal Ministry of Education and Research, between the Helmholtz Centre for Environmental Research (UFZ), the University of Leipzig and the University of La Plata in Argentina. The results have been published in several journals, including the Journal of Allergy and Clinical Immunology and Toxicology.
Interesting3: A reduction of as little as five per cent in fisheries catch could result in as much as 30 per cent of the British Columbia coastal ecosystems being protected from overfishing, according to a new study from the UBC Fisheries Centre in Canada. The study, by Natalie Ban and Amanda Vincent of Project Seahorse, proposes modest reductions in areas where fisheries take place, rather than the current system of marine protected areas which only safeguard several commercially significant species, such as rockfish, shrimp, crab, or sea cucumber.
The article is published July 21 in PLoS One. Using B.C.’s coastal waters as a test case, the study affirms that small cuts in fishing – if they happen in the right places – could result in very large unfished areas. For example, a two per cent cut could result in unfished areas covering 20 per cent of the B.C. coast, offered real conservation gains. "The threat of over-fishing to our marine ecosystems is well-documented," says Ban, who recently completed her PhD at the UBC Fisheries Centre.
"Our study suggests a different approach could reduce the impacts on fishers as well as helping us move towards achieving conservation goals." Part of the reason for the research was to open a debate on how to meet conservation goals set during the 2002 World Summit on Sustainable Development, which included establishing a network of marine protected areas by 2012.
"With the current rates of progress, there is no chance of meeting our 2012 targets," says Ban. "Given that fishers recognize the problem of overfishing but often regard marine protected areas as serving only to constrain them, another approach must be found. That’s why we undertook this study."
The research looked at spatial catch data from Fisheries and Ocean Canada for 13 commercial fisheries on Canada’s west coast to show that large areas representing diverse ecoregions and habitats might be protected at a small cost to fisheries.
Interesting4: When Brazilian port workers began inspecting the contents of a cargo ship from the U.K., they were surprised to find more than 1,400 tons of waste, labeled as recyclable plastics, included with the cargo. The waste, packed in 89 shipping containers, was unloaded in three southern Brazilian ports and was said to contain batteries, computer parts, DVDs, cleaning product containers, clothes, shoes, old toys, baby diapers, food remains and medical waste, among other items.
The U.K. and Brazil are both signatories of the Basel Convention, the United Nations treaty that controls the cross-border movement of hazardous waste. An investigation has been launched to determine how the waste was exported and if the companies responsible for the export were in violation of the international treaty.
Interesting5: California’s famously fertile Central Valley — home to a $9 billion industry that provides much of the United States’ supply of fruit and nut crops — may be teetering on the edge of a climate-induced disaster, according to a new study. A team lead by Eike Luedeling of University of California, Davis used a computer simulation of past and future climates in the 400-mile long valley to predict what impact future, human-induced global warming could have on fruit and nut tree farmers.
Fruit trees need cold winter weather almost as much as they need warm summer sunshine. If it doesn’t get cold enough, trees stay dormant later into the spring, and flower erratically. As a result fruit crops may not be fully matured at harvest time, or there may be nothing to pick at all.
Interesting6: The average fuel efficiency of the US vehicle fleet has risen by just 3 miles per gallon since the days of the Ford Model T, and has barely shifted at all since 1991. Those are the conclusions reached by Michael Sivak and Omer Tsimhoni at the University of Michigan Transportation Research Institute in Ann Arbor.
They analyzed the fuel efficiency of the entire US vehicle fleet of cars, motorcycles, trucks and buses from 1923 to 2006. They found that from 1923 to 1935 fuel efficiency hovered around 14 mpg (5.95 km/l), but then fell gradually to a nadir of only 11.9 mpg (5.08 km/l) in 1973.
By 1991, however, the efficiency of the total fleet had risen by 42 per cent on 1973 levels to 16.9 mpg (7.18 km/l), a compound annual rate of 2 per cent. The improvements made up to 1991 were in response to two international events — the 1973 oil embargo by the Organization of Petroleum Exporting Countries (OPEC), and the Iranian Revolution of 1979.
Interesting7: The 2009 hurricane season has been off to a slow start, but experts say the real activity usually doesn’t begin until August. The early season lull doesn’t necessarily mean a weak overall season. Thursday was the one-year anniversary of Hurricane Dolly, which when it struck South Texas became the Rio Grande Valley’s most destructive storm in four decades.
A maturing El Nino in the Pacific Ocean, which tends to depress storm activity, makes the outlook for the rest of the season look promising, the Houston Chronicle reported Thursday. But forecasters say it’s no time to relax and El Nino years can still produce destructive storms. The 2004 season didn’t get its first storm until Hurricane Alex began developing on July 31. After that there were six major hurricanes, including Ivan.
Posted by Glenn
No Comments
July 22-23, 2009
Air Temperatures – The following maximum temperatures were recorded across the state of Hawaii Wednesday afternoon:
Lihue, Kauai – 83
Honolulu, Oahu – 89
Kaneohe, Oahu – 84
Kahului, Maui – 79
Hilo, Hawaii – 78
Kailua-kona – 88
Air Temperatures ranged between these warmest and coolest spots near sea level – and on the highest mountains…at 5 p.m. Wednesday evening:
Port Allen, Kauai – 86F
Hilo, Hawaii – 75
Haleakala Crater – 52 (near 10,000 feet on Maui)
Mauna Kea summit – 39 (near 14,000 feet on the Big Island)
Precipitation Totals – The following numbers represent the largest precipitation totals (inches) during the last 24 hours on each of the major islands, as of Wednesday afternoon:
0.29 Mount Waialaele, Kauai
0.16 Manoa Valley, Oahu
0.11 Molokai
0.00 Lanai
0.00 Kahoolawe
2.11 Oheo Gulch, Maui
2.28 Hakalau, Big Island
Marine Winds – Here’s the latest (automatically updated) weather map showing that high pressure systems remain active far to the northeast and northwest of the islands Thursday. Our winds however will be lighter now, as a trough of low pressure moves across the state.
Satellite and Radar Images: To view the cloud conditions we have here in Hawaii, please use the following satellite links, starting off with this Infrared Satellite Image of the islands to see all the clouds around the state during the day and night. This next image is one that gives close images of the islands only during the daytime hours, and is referred to as a Close-up visible image. This next image shows a larger view of the Pacific…giving perspective to the wider ranging cloud patterns in the Pacific Ocean. Finally, here’s a Looping IR satellite image, making viewable the clouds around the islands 24 hours a day. To help you keep track of where any showers may be around the islands, here’s the latest animated radar image.
Hawaii’s Mountains – Here’s a link to the live webcam on the summit of near 14,000 foot Mauna Kea on the Big Island of Hawaii. The tallest peak on the island of Maui is the Haleakala Crater, which is near 10,000 feet in elevation. These two webcams are available during the daylight hours here in the islands…and when there’s a big moon rising just after sunset for an hour or two! Plus, during the nights and early mornings you will be able to see stars, and the sunrise too…depending upon weather conditions.
Tropical Cyclone activity in the eastern and central Pacific – Here’s the latest weather information coming out of the National Hurricane Center, covering the eastern north Pacific. You can find the latest tropical cyclone information for the central north Pacific (where Hawaii is located) by clicking on this link to the Central Pacific Hurricane Center. Here’s a tracking map covering both the eastern and central Pacific Ocean. A satellite image, which shows the entire ocean area between Hawaii and the Mexican coast…can be found here.
Aloha Paragraphs

Showers and rainbow…Hawaii
An approaching trough of low pressure will begin to tamp down our local trade winds…sending us into sultry atmospherics over the next several days. Our refreshing trade winds remained active Wednesday, still providing welcome relief from the summer heat. Forecast charts however continue to show our trades faltering during the upcoming second half of this week. This will bring us into a convective weather pattern, with muggy conditions prevailing into the weekend. Fortunately, these sultry conditions won’t last long, as the cooling trade winds begin to fill back into our Hawaiian Islands weather picture starting Sunday or next Monday.
An area of showers is now moving over the state from the east, which had locally heavy rains falling along the windward sides of both Maui and the Big Island Wednesday. Eventually though, as this moisture combines with the fading trade winds, those showers will likely shift over to the mountains during the afternoon hours. The greatest likelihood of showers will be now through Saturday. If the trade winds return as expected by Sunday or Monday, the emphasis for showers will return to the windward sides then.
This trough of low pressure, causing the showery weather, is aligned more or less northeast to southwest, and will be sliding over the island chain from the east. Here’s a weather map, which shows this dashed line trough just to our east Wednesday evening. This has put the Big Island and Maui under the waterfall first, although we should see rainfall arriving on all the islands over the next couple of days. There will be some heavy precipitation occurring here and there, with the chance of more thunderstorms over the next several days as well.
This atmospheric destabilizing trough stalled just to the east of the Big Island Wednesday, but it will migrate westward again soon. There continues to be some complexity to the current meteorological conditions, so that it will be difficult to pin down exactly what will be happening ahead of time. Lets take a look at this trough of low pressure to our east, but clicking on this satellite image. This area of clouds will be moving from right towards the left, or over the islands. There appears to be some pretty substantial rain mixed into this area of clouds! We can take a look at this looping radar image, so that we can track the rainfall as it moves through the island chain.
It’s Wednesday evening here in Kihei, Maui, as I begin writing this last part of today’s narrative. Wednesday was still quite windy here in the islands, as these breezy winds remained active. At one point during the afternoon, I noted that wind gusts were topping 40 mph at that windy bay at Maalaea, Maui. At around 5pm there were still 38 mph gusts there, along with an active flood advisory over all of the islands of Maui County. The Big Island had just such an advisory earlier in the day. I notced that thunder was being heard at the Hilo airport at around 3pm in the afternoon. I’d say we could expect more of this kind of action as we move into Thursday. ~~~ I’ll be back here early Thursday morning with your next new weather narrative, that is unless I see something that really catches my eye, on my drive back upcountry to Kula. Now that I’m home, and after taking my evening walk, I find pea soup fog here at my place, with a very warm 73F degrees at 645pm. I hope have a great Wednesday night from wherever you happen to be reading from! Aloha for now…Glenn.
Interesting: For three minutes and four seconds on Wednesday morning, an ethereal blue-grey darkness descended on this eternal city of light. To the east across the Ganga, it was like God’s own eye flashing in the sky above, giving pilgrims, bathers and eclipse-watchers in the jam-packed ghats sights they are unlikely to forget in their lifetimes.
While clouds blotted out the view in most other places in India, the century’s most spectacular total eclipse of the Sun was witnessed in full glory in holy Benaras. The eclipse displayed all the classical phases associated with the event. Seconds before the Sun was fully blocked by the lunar disc, a brilliant "diamond ring" formed in the sky.
Moments later, brightness dropped dramatically as totality began, a phase technically called second contact that began at 10 seconds past 6:24 am. A roar went up at the ghats as people gasped and screamed in awe. Some stared in stunned silence while others shook hands with total strangers in fits of joy.
The city was suddenly clothed in a surreal glow of faint light that was eerie, exhilarating and nothing like most had ever seen before. Up in the sky, a soft white halo formed around the black ball of the lunar disc.
This was the Sun’s atmosphere, called corona (meaning a crown), that’s visible from Earth only during a total eclipse. The sight is often called God’s eye, and in Benaras on Wednesday, it appeared just that — a giant eye in the sky with a black "eyeball" and a white "cornea".
Spots of light, called Baily’s beads, appeared around the edges of the Moon’s disc and in photographs clicked by lens men, rarely-seen solar prominences were clearly visible. These are huge masses of fiery matter that get spewed from the Sun’s surface and are pulled back in by its gravity.
Interesting2: Lonesome George, the last remaining giant tortoise of his kind, may soon be a father to the delight of conservationists. Un-hatched eggs have been found in his "bachelor" pen in the Galapagos Islands, his keepers said on Tuesday. For decades, the last known Pinta island tortoise had shown little interest in reproducing.
But at age 90, George is said to be in his sexual prime. Galapagos tortoises were among the species Charles Darwin observed to formulate his theory of evolution in the 19th century. Scientist have been trying to get George to mate since 1993, when they introduced two female tortoises of a different subspecies into his pen.
The Galapagos National Park said the five eggs found on Monday were "in perfect condition" and have been placed in an incubator. "Now we have to wait for the incubation period of 120 days to find out whether they are fertile," it said in a statement.
The 198-pound George stunned conservationists last year by mating for the first time in the 36 years he has been in captivity. But the eggs laid by one of his female companions turned out to be infertile.
Tortoises were hunted for their meat by sailors and fishermen to the point of extinction, while their habitat has been eaten away by goats introduced from the mainland. Some 20,000 giant tortoises still live on the Galapagos.
Interesting3: FedEx increased its North America hybrid truck fleet by 50 percent with today’s announcement of 92 additional retrofitted delivery trucks. The shipping giant now boasts 264 hybrid trucks, which it says is the largest hybrid package delivery fleet in North America. The repurposed vehicles are 44 percent more fuel-efficient that standard FedEx delivery trucks and produce 96 percent fewer particulates and 75 percent fewer smog-causing emissions.
The company turned to Freightliner Custom Chassis Corp. and Eaton Corp. for the delivery truck retrofits performed on 2000 and 2001 model year delivery trucks, which had been driven between 300,000 and 500,000 miles. The retrofitted trucks will be largely deployed in the Los Angeles, San Diego and San Francisco metropolitan areas.
Interesting4: Winter chill, a vital climatic trigger for many tree crops, is likely to decrease by more than 50 percent during this century as global climate warms, making California no longer suitable for growing many fruit and nut crops, according to a team of researchers from the University of California, Davis, and the University of Washington. In some parts of California’s agriculturally rich Central Valley, winter chill has already declined by nearly 30 percent, the researchers found.
"Depending on the pace of winter chill decline, the consequences for California’s fruit and nut industries could be devastating," said Minghua Zhang, a professor of environmental and resource science at UC Davis. Also collaborating on the study were Eike Luedeling, a postdoctoral fellow in UC Davis’ Department of Plant Sciences and UC Davis graduate Evan H. Girvetz, who is now a postdoctoral research associate at the University of Washington, Seattle.
Their study will appear July 22 in the online journal PLoS One. The study is the first to map winter chill projections for all of California, which is home to nearly 3 million acres of fruit and nut trees that require chilling. The combined production value of these crops was $7.8 billion in 2007, according to the California Department of Food and Agriculture.
"Our findings suggest that California’s fruit and nut industry will need to develop new tree cultivars with reduced chilling requirements and new management strategies for breaking dormancy in years of insufficient winter chill," Luedeling said. Most fruit and nut trees from non-tropical locations avoid cold injury in the winter by losing their leaves in the fall and entering a dormant state that lasts through late fall and winter.
In order to break dormancy and resume growth, the trees must receive a certain amount of winter chill, traditionally expressed as the number of winter chilling hours between 32 and 45 degrees Fahrenheit. Each species or cultivar is assumed to have a specific chilling requirement, which needs to be fulfilled every winter.
Insufficient winter chill plays havoc with flowering time, which is particularly critical for trees such as walnuts and pistachios that depend on male and female flowering occurring at the same time to ensure pollination and a normal yield.
Next Page »


