September 2009
Monthly Archive
Posted by Glenn
1 Comment
September 30-October 1, 2009
Air Temperatures – The following maximum temperatures were recorded across the state of Hawaii Wednesday afternoon:
Lihue, Kauai – 85
Honolulu, Oahu – 88
Kaneohe, Oahu – 84
Kahului, Maui – 87
Hilo, Hawaii – 83
Kailua-kona – 86
Air Temperatures ranged between these warmest and coolest spots near sea level around the state – and on the highest mountains…at 5 p.m. Wednesday evening:
Kailua-kona – 87F
Hilo, Hawaii – 79
Haleakala Crater – 54 (near 10,000 feet on Maui)
Mauna Kea summit – 41 (near 14,000 feet on the Big Island)
Precipitation Totals – The following numbers represent the largest precipitation totals (inches) during the last 24 hours on each of the major islands, as of Wednesday afternoon:
0.28 Mount Waialaele, Kauai
0.02 Kahuku, Oahu
0.01 Molokai
0.00 Lanai
0.00 Kahoolawe
0.28 Puu Kukui, Maui
0.54 Piihonua, Big Island
Marine Winds – Here’s the latest (automatically updated) weather map showing a 1037 millibar strong high pressure system far to the northeast. Our trade wind speeds will maintain moderate to fresh levels Thursday and Friday.
Satellite and Radar Images: To view the cloud conditions we have here in Hawaii, please use the following satellite links, starting off with this Infrared Satellite Image of the islands to see all the clouds around the state during the day and night. This next image is one that gives close images of the islands only during the daytime hours, and is referred to as a Close-up visible image. This next image shows a larger view of the Pacific…giving perspective to the wider ranging cloud patterns in the Pacific Ocean. Finally, here’s a Looping IR satellite image, making viewable the clouds around the islands 24 hours a day. To help you keep track of where any showers may be around the islands, here’s the latest animated radar image.
Hawaii’s Mountains – Here’s a link to the live webcam on the summit of near 14,000 foot Mauna Kea on the Big Island of Hawaii. The tallest peak on the island of Maui is the Haleakala Crater, which is near 10,000 feet in elevation. These two webcams are available during the daylight hours here in the islands…and when there’s a big moon rising just after sunset for an hour or two! Plus, during the nights and early mornings you will be able to see stars, and the sunrise too…depending upon weather conditions.
Tropical Cyclone activity in the eastern and central Pacific – Here’s the latest weather information coming out of the National Hurricane Center, covering the eastern north Pacific. You can find the latest tropical cyclone information for the central north Pacific (where Hawaii is located) by clicking on this link to the Central Pacific Hurricane Center. Here’s a tracking map covering both the eastern and central Pacific Ocean. A satellite image, which shows the entire ocean area between Hawaii and the Mexican coast…can be found here.
Aloha Paragraphs
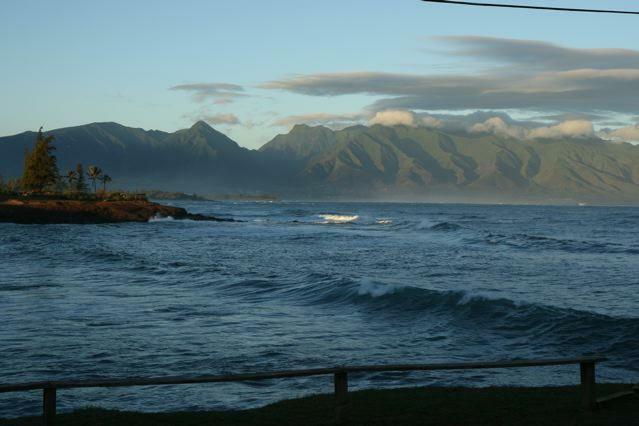
West Maui Mountains…looking from Hookipa Beach Park
The trade winds will remain active through the rest of this week, easing up some in strength later this weekend…into early next week. These trade winds are blowing generally in the moderately strong realms Wednesday evening, although as usual…locally lighter and stronger, depending upon where we’re referring to. As this weather map shows, we still have a strong and wide ranging 1037 millibar high system positioned far to the northeast of Hawaii. Those isobaric lines upstream of the islands, in terms of the trade winds, are pretty tightly spaced. This indicates that there are stronger winds blowing on the ocean surface to the east-northeast of us. This in turn causes swells to be generated in our direction, resulting in rising surf along our northeast and east facing reefs and beaches. This swell, combined with our locally generated wind swell, by the trade winds…will give rising surf conditions along on our north through east facing beaches.
Looking into the future, in terms of trade winds, they’re expected to diminish in strength later this coming weekend…remaining on the lighter side into the first part of next week. This down-winding of the trade winds are expected to happen, as an early season cold front approaches the islands from the northwest. Looking at the latest GFS model output actually shows two different cold fronts heading our way then, neither of which is expected to reach the north shore of Kauai…certainly not the first one. The approaching cold front will however, shove our trade wind producing high pressure system, along with its associated ridge…eastward. There’s still a question about exactly what the trade winds will do, but most likely they will just weaken, rather than completely fade away. There had been an idea that we could see light southeast winds, or even light south to southwest Kona breezes filtering into our area…which seems less likely now.
The latest thought remains in place that we could see some increase in showers Sunday into early next week. These showers won’t fall from the clouds identified with the cold front, but rather from clouds pulled up over the islands from the east or southeast. The direction that these clouds eventually arrive from will have a bearing upon where they fall. If the trade winds remain intact as expected, the majority of this precipitation would land on the windward sides. If on the other hand, the breezes are south of east, they could reach into some of the leeward areas as well. The question remains about this, and it may take another day or so before the computer forecast models sort this out. There’s still a question about the second cold front as well, although considering this early date in the autumn season, it would seem reasonable…that it would skid to a stop, before arriving as well. Back to the present, the rainfall will remain limited at best through Saturday. As this satellite image shows, we have a streak of high cirrus clouds moving over the island chain this evening.
Extra: Post-human Earth – How the planet will recover from us
Interesting: U.S. seismologists have found evidence that the massive 2004 earthquake that triggered killer tsunamis throughout the Indian Ocean weakened at least a portion of California’s famed San Andreas Fault. The results, which appear this week in the journal Nature, suggest that the Earth’s largest earthquakes can weaken fault zones worldwide and may trigger periods of increased global seismic activity.
"An unusually high number of magnitude 8 earthquakes occurred worldwide in 2005 and 2006," said study co-author Fenglin Niu, associate professor of Earth science at Rice University. "There has been speculation that these were somehow triggered by the Sumatran-Andaman earthquake that occurred on Dec. 26, 2004, but this is the first direct evidence that the quake could change fault strength of a fault remotely."
Earthquakes are caused when a fault fails, either because of the buildup of stress or because of the weakening of the fault. The latter is more difficult to measure. The magnitude 9 earthquake in 2004 occurred beneath the ocean west of Sumatra and was the second-largest quake ever measured by seismograph. The temblor spawned tsunamis as large as 100 feet that killed an estimated 230,000, mostly in Indonesia, Sri Lanka, India and Thailand.
Interesting2: One day after a powerful earthquake triggered a devastating tsunami, another earthquake rumbled in Indonesia, leaving dozens dead and injured, and RSOE reports that thousands are buried under debris. The earthquake, which hit this morning EDT (around 5 p.m. local time), had a preliminary magnitude of 7.6, and its epicenter was recorded about 30 miles west-northwest of Padang, which is on the Indonesian Island of Sumatra.
This morning’s earthquake struck south of where the devastating Sumatra Quake from Christmas Day 2004 was centered. No tsunami has been detected, but the fact that an earthquake of this intensity could generate one has prompted a Tsunami Watch for Indonesia, India, Thailand and Malaysia. A 7.6-magnitude earthquake has the potential to produce a destructive tsunami along coasts up to 650 miles from its epicenter.
Smaller sea level changes and strong currents may be felt much farther away, similar to what occurred along the West Coast from Tuesday’s earthquake. Nothing more than spotty showers through Friday will interfere with rescue and cleanup efforts across the islands of Samoa and American Samoa in the wake of Tuesday’s deadly tsunami. CNN reports at least 111 dead as of 2 p.m. EDT. but that could rise as rescuers reach other devastated areas.
Tuesday’s tsunami was generated by a powerful 8.0-magnitude earthquake that violently shook the ground about 125 miles south-southwest of Apia, Samoa. The quake struck just before 2 p.m. EDT, and had a focal depth of 11 miles, which was recalculated from the earlier 22 mile depth. Several gauges detected the tsunami, which measured 5.1 feet high at Pago Pago, American Samoa.
A wave at Apia Upolu, Samoa, registered 2.3-feet high. In the wake of the earthquake and tsunami, the streets and fields of Pago Pago were littered with ocean debris, mud, overturned cars and boats. Several buildings in the city have been flattened. The weather should cooperate for those participating in rescue and cleanup efforts through Friday. There will be a threat of isolated showers each day with highs in the mid-80s, which is seasonable for the islands.
Showers will likely become more numerous over the weekend, but heavy rainfall is not expected. As the tsunami battered these islands, tsunami watches, warnings and advisories were posted for other parts of the Pacific Ocean. This included Hawaii and the coasts of California, Oregon and Washington. Arena Cove, Calif., recorded a 1.1-foot wave earlier today.
Interesting3: The U.S. and the European Union recently settled one of their longest-running trade disputes: over beef. Under the deal, the EU agreed to quadruple import quotas for hormone-free U.S. beef, but it still won’t import hormone-treated American beef, because many Europeans consider it unhealthy. Farmer Michel Baudot, who raises cattle in France’s Burgundy region, says the two cattle industries are run differently: One focuses on profit and the other on quality.
For seven generations, his family has bread the stocky white Charolais cows indigenous to the area. In the summer, his herd of 600 cattle grazes freely on his 1,500-acre farm. In winter, the animals are sheltered in his barn, where they eat hay and grain. They live on Baudot’s farm until they are slaughtered. Every aspect of each cow’s life is meticulously followed. Baudot says European consumers demand this.
Interesting4: Farmers in central Kenya are cutting down water-hungry eucalyptus tree species growing near water sources as a government directive aiming to save water takes effect. Environment minister, John Michuki, issued the directive three months ago in an attempt to lessen the impact of the drought that is ravaging the country.
Eucalyptus has been popular with farmers because it grows fast and provides ample stocks of timber and firewood. But it is also a danger to water supplies (see Strategic tree planting could save water in dry areas). Wangari Maathai, Kenyan Nobel Peace Prize winner and environmentalist, has recently spoken out about the threat, saying that the trees have been "over-promoted for commercial reasons" and threaten biodiversity.
Now, eucalyptus trees growing less than 30 meters from rivers, streams, wells and other water sources are being cut down. Already, farmers in central Kenya have felled virtually all trees growing near water sources. "We agree that eucalyptus growing near water sources has contributed to water sources drying up and that is why we are removing the trees," says Joseck Gatitu, a farmer in the Kamune area of central Kenya, who has cut down 15 trees near a stream that has nearly dried up.
James Gitonga, a senior officer at the Kenya Forest Service, says that although eucalyptus trees were a source of income to farmers, the recent rapid planting of Eucalyptus grandis and Eucalyptus camaldulensis, two fast growing species introduced to Kenya from South Africa seven years ago, was a threat to the environment.
"The trees have been planted in great numbers, including near rivers, swamps and other catchments, and being huge water consumers they have greatly contributed to depletion of water, particularly during the current drought," he says. James Gathage, a forestry consultant trees farmers can cultivate without putting water supplies at risk.
He adds: "Farmers should be encouraged to plant more Grevillea instead, which is an agro-forestry tree with many commercial benefits, including timber, firewood and fodder." Interesting5: There has been good and bad news this week on the world’s food prospects. At a major food summit in Rome, Italy, on 12 October, the UN’s Food and Agriculture Organization will show that farming output in sub-Saharan Africa grew by 3.5 per cent last year.
Following decades of decline, this promises the rosiest outlook for many years. The FAO estimates that the region has 700 million hectares of unoccupied land fit for farming. For example, the Guinea Savannah region, an area twice as large as that currently planted with wheat worldwide, offers "a huge production potential", it says. At present, only 10 per cent of it is farmed.
But further ahead, child malnutrition worldwide will increase by 20 per cent by 2050 as crop yields fall through climate change, warns a report from the International Food Policy Research Institute in Washington DC. Sub-Saharan Africa and south-east Asia will be worst hit, as rising temperatures and dwindling water supplies drive down wheat and rice yields by 30 and 15 per cent respectively.
"There will be 25 million more malnourished children in 2050 than if climate change hadn’t happened," says study author Gerald Nelson. Keith Wiebe, who led the FAO study, accepts that the two reports "differ in tone", but says they agree on the investments needed to improve agriculture in Africa and make it more resilient to climate change.
Interesting5: There has been good and bad news this week on the world’s food prospects. At a major food summit in Rome, Italy, on 12 October, the UN’s Food and Agriculture Organization will show that farming output in sub-Saharan Africa grew by 3.5 per cent last year. Following decades of decline, this promises the rosiest outlook for many years. The FAO estimates that the region has 700 million hectares of unoccupied land fit for farming.
For example, the Guinea Savannah region, an area twice as large as that currently planted with wheat worldwide, offers "a huge production potential", it says. At present, only 10 per cent of it is farmed. But further ahead, child malnutrition worldwide will increase by 20 per cent by 2050 as crop yields fall through climate change, warns a report from the International Food Policy Research Institute in Washington DC.
Sub-Saharan Africa and south-east Asia will be worst hit, as rising temperatures and dwindling water supplies drive down wheat and rice yields by 30 and 15 per cent respectively. "There will be 25 million more malnourished children in 2050 than if climate change hadn’t happened," says study author Gerald Nelson. Keith Wiebe, who led the FAO study, accepts that the two reports "differ in tone", but says they agree on the investments needed to improve agriculture in Africa and make it more resilient to climate change.
Posted by Glenn
[2] Comments
September 29-30, 2009
Air Temperatures – The following maximum temperatures were recorded across the state of Hawaii Tuesday afternoon:
Lihue, Kauai – 85
Honolulu, Oahu – 90
Kaneohe, Oahu – 85
Kahului, Maui – 87
Hilo, Hawaii – 81
Kailua-kona – 88
Air Temperatures ranged between these warmest and coolest spots near sea level around the state – and on the highest mountains…at 5 p.m. Tuesday evening:
Port Allen, Kauai – 87F
Hilo, Hawaii – 78
Haleakala Crater – 58 (near 10,000 feet on Maui)
Mauna Kea summit – 51 (near 14,000 feet on the Big Island)
Precipitation Totals – The following numbers represent the largest precipitation totals (inches) during the last 24 hours on each of the major islands, as of Tuesday afternoon:
0.42 Mount Waialaele, Kauai
0.27 Poamoho 2, Oahu
0.01 Molokai
0.00 Lanai
0.00 Kahoolawe
0.34 West Wailuaiki, Maui
0.44 Mountain View, Big Island
Marine Winds – Here’s the latest (automatically updated) weather map showing a 1037 millibar strong high pressure system far to the north-northeast. Our trade wind speeds will maintain moderate to fresh levels Tuesday and Wednesday.
Satellite and Radar Images: To view the cloud conditions we have here in Hawaii, please use the following satellite links, starting off with this Infrared Satellite Image of the islands to see all the clouds around the state during the day and night. This next image is one that gives close images of the islands only during the daytime hours, and is referred to as a Close-up visible image. This next image shows a larger view of the Pacific…giving perspective to the wider ranging cloud patterns in the Pacific Ocean. Finally, here’s a Looping IR satellite image, making viewable the clouds around the islands 24 hours a day. To help you keep track of where any showers may be around the islands, here’s the latest animated radar image.
Hawaii’s Mountains – Here’s a link to the live webcam on the summit of near 14,000 foot Mauna Kea on the Big Island of Hawaii. The tallest peak on the island of Maui is the Haleakala Crater, which is near 10,000 feet in elevation. These two webcams are available during the daylight hours here in the islands…and when there’s a big moon rising just after sunset for an hour or two! Plus, during the nights and early mornings you will be able to see stars, and the sunrise too…depending upon weather conditions.
Tropical Cyclone activity in the eastern and central Pacific – Here’s the latest weather information coming out of the National Hurricane Center, covering the eastern north Pacific. You can find the latest tropical cyclone information for the central north Pacific (where Hawaii is located) by clicking on this link to the Central Pacific Hurricane Center. Here’s a tracking map covering both the eastern and central Pacific Ocean. A satellite image, which shows the entire ocean area between Hawaii and the Mexican coast…can be found here.
Aloha Paragraphs

The beautiful south Maui coast
The gusty trade winds will continue through these last few hours of September, then on into the first several days of October. This weather map shows a very large 1036 millibar high pressure cell far to the north-northeast of the Hawaiian Islands Tuesday evening. The presence of this robust high pressure cell will keep moderate trade winds blowing this week…locally a bit stronger and gusty. The NWS is keeping the small craft wind advisory in those windiest areas from Molokai down through the Big Island. If the trade winds increase another notch going forward, we could see this advisory extended up through the other major channels with time. The NWS office in Honolulu has issued a red flag warning, which means that the danger of fire is critical now into early Wednesday evening. (NWS: Gusty trade winds along with low relative humidity values will create hazardous fire weather conditions in the dry leeward locations through the rest of today and again on Wednesday.)
The latest computer forecast models show a cold front approaching the islands later this weekend into early next week…which could interrupt our trade winds. Depending upon just how close this cold front gets to Kauai, will help determine what kind of response we’ll see locally…in terms of wind. If the cold front stops short of Kauai, we’d likely see our ridge get pushed down close to the islands, or even over the Kauai end of the island chain…with light southeast winds setting in. If on the other hand, it got even closer, we could see autumn’s first Kona winds here in Hawaii, bringing the air flow in from the south and southwest directions. As we know, when we find southeast winds blowing, they are infamous for carrying volcanic haze from the Big Island vents…up over the rest of the island chain. It seems more likely at this point, considering the early time frame in relation to autumn…that we would find the cold front stopping short of reaching us. This however would put us into a convective weather pattern, with the light winds and the daytime heating, causing sultry conditions, with a possible early season vog event.
As is often the case, the trade winds will at times carry a few passing showers to the windward sides, although our overlying atmosphere is dry and stable…which will keep us generally high and dry through mid-week. The computer forecast models continue to point out a chance of some modest increase in windward showers during the second half of the work week. This will leave pretty typical weather conditions in place across the state until then, with generally dry conditions along the leeward sides. As we move into early next week, with the possible approach of this impending early October cold front, we could see an increase in showers then. It’s still up in the air whether the front would actually arrive or not…nonetheless, we could at least see afternoon convective showers falling over the leeward slopes then. It may take another day or three before we have a better feel for exactly what will take place early next week.
It’s early Tuesday evening here in Kihei, Maui, as I begin writing this last paragraph of today’s narrative. Today was a big day in the world of earthquakes and tsunmai’s. A huge 8.3 earthquake, on the richter scale, occurred in the western Pacific Ocean…near American Samoa. There have been reports of tsunami related damages and deaths in that area. Here in the islands, we saw small, tsunami generated waves move through, with the two largest anywhere in the state, occurring here on Maui, reaching 1.2 feet…and on the north shore of Oahu, with a 1.5 foot surge. Meanwhile, and if that wasn’t enough on its own, I’ve been tracking four tropical cyclones over in the western Pacific as well. One called typhoon Ketsana brought very damaging floods to the Phillipines, and moved on to Vietnam, where it went ashore early this morning with more devastating weather conditions. There are three other tropical cyclones, named 18W, Parma, and Melor, which continue to churn the waters far to the west of our Hawaiian Islands.
~~~ I’m about ready to leave Kihei, for the drive back upcountry to Kula. Looking out the window before I jump in my car, I see mostly clear skies out there, and the trade winds are blowing as usual. As I mention everyday, I’m very much looking forward to getting away from this computer screen, and out into the real world again! I’ll be back online early Wednesday morning with your next new weather narrative. I hope you have a great Tuesday night until then! Aloha for now…Glenn.
Interesting: Since May 2009, the tropical Pacific Ocean has switched from a cool pattern of ocean circulation known as La Niña to her warmer sibling, El Niño. This cyclical warming of the ocean waters in the central and eastern tropical Pacific generally occurs every three to seven years, and is linked with changes in the strength of the trade winds.
El Niño can affect weather worldwide, including the Atlantic hurricane season, Asian monsoon season and northern hemisphere winter storm season. But while scientists agree that El Niño is back, there’s less consensus about its future strength.
Since May 2009, the tropical Pacific Ocean has switched from a cool pattern of ocean circulation known as La Niña to her warmer sibling, El Niño. This cyclical warming of the ocean waters in the central and eastern tropical Pacific generally occurs every three to seven years, and is linked with changes in the strength of the trade winds.
El Niño can affect weather worldwide, including the Atlantic hurricane season, Asian monsoon season and northern hemisphere winter storm season. But while scientists agree that El Niño is back, there’s less consensus about its future strength.
Interesting2: The Great Depression had a silver lining: During that hard time, U.S. life expectancy actually increased by 6.2 years, according to a University of Michigan study published in the current issue of the Proceedings of the National Academy of Sciences. Life expectancy rose from 57.1 in 1929 to 63.3 years in 1932, according to the analysis by U-M researchers José A. Tapia Granados and Ana Diez Roux. The increase occurred for both men and women, and for whites and non-whites.
"The finding is strong and counterintuitive," said Tapia Granados, the lead author of the study and a researcher at the U-M Institute for Social Research (ISR). "Most people assume that periods of high unemployment are harmful to health."
For the study, researchers used historical life expectancy and mortality data to examine associations between economic growth and population health for 1920 to 1940. They found that while population health generally improved during the four years of the Great Depression and during recessions in 1921 and 1938, mortality increased and life expectancy declined during periods of strong economic expansion, such as 1923, 1926, 1929, and 1936-1937.
The researchers analyzed age-specific mortality rates and rates due to six causes of death that composed about two-thirds of total mortality in the 1930s: cardiovascular and renal diseases, cancer, influenza and pneumonia, tuberculosis, motor vehicle traffic injuries, and suicide. The association between improving health and economic slowdowns was true for all ages, and for every major cause of death except one: suicide.
Interesting3: Lowers blood pressure, encourages exercise, improves psychological health— these may sound like the effects of a miracle drug, but they are actually among the benefits of owning a four-legged, furry pet. This fall, the University of Missouri College of Veterinary Medicine Research Center for Human-Animal Interaction (ReCHAI) will explore the many ways animals benefit people of all ages during the International Society for Anthrozoology and Human-Animal Interaction Conference in Kansas City, Mo., on October 20-25.
“Research in this field is providing new evidence on the positive impact pets have in our lives,” said Rebecca Johnson, associate professor in the MU Sinclair School of Nursing, the College of Veterinary Medicine and director of ReCHAI. “This conference will provide a unique opportunity to connect international experts working in human-animal interaction research with those already working in the health and veterinary medicine fields. A wonderful array of presentations will show how beneficial animals can be in the lives of children, families and older adults.”
Interesting4: Like neighborhood coffee shops and independent movie theaters around the United States, unusual varieties of frogs are rapidly disappearing from rainforests in Central America. A fungal infection seems to be hitting those rare species of frogs harder than common ones, found a new study, leading to local extinctions and a homogenized version of nature where everything is more similar than it used to be. The result is both a less interesting world aesthetically and a less resilient one biologically. "Everyone knew that amphibian declines were really bad," said ecologist Kevin Smith, of Washington University in St. Louis. "But it looks like its worse than we actually thought."
Interesting5: Planning a trip to Mars? Take plenty of shielding. According to sensors on NASA’s ACE (Advanced Composition Explorer) spacecraft, galactic cosmic rays have just hit a Space Age high. "In 2009, cosmic ray intensities have increased 19% beyond anything we’ve seen in the past 50 years," says Richard Mewaldt of Caltech.
"The increase is significant, and it could mean we need to re-think how much radiation shielding astronauts take with them on deep-space missions." The cause of the surge is solar minimum, a deep lull in solar activity that began around 2007 and continues today.
Researchers have long known that cosmic rays go up when solar activity goes down. Right now solar activity is as weak as it has been in modern times, setting the stage for what Mewaldt calls "a perfect storm of cosmic rays."
"We’re experiencing the deepest solar minimum in nearly a century," says Dean Pesnell of the Goddard Space Flight Center, "so it is no surprise that cosmic rays are at record levels for the Space Age." Galactic cosmic rays come from outside the solar system.
They are subatomic particles–mainly protons but also some heavy nuclei–accelerated to almost light speed by distant supernova explosions. Cosmic rays cause "air showers" of secondary particles when they hit Earth’s atmosphere; they pose a health hazard to astronauts; and a single cosmic ray can disable a satellite if it hits an unlucky integrated circuit.
The sun’s magnetic field is our first line of defense against these highly-charged, energetic particles. The entire solar system from Mercury to Pluto and beyond is surrounded by a bubble of solar magnetism called "the heliosphere."
It springs from the sun’s inner magnetic dynamo and is inflated to gargantuan proportions by the solar wind. When a cosmic ray tries to enter the solar system, it must fight through the heliosphere’s outer layers; and if it makes it inside, there is a thicket of magnetic fields waiting to scatter and deflect the intruder. "At times of low solar activity, this natural shielding is weakened, and more cosmic rays are able to reach the inner solar system," explains Pesnell.
Interesting6: More of the fertilizers and pesticides used to grow corn would find their way into nearby water sources if ethanol demands lead to planting more acres in corn, according to a Purdue University study. The study of Indiana water sources found that those near fields that practice continuous-corn rotations had higher levels of nitrogen, fungicides and phosphorous than corn-soybean rotations.
Results of the study by Indrajeet Chaubey, an associate professor of agricultural and biological engineering, and Bernard Engel, a professor and head of agricultural and biological engineering, were published in the early online version of The Journal of Environmental Engineering. "When you move from corn-soybean rotations to continuous corn, the sediment losses will be much greater," Chaubey said.
"Increased sediment losses allow more fungicide and phosphorous to get into the water because they move with sediment." Nitrogen and fungicides are more heavily used in corn crops than soybeans, increasing the amounts found in the soil of continuous-corn fields.
Sediment losses become more prevalent because tilling is often required in continuous-corn fields, whereas corn-soybean rotations can more easily be no-till fields, Engel said. "The common practice is there is a lot of tillage to put corn back on top of corn," Engel said.
"Any time we see changes in the landscape, there is a potential to see changes in water quality." Chaubey said there was no significant change in the amount of atrazine detected in water near fields that changed to continuous-corn rotations.
The commonly used pesticide sticks to plant material and degrades in sunlight, keeping it from reaching water through runoff or sediment. U.S. Department of Agriculture data has shown that corn acreage has increased with the demand for ethanol, with 93 million acres in 2007, an increase of 12.1 million acres that year.
Posted by Glenn
[2] Comments
September 28-29, 2009
Air Temperatures – The following maximum temperatures were recorded across the state of Hawaii Monday afternoon:
Lihue, Kauai – 84
Honolulu, Oahu 89
Kaneohe, Oahu – 84
Kahului, Maui – 86
Hilo, Hawaii – 85
Kailua-kona – 88
Air Temperatures ranged between these warmest and coolest spots near sea level around the state – and on the highest mountains…at 5 p.m. Monday evening:
Barking Sands, Kauai – 86F
Hilo, Hawaii – 78
Haleakala Crater – 61 (near 10,000 feet on Maui)
Mauna Kea summit – 48 (near 14,000 feet on the Big Island)
Precipitation Totals – The following numbers represent the largest precipitation totals (inches) during the last 24 hours on each of the major islands, as of Monday afternoon:
0.35 Mount Waialaele, Kauai
0.08 South Fork Kaukonahua, Oahu
0.03 Molokai
0.00 Lanai
0.00 Kahoolawe
0.38 Puu Kukui, Maui
0.17 Piihonua, Big Island
Marine Winds – Here’s the latest (automatically updated) weather map showing a 1040 millibar strong high pressure system far to the north. Our trade wind speeds will maintain moderate to fresh levels Tuesday and Wednesday…locally stronger in those typically windiest marine zones around Maui County and the Big Island.
Satellite and Radar Images: To view the cloud conditions we have here in Hawaii, please use the following satellite links, starting off with this Infrared Satellite Image of the islands to see all the clouds around the state during the day and night. This next image is one that gives close images of the islands only during the daytime hours, and is referred to as a Close-up visible image. This next image shows a larger view of the Pacific…giving perspective to the wider ranging cloud patterns in the Pacific Ocean. Finally, here’s a Looping IR satellite image, making viewable the clouds around the islands 24 hours a day. To help you keep track of where any showers may be around the islands, here’s the latest animated radar image.
Hawaii’s Mountains – Here’s a link to the live webcam on the summit of near 14,000 foot Mauna Kea on the Big Island of Hawaii. The tallest peak on the island of Maui is the Haleakala Crater, which is near 10,000 feet in elevation. These two webcams are available during the daylight hours here in the islands…and when there’s a big moon rising just after sunset for an hour or two! Plus, during the nights and early mornings you will be able to see stars, and the sunrise too…depending upon weather conditions.
Tropical Cyclone activity in the eastern and central Pacific – Here’s the latest weather information coming out of the National Hurricane Center, covering the eastern north Pacific. You can find the latest tropical cyclone information for the central north Pacific (where Hawaii is located) by clicking on this link to the Central Pacific Hurricane Center. Here’s a tracking map covering both the eastern and central Pacific Ocean. A satellite image, which shows the entire ocean area between Hawaii and the Mexican coast…can be found here.
Aloha Paragraphs

Green Sea Turtle…coming into a Hawaiian beach
The blustery trade winds will remain the most notable weather influence here in the Hawaiian Islands this week. This weather map shows a strong 1040 millibar high pressure cell far to the north of the Hawaiian Islands Monday evening. The presence of this robust high pressure cell will keep moderate to strong trade winds blowing this week. The NWS is keeping the small craft wind advisory in those windiest areas from Molokai down through the Big Island. As the trade winds increase another notch going forward, we could see that advisory extended up through the other major channels…later this week.
Despite the off and on passing showers along the windward sides, our weather will remain generally on the dry side through the next several days. The computer forecast models continue to point out a chance of some increase in windward showers towards the end of the week. The source of these showers will at least partly be the remnant moisture associated with former tropical cyclone Nora…which was active in the eastern Pacific last week. This will leave pretty typical weather conditions in place across the state until then, with generally dry conditions along the leeward sides. Air temperatures will remain fairly seasonable, with maximum’s reaching well up into the 80F’s…dropping back into the 70’s at night near sea level.
It’s early Monday evening here in Kihei, Maui, as I begin writing this last paragraph of today’s narrative. As noted above, our upcoming week will be filled with gusty trade winds, a few windward showers, and dry conditions along our leeward sides. These locally strong and gusty trade winds, in combination with the dry conditions, could lead to fires, so please be careful. The NWS could issue a red flag warning along these south and west facing leeward areas at various times this week. Meanwhile, the larger surf we saw along our north and west facing beaches recently, is now just about gone. We may see another larger than normal swell, this time coming in from the northeast direction later this week. ~~~ Looking out the window here in Kihei, before I head upcountry to Kula, I see lots of clear blue skies out there, along with those usual partly cloudy conditions that often prevail during a trade wind episode like this. I’ve been noticing that the sun is setting earlier these days, which has become more apparent recently. ~~~ I’ll be back online again early Tuesday morning, at which point I’ll have your next new weather narrative waiting for you. I hope you have a great Monday night until then! Aloha for now…Glenn.
Interesting: Australian researchers have discovered a huge number of new species of invertebrate animals living in underground water, caves and "micro-caverns" amid the harsh conditions of the Australian outback. A national team of 18 researchers has discovered 850 new species of invertebrates, which include various insects, small crustaceans, spiders, worms and many others.
The team – led by Professor Andy Austin (University of Adelaide), Dr Steve Cooper (South Australian Museum) and Dr Bill Humphreys (Western Australian Museum) – has conducted a comprehensive four-year survey of underground water, caves and micro-caverns across arid and semi-arid Australia.
"What we’ve found is that you don’t have to go searching in the depths of the ocean to discover new species of invertebrate animals – you just have to look in your own ‘back yard’," says Professor Austin from the Australian Center for Evolutionary Biology & Biodiversity at the University of Adelaide.
"Our research has revealed whole communities of invertebrate animals that were previously unknown just a few years ago. What we have discovered is a completely new component to Australia’s biodiversity. It is a huge discovery and it is only about one fifth of the number of new species we believe exist underground in the Australian outback."
Only half of the species discovered have so far been named. Generically, the animals found in underground water are known as "stygofauna" and those from caves and micro-caverns are known as "troglofauna". Professor Austin says the team has a theory as to why so many new species have been hidden away underground and in caves.
"Essentially what we are seeing is the result of past climate change. Central and southern Australia was a much wetter place 15 million years ago when there was a flourishing diversity of invertebrate fauna living on the surface. But the continent became drier, a process that last until about 1-2 million years ago, resulting in our current arid environment. Species took refuge in isolated favorable habitats, such as in underground waters and micro-caverns, where they survived and evolved in isolation from each other.
Interesting2: Europe, particularly northern Europe, is far more environmentally conscious than the United States, despite Americans’ sincere and passionate resolution to be green. Per capita CO2 emissions in the U.S. were 19.78 tons according to the Union of Concerned Scientists, which used 2006 data, compared to 9.6 tons in the U.K., 8.05 tons in Italy, and 6.6 tons in France.
Why have Americans made so little headway on an issue that so many of us feel so strongly about? As a U.S. journalist traveling around Europe for the last few years reporting on the environment, I’ve thought a lot about this paradox.
There is a fair bit of social pressure to behave in an environmentally responsible manner in places like Sweden, where such behavior is now simply part of the social contract, like stopping at a stop sign or standing in line to buy a ticket.
But more important, perhaps, Europe is constructed in a way that it’s pretty easy to live green. You have to be rich and self-absorbed, as well as environmentally reckless and impervious to social pressure, not to take the Arlanda Express.
Interesting3: Remember the smell of burning fall leaves wafting through the air? Good memories, indeed, but best that they remain just memories. Burning leaves is bad news. This practice is now illegal — or at least highly discouraged — in most areas. Burning leaves releases airborne particulates like dust and soot, mold, and other allergens that were tamped down with rain and decomposition.
According to the environmental Protection Agency (EPA): "the total health, financial, and environmental costs of leaf-burning can be quite high. These costs include higher incidences of health problems and increased heath care costs; forest fires and property loss and need for increased fire protection; and the clean-up costs associated with soiling of personal property."
So basically, burning leaves is an environmental no-no. Leaf blowers, especially gas powered ones, are also a bad idea, at least if you care at all about the environment, your pocketbook or your neighbors’ sanity.
Nearly 2.5 million of those gas-guzzling gadgets will be sold this year, according to U.S News, and in a single year they will emit as much pollution as 80 cars. Speaking of pollution, the noise pollution created by leaf-blowers has caused many communities to ban them with noise levels exceeding 70 decibels.
Leaf-blowers can be as bad for your health as they are for the environment. They circulate mold, allergens and particulate matter that irritate the lungs — especially for those who suffer from asthma. A better solution is the rake and mulcher.
By turning your leaves into mulch and spreading them over your lawn and garden you can improve the soil quality, fertilize your lawn and protect your garden from the upcoming frigid winter weather. There are a variety of green mulchers to choose from as well. Mulching fallen leaves is the greenest and healthiest way to get rid of fall foliage while you rake in the benefits of your new organic mulch.
Interesting4: A newly released paper from NASA shows something astronomers have long postulated, but never observed. Astronomers witnessed odd behavior around a young star. Something, perhaps another star or a planet, appears to be pushing a clump of planet-forming material around. The observations, made with NASA’s Spitzer Space Telescope, offer a rare look into the early stages of planet formation.
Planets form out of swirling disks of gas and dust. Spitzer observed infrared light coming from one such disk around a young star, called LRLL 31, over a period of five months. To the astronomers’ surprise, the light varied in unexpected ways, and in as little time as one week. Planets take millions of years to form, so it’s rare to see anything change on time scales we humans can perceive.
One possible explanation is that a close companion to the star — either a star or a developing planet — could be shoving planet-forming material together, causing its thickness to vary as it spins around the star.
"We don’t know if planets have formed, or will form, but we are gaining a better understanding of the properties and dynamics of the fine dust that could either become, or indirectly shape, a planet," said James Muzerolle of the Space Telescope Science Institute, Baltimore, Md. Muzerolle is first author of a paper accepted for publication in the Astrophysical Journal Letters.
"This is a unique, real-time glimpse into the lengthy process of building planets." One theory of planet formation suggests that planets start out as dusty grains swirling around a star in a disk. They slowly bulk up in size, collecting more and more mass like sticky snow.
As the planets get bigger and bigger, they carve out gaps in the dust, until a so-called transitional disk takes shape with a large doughnut-like hole at its center. Over time, this disk fades and a new type of disk emerges, made up of debris from collisions between planets, asteroids and comets.
Ultimately, a more settled, mature solar system like our own forms. Before Spitzer was launched in 2003, only a few transitional disks with gaps or holes were known. With Spitzer’s improved infrared vision, dozens have now been found.
The space telescope sensed the warm glow of the disks and indirectly mapped out their structures. NASA’s Jet Propulsion Laboratory, Pasadena, Calif., manages the Spitzer Space Telescope mission for NASA’s Science Mission Directorate, Washington. Science operations are conducted at the Spitzer Science Center at the California Institute of Technology, also in Pasadena. Caltech manages JPL for NASA.
Interesting5: The federal government is considering taking the humpback whale off the endangered species list in response to data showing the population of the massive marine mammal has been steadily growing in recent decades. Known for their acrobatic leaps from the sea and complex singing patterns, humpback whales were nearly hunted to extinction for their oil and meat by industrial-sized whaling ships well through the middle of the 20th century.
But the species has been bouncing back since an international ban on their commercial whaling in 1966. "Humpbacks by and large are an example of a species that in most places seems to be doing very well, despite our earlier efforts to exterminate them," said Phillip Clapham, a senior whale biologist with the National Oceanic and Atmospheric Administration (NOAA).
The government is required by law to review the endangered species status of an animal or plant if it receives "significant new information." The National Marine Fisheries Service, a NOAA agency, received results last year from an extensive study showing that the North Pacific humpback population has been growing 4 to 7 percent a year in recent decades.
Public comment is being accepted until Oct. 13 on the upcoming review, which is expected to take less than a year. It’s the first review for humpbacks since 1999. A panel of scientists will then study the data and produce a scientific report on their analysis in late spring or early summer. It’s unclear what the decision on delisting the humpback will be.
"I don’t know where the humpback people are going to come out," said David Cottingham, who heads the marine mammal and sea turtle conservation division at the Fisheries Service. "It would be premature to talk about it." Some environmental groups are already opposing the possibility of a delisting.
Miyoko Sakashita, the ocean programs director at the Center for Biological Diversity, said that ongoing climate change and ocean acidification are emerging threats that may hurt humpback whales. "Ocean conditions are changing so rapidly right now that it would probably be hasty to delist the humpbacks," Sakashita said.
Interesting6: Savvy business sometimes requires only a flip of a lid. When Stonyfield Farm switched from plastic to foil lids six years ago, the organic yogurt company avoided 16 percent of the energy costs associated with producing its containers. Similar savings have been discovered throughout Stonyfield’s manufacturing, transportation, and packaging divisions since the company began measuring its carbon footprint in the early 1990s, according to Chairman Gary Hirshberg.
"Our carbon footprint is everywhere we look. It’s our transportation. It’s our waste," Hirshberg told a conference of business executives in Boston, Massachusetts, earlier this month. "We’re sending our money into the dark sky. That’s clearly dollars to be reclaimed." For many companies, sustainability improvements such as energy and water efficiency were at first reactions to public criticism.
Nowadays, as rising energy costs, water scarcity, and climate changed threaten the affordability and availability of global inputs, corporations are recognizing that a more sustainable product has a better chance of remaining competitive in a resource-constrained world. But a product’s environmental or economic sustainability rarely depends on the actions of a single company.
As a result, many corporations are pressuring their suppliers to become more efficient as well. "Everyone is scrutinizing for higher sustainability efforts because companies are asking for it," said Paul Baier, a vice president with the consulting firm Groom Energy. "Clearly, it’s become mainstream business." Walmart represents the most dramatic example of efforts to "green" corporate supply chains.
The world’s largest retailer announced in July that many of its suppliers would need to assess and report on the environmental and social sustainability of their products. The responses may eventually be combined into an index of a product’s lifecycle impact, the company said.
Since Walmart notified its suppliers about the request – asking whether the companies had evaluated environmental impacts such as greenhouse gas emissions, water use, and product recyclability – several suppliers have increased their investments in measuring carbon emissions and energy efficiency, Baier said.
The motivation for corporations like Walmart to improve the efficiency of supplier industries is in part financial. Improved efficiency can be an important component of business deals between suppliers and retailers. Depending on the agreement, the avoided energy costs are shared between the two companies. Both supplier and buyer increase profits while the overall supply chain becomes more efficient.
Posted by Glenn
No Comments
September 27-28, 2009
Air Temperatures – The following maximum temperatures were recorded across the state of Hawaii Sunday afternoon:
Lihue, Kauai – 85
Honolulu, Oahu 89
Kaneohe, Oahu – 84
Kahului, Maui – 86
Hilo, Hawaii – 83
Kailua-kona – 86
Air Temperatures ranged between these warmest and coolest spots near sea level around the state – and on the highest mountains…at 3 p.m. Sunday afternoon:
Honolulu, Oahu – 88F
Hilo, Hawaii – 80
Haleakala Crater – 59 (near 10,000 feet on Maui)
Mauna Kea summit – 52 (near 14,000 feet on the Big Island)
Precipitation Totals – The following numbers represent the largest precipitation totals (inches) during the last 24 hours on each of the major islands, as of Sunday afternoon:
0.15 Mount Waialaele, Kauai
0.35 Poamoho 2, Oahu
0.03 Molokai
0.00 Lanai
0.00 Kahoolawe
1.14 Puu Kukui, Maui
0.73 Glenwood, Big Island
Marine Winds – Here’s the latest (automatically updated) weather map showing robust high pressure systems far to the north and northeast. Our trade wind speeds will maintain moderate to fresh levels Monday and Tuesday…locally stronger in those typically windiest marine zones around Maui County and the Big Island.
Satellite and Radar Images: To view the cloud conditions we have here in Hawaii, please use the following satellite links, starting off with this Infrared Satellite Image of the islands to see all the clouds around the state during the day and night. This next image is one that gives close images of the islands only during the daytime hours, and is referred to as a Close-up visible image. This next image shows a larger view of the Pacific…giving perspective to the wider ranging cloud patterns in the Pacific Ocean. Finally, here’s a Looping IR satellite image, making viewable the clouds around the islands 24 hours a day. To help you keep track of where any showers may be around the islands, here’s the latest animated radar image.
Hawaii’s Mountains – Here’s a link to the live webcam on the summit of near 14,000 foot Mauna Kea on the Big Island of Hawaii. The tallest peak on the island of Maui is the Haleakala Crater, which is near 10,000 feet in elevation. These two webcams are available during the daylight hours here in the islands…and when there’s a big moon rising just after sunset for an hour or two! Plus, during the nights and early mornings you will be able to see stars, and the sunrise too…depending upon weather conditions.
Tropical Cyclone activity in the eastern and central Pacific – Here’s the latest weather information coming out of the National Hurricane Center, covering the eastern north Pacific. You can find the latest tropical cyclone information for the central north Pacific (where Hawaii is located) by clicking on this link to the Central Pacific Hurricane Center. Here’s a tracking map covering both the eastern and central Pacific Ocean. A satellite image, which shows the entire ocean area between Hawaii and the Mexican coast…can be found here.
Aloha Paragraphs

Beautiful scenery…Kauai
The trade winds will continue well into the future. This weather map shows a very strong 1043 millibar high pressure cell far to the north of the Hawaiian Islands. As a result of the presence of this robust high pressure cell, and another high far to the northeast…we’ll find moderate to strong trade winds going into the new work week ahead. The NWS is keeping the small craft wind advisory in those windiest areas from Molokai down through the Big Island Sunday. As the trade winds may increase another notch over the next couple of days, we could see that advisory extended up further into the state with time. Meanwhile, dry weather along the leeward sides has triggered a red flag warning, indicating the danger of wild fires.
The blustery trade winds will carry some moisture onto our windward sides, leaving the leeward sides generally dry…through the next several days. The computer forecast models show another chance of increased showers, generally along the windward sides after mid-week coming up. This will leave pretty typical weather conditions in place across the state until around Thursday, discounting the substantial trade wind flow that is. The leeward sides will have less wind, although even there, especially during the afternoon hours, it will be windy enough to put white caps on the ocean surface. Air temperatures will remain fairly seasonable, with maximum’s reaching well up into the 80F’s…dropping back into the 70’s at night near sea level.
It’s late Sunday afternoon here in Kula, Maui, as I begin writing this last paragraph of today’s narrative. Sunday was the kind of day that allowed me to wash my clothes, and hang them out to dry in the warm breeze…on the line. I was able to bring them in at mid-afternoon, which is at least one chore that I have finished. I started to change my spark plugs on my car, but after checking the plugs, they were clean and so I just put them back in…and will take the plugs back to the store and get my money back. Today has been the perfect blend of a little work, and some rest too, just the way I like my Sunday’s to be. I’m finishing this update a little earlier than usual, which gives me the rest of the day to do whatever I feel like, which I like. I’ll be back again early Monday morning with your next new weather narrative. I hope you have a great Sunday evening/night, until then! Aloha for now…Glenn.
Interesting: A network of floating docks could harness clean energy for New York City and provide new space for parks, researchers now propose. Each dock could generate power off the city’s river currents. Three vertical turbines fastened out of sight to the underside of each station would harness the 4 mph currents, with each module generating up to 24 kilowatts of constant energy from the Hudson and East Rivers.
These stations would plug into the conventional piers of the city, extending them into the rivers. They could alleviate the need for conventional power to light the city streets, with each module supporting 350 LED street lamps.
These docks could eventually get extended further up the rivers to both generate power and increase recreational green space and tidal pools for wildlife, said researchers at the New Jersey Institute of Technology and at GRO Architects in New York.
They currently have a provisional patent on the idea. The designers came up with the concept as an entry for this year’s Metropolis Magazine Next Generation Design Competition. "Since then, a lot of people have come out of the woodwork who put together clean energy deals for cities, or even in some cases developing countries," said researcher Richard Garber at the New Jersey Institute of Technology, co-founder of the firm GRO Architects.
Although officials from New York have not contacted the researchers yet, "people from other cities internationally have." There are already turbines harnessing power off tides in the waters of New York City. The Roosevelt Island Tidal Energy project could generate up to 10 megawatts, enough to power nearly 8,000 homes, according to its developer, New York-based company Verdant Power.
However, the new docks that Garber and his colleagues propose could generate a similar amount of energy while creating new public spaces. "If you think historically, cities developed around waterways based on a need for trade," Garber said. "As trading changed, the need for water as a preexisting requirement for urban development went away.
What’s funny is that all of a sudden, water can become uber-important again in terms of development." At the heart of the proposal, the researchers want to reinforce the relationship between the city and its rivers and help reclaim access to its 578 miles of waterfront.
"Many times, you can stand on the corner of 42nd St. and Park Ave. in Manhattan and have no idea you’re on an island, with the idea of the waterfront lost," Garber said. "A big picture goal here is that via clean energy, one can heighten awareness of the water."
Interesting2: The riot of color that erupts in forests every autumn looks different depending on which side of the ocean you’re on. While the fall foliage in North America and East Asia takes on a fiery red hue, perplexingly, autumn leaves in Europe are mostly yellow in color.
A team of researchers has a new idea as to why the autumnal colors differ between the continents, one that involved taking a step back 35 million years in time. The green color of leaves during the spring and summer is a result of the presence of the pigment chlorophyll, which allows plants to capture sunlight and produce energy by the process of photosynthesis.
When the weather begins to turn cool in the fall, chlorophyll, which is sensitive to the cold, stops being produced. As the green fades, yellow and orange pigments called carotenoids (also responsible for the orange color of carrots) take over. These pigments were always present in the background of the leaves’ color, but can finally shine through as the green diminishes.
While this process has long been known to scientists, the mechanism that results in red hues has proved trickier to understand, particularly because of the energy the tree must use to produce them at a time when the leaves are about to die anyway. The red color comes from anthocyanins, which unlike carotenoids are produced only in the fall.
These red pigments act as sunscreen for the trees by blocking out harmful radiation and preventing overexposure to light. They also act as an antifreeze, preventing leaf cells from freezing easily in the autumn chill. Some scientists have even suggested that the red colors ward off pests that would munch on the leaves if they were a more appetizing-looking yellow.
It’s from this premise that scientists figured out what might be going on. Until 35 million years ago, the idea goes, large areas of the globe were covered with evergreen jungles or forests composed of tropical trees, say Simcha Lev-Yadun of the University of Haifa-Oranim in Israel and Jarmo Holopainen of the University of Kuopio in Finland.
During this phase, a series of ice ages and dry spells transpired, and many tree species evolved to become deciduous, dropping their leaves for winter. Many of these trees also began an evolutionary process of producing red deciduous leaves in order to ward off insects, the researchers say. In North America, as in East Asia, north-to-south mountain chains enabled plant and animal ‘migration’ to the south or north with the advance and retreat of the ice according to the climatic fluctuations.
And, of course, along with them migrated their insect ‘enemies’. Thus the war for survival continued there uninterrupted. In Europe, on the other hand, the mountains – the Alps and their lateral branches – reach from east to west, and therefore no protected areas were created. Many tree species that did not survive the severe cold died, and with them the insects that depended on them for survival.
At the end of the repeated ice ages, most tree species that had survived in Europe had no need to cope with many of the insects that had become extinct, and therefore no longer had to expend efforts on producing red warning leaves.
To back up this theory, the researchers offer an example of the exception that proves the rule: Dwarf shrubs, which grow in Scandinavia, still color their leaves red in autumn. Unlike trees, dwarf shrubs have managed to survive the ice ages under a layer of snow that covered them and protected them from the extreme conditions above.
Under the blanket of snow, the insects that fed off the shrubs were also protected – so the battle with insects continued in these plants, making it necessary for them to color their leaves red, the thinking goes.
Interesting3: Flu season in the northern hemisphere can range from as early as November to as late as May. The peak month usually is February. However, this coming season is expected to be unpredictable because of the emergence of the H1N1 influenza virus or swine flu. The H1N1 has caused the first global outbreak — pandemic — of influenza in more than four decades.
There is concern that the 2009 H1N1 virus may make the season worse than a regular flu season. It is feared that there will be many more hospitalizations and fatalities this season. The 2009 H1N1 virus caused illness in the U.S. during the summer months when influenza is very uncommon. The 2009-10 flu vaccine protects against the three main flu strains that research indicates will cause the most illness during the flu season.
The seasonal vaccine is not expected to protect against the 2009 H1N1 virus. A vaccine for 2009 H1N1 is being produced and may be ready for the public in the fall. The 2009-10 vaccine can be administered anytime during flu season. However, the best time to get inoculated is October-November. The protection provided by the vaccine lasts about a year.
Adults over 50 are prime candidates for the vaccine because the flu can be fatal for people in this age group. The CDC reports vaccination rates are better for those over 65. About 7 in 10 seniors get their flu shots. You can get the flu vaccine from your doctor, at public health centers, senior centers, pharmacies and supermarkets.
For more than four decades, the flu vaccine has been strongly recommended for older people, but now some scientists say the vaccine probably doesn’t work well for those over 70. About 75 percent of flu deaths happen to people in this age group. Flu is a contagious illness of the respiratory system caused by the influenza virus. Flu can lead to pneumonia, bronchitis, sinusitis, ear problems and dehydration.
Droplets from coughing and sneezing spread the flu. An adult with flu can infect others beginning one day before symptoms develop and up to five days after becoming sick. Children may spread flu for more than seven days. The best way to combat the bug is to get the flu vaccine. You have to get inoculated annually because new vaccines are prepared every year to combat new versions of the virus.
When you battle the flu, you develop antibodies to the invading virus, but those antibodies don’t work on new strains. The vaccine does not prevent flu in all people; it works better in younger recipients than older ones. Contrary to rumor, you can’t catch the flu from the vaccine. The flu vaccine is not made from a live virus. The recovery time for the flu is about one to two weeks. However, in seniors, weakness may persist for a longer time.
The common scenario for flu is a sudden onset of symptoms, which include chills, fatigue, fever, cough, headache, sore throat, nasal congestion, muscle aches and appetite loss. While nausea, vomiting and diarrhea can be related to the flu, these are rarely the primary flu symptoms. The flu is not a stomach or intestinal disease.
The term stomach flu is inaccurate. When symptoms strike, get to a doctor as soon as possible; the faster the better. There are prescription antiviral drugs to treat flu. Over-the-counter medicines can help relieve symptoms of the flu. You should also drink liquids to prevent dehydration, and sleep to bolster your immune system.
Posted by Glenn
1 Comment
September 26-27, 2009
Air Temperatures – The following maximum temperatures were recorded across the state of Hawaii Saturday afternoon:
Lihue, Kauai – 86
Honolulu, Oahu 90
Kaneohe, Oahu – 84
Kahului, Maui – 87
Hilo, Hawaii – 83
Kailua-kona – 88
Air Temperatures ranged between these warmest and coolest spots near sea level around the state – and on the highest mountains…at 5 p.m. Saturday evening:
Barking Sands, Kauai – 87F
Hilo, Hawaii – 78
Haleakala Crater – 55 (near 10,000 feet on Maui)
Mauna Kea summit – 45 (near 14,000 feet on the Big Island)
Precipitation Totals – The following numbers represent the largest precipitation totals (inches) during the last 24 hours on each of the major islands, as of Saturday afternoon:
3.97 Mount Waialaele, Kauai
2.99 Oahu Forest NWR, Oahu
0.03 Molokai
0.13 Lanai
0.00 Kahoolawe
1.78 Puu Kukui, Maui
0.93 Mountain View, Big Island
Marine Winds – Here’s the latest (automatically updated) weather map showing high pressure systems far to the northeast and northwest. Our trade wind speeds will maintain moderately strong levels Saturday, then increase a notch on Sunday into early in the new week ahead.
Satellite and Radar Images: To view the cloud conditions we have here in Hawaii, please use the following satellite links, starting off with this Infrared Satellite Image of the islands to see all the clouds around the state during the day and night. This next image is one that gives close images of the islands only during the daytime hours, and is referred to as a Close-up visible image. This next image shows a larger view of the Pacific…giving perspective to the wider ranging cloud patterns in the Pacific Ocean. Finally, here’s a Looping IR satellite image, making viewable the clouds around the islands 24 hours a day. To help you keep track of where any showers may be around the islands, here’s the latest animated radar image.
Hawaii’s Mountains – Here’s a link to the live webcam on the summit of near 14,000 foot Mauna Kea on the Big Island of Hawaii. The tallest peak on the island of Maui is the Haleakala Crater, which is near 10,000 feet in elevation. These two webcams are available during the daylight hours here in the islands…and when there’s a big moon rising just after sunset for an hour or two! Plus, during the nights and early mornings you will be able to see stars, and the sunrise too…depending upon weather conditions.
Tropical Cyclone activity in the eastern and central Pacific – Here’s the latest weather information coming out of the National Hurricane Center, covering the eastern north Pacific. You can find the latest tropical cyclone information for the central north Pacific (where Hawaii is located) by clicking on this link to the Central Pacific Hurricane Center. Here’s a tracking map covering both the eastern and central Pacific Ocean. A satellite image, which shows the entire ocean area between Hawaii and the Mexican coast…can be found here.
Aloha Paragraphs

Steady trade winds
The trade winds will continue well into the future. This weather map shows two well developed 1038 millibar high pressure cells, one far to the northeast, with the other far to the northwest. As a result of the strengthening of the trade wind speeds, the NWS has reactivated the small craft wind advisory in those windiest areas from Molokai down through the Big Island. Consulting with the latest computer forecast models, there doesn’t appear to be any distinct end to our trade wind flow from this vantage point.
The locally showery conditions that we saw the last couple of days, is now over…with drier weather on tap for several days into the future. There will be a few showers along the windward sides, but otherwise conditions will remain quite dry. The leeward sides will be just about completely dry into the new work week ahead. The computer forecast models show another chance of increased showers, generally along the windward sides after mid-week coming up.
Friday evening I went to see a new film called Whiteout (2009)…starring Kate Beckinsale and Gabriel Macht…among others. What drew me into wanting to see this film was the chance to check out Antarctica, and all those howling winds down there. The short synopsis says this: "A U.S. Marshall is assigned to Antarctica to investigate a murder and is drawn into a shocking mystery." This certainly wasn’t the best film that I’ve seen this year, although it was good enough that I was glad I saw it. There were parts that got rather intense, and once again I had to have a little talk with my body, telling it to relax, and that it was just a film afterall. I’d give it a C+ I suppose, as it was about average, or slightly better. Here’s a trailer for this film, just in case you are interested in taking a peek.
It’s early Saturday evening here in Kula, Maui, as I begin writing this last paragraph of today’s narrative. I drove up into the Iao Valley of the West Maui Mountains this morning, which was something that I hadn’t done in a long time. I stood around there and watched the clouds swirling around along those steep ridges. The Iao Valley has quite a history, where a major battle took place between various island groups. It looked like winter in there, with all those clouds around, but it was also warm at the same time. I then drove over to a shopping center in Kahului, and looked around for a while, again something that doesn’t happen very often in my life. I ended up at the country club in Sprecklesville, where I did some fun putting. This little course has five holes, so after establishing for myself a two putt par, I went around three times. I hit par twice out of the three times, with one ball going right in the hole on the first hit…hole in one! I then took the short drive over to Baldwin Beach, where I took a nice walk, and ended up getting into the active surf breaking there. It was fun for me to dive under these waves, and rode a few too, knowing that they were generated by a former typhoon in the western Pacific! I then went shopping at the health food store in Paia, and came home afterwards. It’s now just before sunset, and I’m going to go out and enjoy the sun setting into the western horizon. I hope you have a great Saturday night, and will meet me here again on Sunday, when I’ll have your next new weather narrative from paradise waiting for you. Aloha for now…Glenn.
Interesting: A network of floating docks could harness clean energy for New York City and provide new space for parks, researchers now propose. Each dock could generate power off the city’s river currents. Three vertical turbines fastened out of sight to the underside of each station would harness the 4 mph currents, with each module generating up to 24 kilowatts of constant energy from the Hudson and East Rivers.
These stations would plug into the conventional piers of the city, extending them into the rivers. They could alleviate the need for conventional power to light the city streets, with each module supporting 350 LED street lamps.
These docks could eventually get extended further up the rivers to both generate power and increase recreational green space and tidal pools for wildlife, said researchers at the New Jersey Institute of Technology and at GRO Architects in New York.
They currently have a provisional patent on the idea. The designers came up with the concept as an entry for this year’s Metropolis Magazine Next Generation Design Competition. "Since then, a lot of people have come out of the woodwork who put together clean energy deals for cities, or even in some cases developing countries," said researcher Richard Garber at the New Jersey Institute of Technology, co-founder of the firm GRO Architects.
Although officials from New York have not contacted the researchers yet, "people from other cities internationally have." There are already turbines harnessing power off tides in the waters of New York City. The Roosevelt Island Tidal Energy project could generate up to 10 megawatts, enough to power nearly 8,000 homes, according to its developer, New York-based company Verdant Power.
However, the new docks that Garber and his colleagues propose could generate a similar amount of energy while creating new public spaces. "If you think historically, cities developed around waterways based on a need for trade," Garber said. "As trading changed, the need for water as a preexisting requirement for urban development went away.
What’s funny is that all of a sudden, water can become uber-important again in terms of development." At the heart of the proposal, the researchers want to reinforce the relationship between the city and its rivers and help reclaim access to its 578 miles of waterfront.
"Many times, you can stand on the corner of 42nd St. and Park Ave. in Manhattan and have no idea you’re on an island, with the idea of the waterfront lost," Garber said. "A big picture goal here is that via clean energy, one can heighten awareness of the water."
Interesting2: The riot of color that erupts in forests every autumn looks different depending on which side of the ocean you’re on. While the fall foliage in North America and East Asia takes on a fiery red hue, perplexingly, autumn leaves in Europe are mostly yellow in color.
A team of researchers has a new idea as to why the autumnal colors differ between the continents, one that involved taking a step back 35 million years in time. The green color of leaves during the spring and summer is a result of the presence of the pigment chlorophyll, which allows plants to capture sunlight and produce energy by the process of photosynthesis.
When the weather begins to turn cool in the fall, chlorophyll, which is sensitive to the cold, stops being produced. As the green fades, yellow and orange pigments called carotenoids (also responsible for the orange color of carrots) take over. These pigments were always present in the background of the leaves’ color, but can finally shine through as the green diminishes.
While this process has long been known to scientists, the mechanism that results in red hues has proved trickier to understand, particularly because of the energy the tree must use to produce them at a time when the leaves are about to die anyway. The red color comes from anthocyanins, which unlike carotenoids are produced only in the fall.
These red pigments act as sunscreen for the trees by blocking out harmful radiation and preventing overexposure to light. They also act as an antifreeze, preventing leaf cells from freezing easily in the autumn chill. Some scientists have even suggested that the red colors ward off pests that would munch on the leaves if they were a more appetizing-looking yellow.
It’s from this premise that scientists figured out what might be going on. Until 35 million years ago, the idea goes, large areas of the globe were covered with evergreen jungles or forests composed of tropical trees, say Simcha Lev-Yadun of the University of Haifa-Oranim in Israel and Jarmo Holopainen of the University of Kuopio in Finland.
During this phase, a series of ice ages and dry spells transpired, and many tree species evolved to become deciduous, dropping their leaves for winter. Many of these trees also began an evolutionary process of producing red deciduous leaves in order to ward off insects, the researchers say. In North America, as in East Asia, north-to-south mountain chains enabled plant and animal ‘migration’ to the south or north with the advance and retreat of the ice according to the climatic fluctuations.
And, of course, along with them migrated their insect ‘enemies’. Thus the war for survival continued there uninterrupted. In Europe, on the other hand, the mountains – the Alps and their lateral branches – reach from east to west, and therefore no protected areas were created. Many tree species that did not survive the severe cold died, and with them the insects that depended on them for survival.
At the end of the repeated ice ages, most tree species that had survived in Europe had no need to cope with many of the insects that had become extinct, and therefore no longer had to expend efforts on producing red warning leaves.
To back up this theory, the researchers offer an example of the exception that proves the rule: Dwarf shrubs, which grow in Scandinavia, still color their leaves red in autumn. Unlike trees, dwarf shrubs have managed to survive the ice ages under a layer of snow that covered them and protected them from the extreme conditions above.
Under the blanket of snow, the insects that fed off the shrubs were also protected – so the battle with insects continued in these plants, making it necessary for them to color their leaves red, the thinking goes.
Interesting3: Flu season in the northern hemisphere can range from as early as November to as late as May. The peak month usually is February. However, this coming season is expected to be unpredictable because of the emergence of the H1N1 influenza virus or swine flu. The H1N1 has caused the first global outbreak — pandemic — of influenza in more than four decades.
There is concern that the 2009 H1N1 virus may make the season worse than a regular flu season. It is feared that there will be many more hospitalizations and fatalities this season. The 2009 H1N1 virus caused illness in the U.S. during the summer months when influenza is very uncommon. The 2009-10 flu vaccine protects against the three main flu strains that research indicates will cause the most illness during the flu season.
The seasonal vaccine is not expected to protect against the 2009 H1N1 virus. A vaccine for 2009 H1N1 is being produced and may be ready for the public in the fall. The 2009-10 vaccine can be administered anytime during flu season. However, the best time to get inoculated is October-November. The protection provided by the vaccine lasts about a year.
Adults over 50 are prime candidates for the vaccine because the flu can be fatal for people in this age group. The CDC reports vaccination rates are better for those over 65. About 7 in 10 seniors get their flu shots. You can get the flu vaccine from your doctor, at public health centers, senior centers, pharmacies and supermarkets.
For more than four decades, the flu vaccine has been strongly recommended for older people, but now some scientists say the vaccine probably doesn’t work well for those over 70. About 75 percent of flu deaths happen to people in this age group. Flu is a contagious illness of the respiratory system caused by the influenza virus. Flu can lead to pneumonia, bronchitis, sinusitis, ear problems and dehydration.
Droplets from coughing and sneezing spread the flu. An adult with flu can infect others beginning one day before symptoms develop and up to five days after becoming sick. Children may spread flu for more than seven days. The best way to combat the bug is to get the flu vaccine. You have to get inoculated annually because new vaccines are prepared every year to combat new versions of the virus.
When you battle the flu, you develop antibodies to the invading virus, but those antibodies don’t work on new strains. The vaccine does not prevent flu in all people; it works better in younger recipients than older ones. Contrary to rumor, you can’t catch the flu from the vaccine. The flu vaccine is not made from a live virus. The recovery time for the flu is about one to two weeks. However, in seniors, weakness may persist for a longer time.
The common scenario for flu is a sudden onset of symptoms, which include chills, fatigue, fever, cough, headache, sore throat, nasal congestion, muscle aches and appetite loss. While nausea, vomiting and diarrhea can be related to the flu, these are rarely the primary flu symptoms. The flu is not a stomach or intestinal disease.
The term stomach flu is inaccurate. When symptoms strike, get to a doctor as soon as possible; the faster the better. There are prescription antiviral drugs to treat flu. Over-the-counter medicines can help relieve symptoms of the flu. You should also drink liquids to prevent dehydration, and sleep to bolster your immune system.
Posted by Glenn
No Comments
September 25-26, 2009
Air Temperatures – The following maximum temperatures were recorded across the state of Hawaii Friday afternoon:
Lihue, Kauai – 85
Honolulu, Oahu 90
Kaneohe, Oahu – 84
Kahului, Maui – 89
Hilo, Hawaii – 82
Kailua-kona – 87
Air Temperatures ranged between these warmest and coolest spots near sea level around the state – and on the highest mountains…at 5 p.m. Friday evening:
Port Allen, Kauai – 88F
Hilo, Hawaii – 73
Haleakala Crater – 50 (near 10,000 feet on Maui)
Mauna Kea summit – 41 (near 14,000 feet on the Big Island)
Precipitation Totals – The following numbers represent the largest precipitation totals (inches) during the last 24 hours on each of the major islands, as of Friday afternoon:
0.88 Mount Waialaele, Kauai
0.96 Manoa Valley, Oahu
0.13 Molokai
0.00 Lanai
0.12 Kahoolawe
2.81 Puu Kukui, Maui
0.58 Mountain View, Big Island
Marine Winds – Here’s the latest (automatically updated) weather map showing high pressure systems far to the northeast and northwest. Our trade wind speeds will increase into Saturday, as these high pressure cells provide stronger trade winds across our tropical latitudes.
Satellite and Radar Images: To view the cloud conditions we have here in Hawaii, please use the following satellite links, starting off with this Infrared Satellite Image of the islands to see all the clouds around the state during the day and night. This next image is one that gives close images of the islands only during the daytime hours, and is referred to as a Close-up visible image. This next image shows a larger view of the Pacific…giving perspective to the wider ranging cloud patterns in the Pacific Ocean. Finally, here’s a Looping IR satellite image, making viewable the clouds around the islands 24 hours a day. To help you keep track of where any showers may be around the islands, here’s the latest animated radar image.
Hawaii’s Mountains – Here’s a link to the live webcam on the summit of near 14,000 foot Mauna Kea on the Big Island of Hawaii. The tallest peak on the island of Maui is the Haleakala Crater, which is near 10,000 feet in elevation. These two webcams are available during the daylight hours here in the islands…and when there’s a big moon rising just after sunset for an hour or two! Plus, during the nights and early mornings you will be able to see stars, and the sunrise too…depending upon weather conditions.
Tropical Cyclone activity in the eastern and central Pacific – Here’s the latest weather information coming out of the National Hurricane Center, covering the eastern north Pacific. You can find the latest tropical cyclone information for the central north Pacific (where Hawaii is located) by clicking on this link to the Central Pacific Hurricane Center. Here’s a tracking map covering both the eastern and central Pacific Ocean. A satellite image, which shows the entire ocean area between Hawaii and the Mexican coast…can be found here.
Aloha Paragraphs

Early season swell continues on our north and west shores
The trade winds are blowing now, like they will be through most of the next week. They are mostly well within the moderately strong levels, although a few of the windier spots are gusting well up past the 30 mph mark. This weather map shows two well developed high pressure cells, one far to the northeast (1029 mb.), with the other far to the northwest (1034 mb.). Slicing these anticyclones in half is a very long frontal zone, which extends from the southern Alaska coast, across the eastern Pacific, through the central Pacific to our north, across the International Dateline…into the western Pacific. Consulting with the latest computer forecast models, there doesn’t appear to be any distinct end to our trade wind flow from this vantage point.
The long and short of this pressure configuration will be a long continuation of these trade winds, across our tropical latitudes. These winds aren’t all that strong yet, although are strong enough to have triggered a small craft wind advisory through the Alenuihaha Channel between Maui and the Big Island…at least in terms of wind. The high surf however, associated with the northwest swell train of waves has caused it to be extended across all of our marine zones, from the BigIsland up through Kauai and Niihau. As the swell drops in size later tomorrow, the small craft wind advisory will likely be pared back down to those typically windiest areas around Maui and the Big Island of Hawaii…that is unless the trade winds have increased in strength some by then.
In terms of precipitation, there’s expected to be an increase now into Saturday, in association with both an influx of moisture carried in by the trade winds…and the presence of an upper level trough of low pressure over the state. The coming together of these weather elements will keep more than the ordinary amount of showers falling, although the vast majority of them will end up falling along the windward coasts and slopes. The cold air brought overhead by this trough, may allow cloud tops to rise enough, to prompt some locally heavy showers here and there. Case in point: the generous 2.81” at Puu Kukui on the west side of Maui during the last 24 hours. Here’s a IR satellite image to check out all the clouds in our area now. Here’s a looping radar image too, so we can see where the showers are falling. As the trade winds are blowing, there’s always that chance that a few showers may stretch over into the leeward sides as well. As the trough departs our area during the second half of the weekend, conditions will probably become drier.
Our north and west facing beaches will see large surf, as a northwest swell train of waves continues breaking Friday night, right on into Saturday. This dynamic surf has prompted the NWS to issue high surf advisories for our north and west facing beaches…from Kauai down through Maui. It will take more breaking on our local beaches, before this surf’s influence will gradually weaken during the second half of the upcoming weekend. If you go to see this early season surf, please be careful, as we don’t want anyone being swept into the ocean. Perhaps a better bet would be to head over to the south shores, where much smaller surf will be active, making it more user friendly for folks not accustomed to the dangerous conditions. There will be more surf arriving next week from the northwest, although it doesn’t look like it will be as large as what we’re seeing now.
Since it’s Friday, and it’s my habit, I’ll be taking in a new film this evening. This time around I’ll check out one called Whiteout (2009)…starring Kate Beckinsale and Gabriel Macht. It’s not the best looking one on the long list of films now showing on Maui, but the chance to see Antarctica, and all those howling winds down there, draws me in. The short synopsis says this: "A U.S. Marshall is assigned to Antarctica to investigate a murder and is drawn into a shocking mystery." I’ll of course let you know what I think about this film Saturday morning when I return with your next new weather narrative. Here’s a trailer for this film, just in case you are interested. ~~~ If I’m going to make this film, I’d better get on the road right now, I hope you have a great Friday night! Aloha for now…Glenn.
Interesting: A network of floating docks could harness clean energy for New York City and provide new space for parks, researchers now propose. Each dock could generate power off the city’s river currents. Three vertical turbines fastened out of sight to the underside of each station would harness the 4 mph currents, with each module generating up to 24 kilowatts of constant energy from the Hudson and East Rivers.
These stations would plug into the conventional piers of the city, extending them into the rivers. They could alleviate the need for conventional power to light the city streets, with each module supporting 350 LED street lamps.
These docks could eventually get extended further up the rivers to both generate power and increase recreational green space and tidal pools for wildlife, said researchers at the New Jersey Institute of Technology and at GRO Architects in New York.
They currently have a provisional patent on the idea. The designers came up with the concept as an entry for this year’s Metropolis Magazine Next Generation Design Competition. "Since then, a lot of people have come out of the woodwork who put together clean energy deals for cities, or even in some cases developing countries," said researcher Richard Garber at the New Jersey Institute of Technology, co-founder of the firm GRO Architects.
Although officials from New York have not contacted the researchers yet, "people from other cities internationally have." There are already turbines harnessing power off tides in the waters of New York City. The Roosevelt Island Tidal Energy project could generate up to 10 megawatts, enough to power nearly 8,000 homes, according to its developer, New York-based company Verdant Power.
However, the new docks that Garber and his colleagues propose could generate a similar amount of energy while creating new public spaces. "If you think historically, cities developed around waterways based on a need for trade," Garber said. "As trading changed, the need for water as a preexisting requirement for urban development went away.
What’s funny is that all of a sudden, water can become uber-important again in terms of development." At the heart of the proposal, the researchers want to reinforce the relationship between the city and its rivers and help reclaim access to its 578 miles of waterfront.
"Many times, you can stand on the corner of 42nd St. and Park Ave. in Manhattan and have no idea you’re on an island, with the idea of the waterfront lost," Garber said. "A big picture goal here is that via clean energy, one can heighten awareness of the water."
Interesting2: The riot of color that erupts in forests every autumn looks different depending on which side of the ocean you’re on. While the fall foliage in North America and East Asia takes on a fiery red hue, perplexingly, autumn leaves in Europe are mostly yellow in color.
A team of researchers has a new idea as to why the autumnal colors differ between the continents, one that involved taking a step back 35 million years in time. The green color of leaves during the spring and summer is a result of the presence of the pigment chlorophyll, which allows plants to capture sunlight and produce energy by the process of photosynthesis.
When the weather begins to turn cool in the fall, chlorophyll, which is sensitive to the cold, stops being produced. As the green fades, yellow and orange pigments called carotenoids (also responsible for the orange color of carrots) take over. These pigments were always present in the background of the leaves’ color, but can finally shine through as the green diminishes.
While this process has long been known to scientists, the mechanism that results in red hues has proved trickier to understand, particularly because of the energy the tree must use to produce them at a time when the leaves are about to die anyway. The red color comes from anthocyanins, which unlike carotenoids are produced only in the fall.
These red pigments act as sunscreen for the trees by blocking out harmful radiation and preventing overexposure to light. They also act as an antifreeze, preventing leaf cells from freezing easily in the autumn chill. Some scientists have even suggested that the red colors ward off pests that would munch on the leaves if they were a more appetizing-looking yellow.
It’s from this premise that scientists figured out what might be going on. Until 35 million years ago, the idea goes, large areas of the globe were covered with evergreen jungles or forests composed of tropical trees, say Simcha Lev-Yadun of the University of Haifa-Oranim in Israel and Jarmo Holopainen of the University of Kuopio in Finland.
During this phase, a series of ice ages and dry spells transpired, and many tree species evolved to become deciduous, dropping their leaves for winter. Many of these trees also began an evolutionary process of producing red deciduous leaves in order to ward off insects, the researchers say. In North America, as in East Asia, north-to-south mountain chains enabled plant and animal ‘migration’ to the south or north with the advance and retreat of the ice according to the climatic fluctuations.
And, of course, along with them migrated their insect ‘enemies’. Thus the war for survival continued there uninterrupted. In Europe, on the other hand, the mountains – the Alps and their lateral branches – reach from east to west, and therefore no protected areas were created. Many tree species that did not survive the severe cold died, and with them the insects that depended on them for survival.
At the end of the repeated ice ages, most tree species that had survived in Europe had no need to cope with many of the insects that had become extinct, and therefore no longer had to expend efforts on producing red warning leaves.
To back up this theory, the researchers offer an example of the exception that proves the rule: Dwarf shrubs, which grow in Scandinavia, still color their leaves red in autumn. Unlike trees, dwarf shrubs have managed to survive the ice ages under a layer of snow that covered them and protected them from the extreme conditions above.
Under the blanket of snow, the insects that fed off the shrubs were also protected – so the battle with insects continued in these plants, making it necessary for them to color their leaves red, the thinking goes.
Interesting3: Flu season in the northern hemisphere can range from as early as November to as late as May. The peak month usually is February. However, this coming season is expected to be unpredictable because of the emergence of the H1N1 influenza virus or swine flu. The H1N1 has caused the first global outbreak — pandemic — of influenza in more than four decades.
There is concern that the 2009 H1N1 virus may make the season worse than a regular flu season. It is feared that there will be many more hospitalizations and fatalities this season. The 2009 H1N1 virus caused illness in the U.S. during the summer months when influenza is very uncommon. The 2009-10 flu vaccine protects against the three main flu strains that research indicates will cause the most illness during the flu season.
The seasonal vaccine is not expected to protect against the 2009 H1N1 virus. A vaccine for 2009 H1N1 is being produced and may be ready for the public in the fall. The 2009-10 vaccine can be administered anytime during flu season. However, the best time to get inoculated is October-November. The protection provided by the vaccine lasts about a year.
Adults over 50 are prime candidates for the vaccine because the flu can be fatal for people in this age group. The CDC reports vaccination rates are better for those over 65. About 7 in 10 seniors get their flu shots. You can get the flu vaccine from your doctor, at public health centers, senior centers, pharmacies and supermarkets.
For more than four decades, the flu vaccine has been strongly recommended for older people, but now some scientists say the vaccine probably doesn’t work well for those over 70. About 75 percent of flu deaths happen to people in this age group. Flu is a contagious illness of the respiratory system caused by the influenza virus. Flu can lead to pneumonia, bronchitis, sinusitis, ear problems and dehydration.
Droplets from coughing and sneezing spread the flu. An adult with flu can infect others beginning one day before symptoms develop and up to five days after becoming sick. Children may spread flu for more than seven days. The best way to combat the bug is to get the flu vaccine. You have to get inoculated annually because new vaccines are prepared every year to combat new versions of the virus.
When you battle the flu, you develop antibodies to the invading virus, but those antibodies don’t work on new strains. The vaccine does not prevent flu in all people; it works better in younger recipients than older ones. Contrary to rumor, you can’t catch the flu from the vaccine. The flu vaccine is not made from a live virus. The recovery time for the flu is about one to two weeks. However, in seniors, weakness may persist for a longer time.
The common scenario for flu is a sudden onset of symptoms, which include chills, fatigue, fever, cough, headache, sore throat, nasal congestion, muscle aches and appetite loss. While nausea, vomiting and diarrhea can be related to the flu, these are rarely the primary flu symptoms. The flu is not a stomach or intestinal disease.
The term stomach flu is inaccurate. When symptoms strike, get to a doctor as soon as possible; the faster the better. There are prescription antiviral drugs to treat flu. Over-the-counter medicines can help relieve symptoms of the flu. You should also drink liquids to prevent dehydration, and sleep to bolster your immune system.
Posted by Glenn
No Comments
September 24-25, 2009
Air Temperatures – The following maximum temperatures were recorded across the state of Hawaii Thursday afternoon:
Lihue, Kauai – 84
Honolulu, Oahu 88
Kaneohe, Oahu – 86
Kahului, Maui – 87
Hilo, Hawaii – 81
Kailua-kona – 86
Air Temperatures ranged between these warmest and coolest spots near sea level around the state – and on the highest mountains…at 4 p.m. Thursday afternoon:
Honolulu, Oahu – 87F
Kapalua, Maui – 77
Haleakala Crater – 50 (near 10,000 feet on Maui)
Mauna Kea summit – 43 (near 14,000 feet on the Big Island)
Precipitation Totals – The following numbers represent the largest precipitation totals (inches) during the last 24 hours on each of the major islands, as of Thursday afternoon:
0.65 Mount Waialaele, Kauai
0.35 Nuuanu Upper, Oahu
0.00 Molokai
0.00 Lanai
0.00 Kahoolawe
0.10 Puu Kukui, Maui
0.39 Kealakekua, Big Island
Marine Winds – Here’s the latest (automatically updated) weather map showing high pressure systems to the northeast and northwest. Our trade wind speeds will increase into Saturday, as these high pressure cells provide stronger trade winds.
Satellite and Radar Images: To view the cloud conditions we have here in Hawaii, please use the following satellite links, starting off with this Infrared Satellite Image of the islands to see all the clouds around the state during the day and night. This next image is one that gives close images of the islands only during the daytime hours, and is referred to as a Close-up visible image. This next image shows a larger view of the Pacific…giving perspective to the wider ranging cloud patterns in the Pacific Ocean. Finally, here’s a Looping IR satellite image, making viewable the clouds around the islands 24 hours a day. To help you keep track of where any showers may be around the islands, here’s the latest animated radar image.
Hawaii’s Mountains – Here’s a link to the live webcam on the summit of near 14,000 foot Mauna Kea on the Big Island of Hawaii. The tallest peak on the island of Maui is the Haleakala Crater, which is near 10,000 feet in elevation. These two webcams are available during the daylight hours here in the islands…and when there’s a big moon rising just after sunset for an hour or two! Plus, during the nights and early mornings you will be able to see stars, and the sunrise too…depending upon weather conditions.
Tropical Cyclone activity in the eastern and central Pacific – Here’s the latest weather information coming out of the National Hurricane Center, covering the eastern north Pacific. You can find the latest tropical cyclone information for the central north Pacific (where Hawaii is located) by clicking on this link to the Central Pacific Hurricane Center. Here’s a tracking map covering both the eastern and central Pacific Ocean. A satellite image, which shows the entire ocean area between Hawaii and the Mexican coast…can be found here.
Aloha Paragraphs

Large surf along our north and west shores
We’re moving into a spell of long lasting trade winds, which will prevail through the rest of this week…and then well into next week. These early autumn trades are blowing across our islands thanks to high pressure systems to the northeast and northwest of Hawaii. This weather map shows these two high pressure cells. These high’s will help to keep any early season cold front’s out of our area. As the trades pick up a bit more in strength over the next couple of days, we should see small craft wind advisories going up over those typically windiest areas around Maui and the Big Island.
As is often the case, the stronger trade winds tend to bring periods of increased windward showers…which will happen in an on and off manner now. Computer models continue to suggest that there will be moisture being carried our way on the trade wind flow. Meanwhile, an upper level trough of low pressure will add some enhancement to these showers. These showery clouds will influence the weather most directly along the windward coasts and slopes. The leeward sides will see drier weather, although a few showers could occur along these sides too through Friday…with drier weather everywhere this weekend. Here’s a satellite image, so we can keep an eye on clouds in our area. It looks as though we may see some high cirrus clouds approaching from the southeast as well.
Our north and west facing beaches will see large surf, as a northwest swell train of waves continues breaking into Friday. The source of this swell was typhoon chai-won, which whipped the north western Pacific into a fury last week. This tropical cyclone has moved out of the tropics, having gone through what we call an extra-tropical transition, into a gale low pressure system in the northern latitudes…moving into the Gulf of Alaska now. This larger surf has prompted the NWS to issue high surf advisories for our north and west facing beaches…from Kauai down through Maui. It will take several days of breaking on our local beaches, before this surf’s influence will gradually weaken during the weekend.
It’s early Thursday evening here in Kihei, Maui, as I begin writing this last paragraph of today’s narrative. As noted above, we have some increase in showers on the horizon, so that we’d better keep this looping radar image handy. This incoming moisture will be good for us, as we could use the rainfall in many areas of the state. This will be a rather short lived affair however, with drier weather already on the way, arriving this weekend. I’m getting ready to take the drive back upcountry, but just before leaving, and taking a quick glance out the windows here, I see lots of clouds, and what looks like wet weather over on the windward sides. ~~~ I’ll be back early Friday morning with your next new weather narrative, I hope you have a great Thursday night! Aloha for now…Glenn.
Extra: Here’s a lightning detection website…showing where strikes are occurring across the U.S. mainland
Interesting: El Niño, the periodic eastern Pacific phenomenon credited with shielding the United States and Caribbean from severe hurricane seasons, may be overshadowed by its brother in the central Pacific due to global warming, according to an article in the September 24 issue of the journal Nature. "There are two El Niños, or flavors of El Niño," said Ben Kirtman, co-author of the study and professor of meteorology and physical oceanography at the University of Miami’s Rosentstiel School of Marine and Atmospheric Science.
"In addition to the eastern Pacific El Niño which we know and love, a second El Niño in the central Pacific is on the increase." El Niño is a recurring warm water current along the equator in the Pacific Ocean that affects weather circulation patterns in the tropics. The eastern El Niño increases wind sheer in the Atlantic that may hamper the development of major hurricanes there.
The central Pacific El Niño, near the International Dateline, has been blamed for worsening drought conditions in Australia and India as well as minimizing the effects of its beneficial brother to the east. Led by Sang-Wook Yeh of the Korea Ocean Research & Development Institute, a team of scientists applied Pacific Ocean sea surface temperature data from the past 150 years to 11 global warming models developed by the Intergovernmental Panel on Climate Change.
Eight of the models showed that global warming conditions will increase the incidence of the central Pacific El Niño. Over the past 20 years, according to the data, the frequency of an El Niño event in the central Pacific has increased from one out of every five to half of all El Niño occurrences. "The results described in this paper indicate that the global impacts of El Niño may significantly change as the climate warms," said Yeh.
Though the centers of the central and eastern areas are roughly 4,100 miles apart, El Niños historically have not simultaneously occurred in both places. An increase in central Pacific El Niño events may reduce the hurricane-shielding effects of the eastern Pacific event. "Currently, we are in the middle of a developing eastern Pacific El Niño event," said Kirtman, "which is part of why we’re experiencing such a mild hurricane season in the Atlantic.
We also anticipate the southern United States to have a fairly wet winter, and the northeast may be dry and warm." Kirtman expects the current El Niño event to end next spring, perhaps followed by a La Niña, which he expects may bode for a more intense Atlantic hurricane season in 2010. Growing up in southern California, Kirtman frequently had to man the sump pump in his family’s basement during the rainy season, which he learned later was caused by El Niño.
"We’re finally learning about how ocean current flows and increases in sea surface temperature influence weather patterns, which affect every one of us, including the kid manning the sump pump," he said. "I have devoted much of my career to studying El Niño because of how it affects people and their lives." Kirtman works with various meteorological organizations around the world to help developing countries respond to climate extremes. "We provide them with the forecasts," he said, "and the countries use the results to develop their response."
Interesting2: The most comprehensive picture of the rapidly thinning glaciers along the coastline of both the Antarctic and Greenland ice sheets has been created using satellite lasers. The findings are an important step forward in the quest to make more accurate predictions for future sea level rise.
Reporting this week in the journal Nature, researchers from British Antarctic Survey and the University of Bristol describe how analysis of millions of NASA satellite measurements from both of these vast ice sheets shows that the most profound ice loss is a result of glaciers speeding up where they flow into the sea.
The authors conclude that this ‘dynamic thinning’ of glaciers now reaches all latitudes in Greenland, has intensified on key Antarctic coastlines, is penetrating far into the ice sheets’ interior and is spreading as ice shelves thin by ocean-driven melt. Ice shelf collapse has triggered particularly strong thinning that has endured for decades.
Interesting3: New approaches are needed to help humanity deal with climate change and other global environmental threats that lie ahead in the 21st century, according to a group of 28 internationally renowned scientists. The scientists propose that global biophysical boundaries, identified on the basis of the scientific understanding of the earth system, can define a "safe planetary operating space" that will allow humanity to continue to develop and thrive for generations to come.
This new approach to sustainable development is conveyed in the current issue of the scientific journal Nature. The authors have made a first attempt to identify and quantify a set of nine planetary boundaries, including climate change, freshwater use, biological diversity, and aerosol loading.
The research was performed by a working group at UC Santa Barbara’s National Center for Ecological Analysis and Synthesis (NCEAS), in cooperation with the Stockholm Resilience Centre at Stockholm University. One important strand of the research behind this article is based in the global project known as IHOPE.
The goal of the Integrated History and future Of People on Earth (IHOPE) project is to understand the interactions of the environmental and human process over the ten to hundred millennia to determine how human and biophysical changes have contributed to Earth system dynamics.
The IHOPE working group is assembled at NCEAS today. The scientists emphasize that the rapid expansion of human activities since the industrial revolution has now generated a global geophysical force equivalent to some of the great forces of nature. "We are entering the Anthropocene, a new geological era in which our activities are threatening the earth’s capacity to regulate itself," said co-author Will Steffen, professor at the Australian National University (ANU) and director of the ANU Climate Change Institute.
"We are beginning to push the planet out of its current stable Holocene state, the warm period that began about 10,000 years ago and during which agriculture and complex societies, including our own, have developed and flourished. The expanding human enterprise could undermine the resilience of the Holocene state, which would otherwise continue for thousands of years into the future."
Interesting4: Researchers at North Carolina State University are working to demonstrate that trees can be used to degrade or capture fuels that leak into soil and ground water. Through a process called phytoremediation – literally a “green” technology – plants and trees remove pollutants from the environment or render them harmless. Through a partnership with state and federal government agencies, the military and industry, Dr. Elizabeth Nichols, environmental technology professor in NC State’s Department of Forestry and Environmental Resources, and her team are using phytoremediation to clean up a contaminated site in Elizabeth City, N.C.
Phytoremediation uses plants to absorb heavy metals from the soil into their roots. The process is an attractive alternative to the standard clean-up methods currently used, which are very expensive and energy intensive. At appropriate sites, phytoremediation can be a cost-effective and sustainable technology, Nichols says. The Coast Guard site was planted with a mixture of fast-growing trees such as hybrid poplars and willows to prevent residual fuel waste from entering the Pasquotank River by ground water discharge.
About 3,000 trees were planted on the five-acre site, which stored aircraft fuel for the Coast Guard base from 1942 until 1991. Fuels had been released into the soil and ground water over time. Efforts to recover easily extractable fuel using a free product recovery system – also called “oil skimmers” – had stalled so other remedial options were considered before choosing phytoremediation.
Posted by Glenn
No Comments
September 23-24, 2009
Air Temperatures – The following maximum temperatures were recorded across the state of Hawaii Wednesday afternoon:
Lihue, Kauai – 84
Honolulu, Oahu 88
Kaneohe, Oahu – 85
Kahului, Maui – 90
Hilo, Hawaii – 82
Kailua-kona – 87
Air Temperatures ranged between these warmest and coolest spots near sea level around the state – and on the highest mountains…at 5 p.m. Wednesday evening:
Honolulu, Oahu – 85F
Hilo, Hawaii – 76
Haleakala Crater – 54 (near 10,000 feet on Maui)
Mauna Kea summit – 41 (near 14,000 feet on the Big Island)
Precipitation Totals – The following numbers represent the largest precipitation totals (inches) during the last 24 hours on each of the major islands, as of Wednesday afternoon:
0.03 Poipu, Kauai
0.21 Oahu Forest NWR, Oahu
0.00 Molokai
0.00 Lanai
0.00 Kahoolawe
0.01 Kaupo Gap, Maui
0.81 Laupahoehoe, Big Island
Marine Winds – Here’s the latest (automatically updated) weather map showing a weak 1018 millibar high pressure system to the northeast, with its ridge extending southwest to a point just north of the islands. This will keep our trade winds on the light side, although as the ridge migrates northward, we’ll find them gradually increasing later Wednesday into Thursday.
Satellite and Radar Images: To view the cloud conditions we have here in Hawaii, please use the following satellite links, starting off with this Infrared Satellite Image of the islands to see all the clouds around the state during the day and night. This next image is one that gives close images of the islands only during the daytime hours, and is referred to as a Close-up visible image. This next image shows a larger view of the Pacific…giving perspective to the wider ranging cloud patterns in the Pacific Ocean. Finally, here’s a Looping IR satellite image, making viewable the clouds around the islands 24 hours a day. To help you keep track of where any showers may be around the islands, here’s the latest animated radar image.
Hawaii’s Mountains – Here’s a link to the live webcam on the summit of near 14,000 foot Mauna Kea on the Big Island of Hawaii. The tallest peak on the island of Maui is the Haleakala Crater, which is near 10,000 feet in elevation. These two webcams are available during the daylight hours here in the islands…and when there’s a big moon rising just after sunset for an hour or two! Plus, during the nights and early mornings you will be able to see stars, and the sunrise too…depending upon weather conditions.
Tropical Cyclone activity in the eastern and central Pacific – Here’s the latest weather information coming out of the National Hurricane Center, covering the eastern north Pacific. You can find the latest tropical cyclone information for the central north Pacific (where Hawaii is located) by clicking on this link to the Central Pacific Hurricane Center. Here’s a tracking map covering both the eastern and central Pacific Ocean. A satellite image, which shows the entire ocean area between Hawaii and the Mexican coast…can be found here.
Aloha Paragraphs

Surf’s gonna be coming up overnight
Wednesday started off with light breezes, which will become stronger trade winds into Thursday, with moderately strong winds continuing through the week…into next week. The strongest winds Wednesday morning were on the light side, with many calm observations noted. All coastal areas had less than 10 mph winds blowing just after sunrise. As we’ve moved into the afternoon hours, those trade winds began their anticipated strengthening. As of 12 noon, we saw that the island of Maui had the strongest gusts…topping out at 27 mph at Maalaea Bay, and 28 mph at the Kahului airport. By 5pm, the strongest gust was 30 mph Maalaea Bay.
As this weather map shows, we have two high pressure systems more or less to our northeast. One is moving northeast away from the islands, while the other is moving towards us. The tail-end of a cold front is dissipating, which will allow the high pressure ridge to our northeast, to spread west and north…prompting our rebounding trade wind activity.
As the trade winds fill back into the HawaiianIsland weather picture now, we’ll see generally windward biased showers falling. As the winds are still on the light side Wednesday however, there may still be a few afternoon showers over the leeward interior sections here and there. Computer models show that there are a couple of showery cloud areas, one close by, which consists of just scattered showery looking patches, and another that may arrive Thursday evening into Friday.
Thus, we’ll see off and on showers falling along the north and east windward coasts and slopes…with generally fair conditions prevailing along our leeward beaches throughout. As the trade wind speeds accelerate, we may begin to see some showers traveling over to the leeward sides, carried over from the windward sides by those trades.
There’s still that same area of showery clouds just to the east of the state today…as they have been the last couple of days. This area has become less impressive looking during the day Wednesday though, becoming more scattered and less likely to provide all that many showers after all. It will however bring some increase in showers to our windward sides Wednesday into the night.
These clouds were already being carried into the Big Island, and will arrive later on the other islands. These clouds will finally get a push as the trade winds pick up now. Here’s a satellite image which shows these patches of clouds. Looking at this larger view, the broader perspective shows high cirrus clouds moving by to our south, with an area of deep convection (thunderstorms) forming directly to the south of our islands Wednesday afternoon
Our north and west facing beaches will see rising surf, as a new northwest swell train of waves arrives this evening into Thursday. The source of this swell was super-typhoon chai-won, which whipped the north western Pacific into a fury last week. This tropical cyclone has moved out of the tropics, having gone through what we call an extra-tropical transition, into a gale low pressure system in the northern latitudes…moving into the Gulf of Alaska now.
All of this strong wind, blowing on the surface of the ocean up there, has generated a swell train of large waves…driving southeast in our direction. The forerunners of this higher than normal early autumn surf, will begin arriving now into Thursday. This in turn will prompt NWS issued high surf advisories for our north and west facing beaches. It will take several days of breaking on our local beaches, before this surf’s influence will gradually weaken during the weekend.
It’s early Wednesday evening here in Kihei, Maui, as I begin writing this last paragraph of this morning’s narrative. At the risk of sounding like a broken record, I see mostly clear skies out the windows here, along with the trade winds blowing. There will finally be that expected modest increase in windward showers, as those folks have been a bit dry lately. I’m about ready to hop in my car for the drive back upcountry, and am looking forward to being up in that cooler air. I’ll get right out on my early evening walk shortly thereafter, then have dinner, do some reading, and hit the hay. I’ll be back online early Thursday morning though, preparing your next new weather narrative from paradise. I hope you have a great Wednesday night until then! Aloha for now…Glenn.
Interesting: Humans have been using wood fires for heating somewhere between 400,000 and a million years. Today, though, using wood involves some compromises. Modern wood-burning systems have much, much lower emissions than old ones, but still can emit more than 100 times as much pollution as oil or gas furnaces, inside and outside your home.
Some communities have even banned woodstoves for this reason. But in other areas, wood is the preferred heating option because of price, lack of availability of other fuels, or simply some individuals’ economic or political commitment to live "off the grid," independent of utilities and energy companies.
If a household has available timber, wood is virtually a free source of energy. Another plus for using wood is that it contributes less to global warming than burning fossil fuels. Oil, gas, coal, and wood all give off carbon dioxide as they burn.
But if a tree is replanted for one that was cut down to use for fuel, it will absorb carbon dioxide as it grows, offsetting the emissions from burning. Of course a full environmental advantage only exists if the wood is harvested sustainably, without damage to the forest environment.
Interesting2: A wind-driven wildfire reported to have spontaneously ignited in a manure pile grew to nearly 10,000 acres on Wednesday as it crept for a second day toward a town north of Los Angeles. The blaze erupted on Tuesday morning on the first day of fall, the traditional start of the Santa Ana wind season in Southern California marked by hot, dry gusts that blow in to coastal mountains, foothills and canyons from the deserts to the east.
The so-called Guiberson Fire, the most menacing of several wildland blazes flaring across the region, had charred at least 9,700 acres of tinder-dry grasslands and brush as it advanced on the outskirts of Moorpark, a community of 45,000 people about 30 miles north of Los Angeles.
The extreme fire weather comes as Los Angeles County still battles its worst fire ever. The Station Fire that broke out a month ago has destroyed more than 160,000 acres and 89 homes and killed two firefighters.
In the latest fire, about 1,000 homes, most of them in Moorpark, were immediately threatened by the flames, said Bill Nash, a Ventura County Fire Department spokesman. Hundreds of people have been advised to leave their homes, but no dwellings have been lost.
Four firefighters have been slightly injured since the blaze erupted on Tuesday morning, ignited, according to the Los Angeles Times and local TV, by the spontaneous combustion of a manure pile in triple-digit heat.
The rolling hills in the area are dotted by ranches and fruit and avocado orchards. Nearly 900 firefighters were assembled to battle the blaze, backed by an aircraft arsenal that includes water-dropping helicopters and several air tankers equipped to drop water or fire retardant chemicals.
"We’re hitting it with everything we’ve got," Nash said, adding that vegetation fueling the blaze in extremely low humidity "will burn just as fast as the wind will push it." The flames were being fanned by gale-force wind gusts, with strong, steady winds forecast for Wednesday.
Interesting3: A plant that lives along muddy waterways in Asia has inspired a NASA team to develop a special coating to prevent dirt and even bacteria from sticking to and contaminating the surfaces of spaceflight gear. Researchers at NASA’s Goddard Space Flight Center in Greenbelt, Md., are developing a transparent coating that prevents dirt from sticking in the same way a lotus plant sheds water — work begun through collaboration with Northrop Grumman Electronics Systems, Linthicum, Md., and nGimat Corporation, Atlanta, Ga.
Although a lotus leaf appears smooth, under a microscope, its surface contains innumerable tiny spikes that greatly reduce the area on which water and dirt can attach. "If you splash lotus leaves with water, it just beads up and rolls off, indicating they have a special hydrophobic or water-repelling ability," said Eve Wooldridge, the James Webb Space Telescope (JWST) Project Contamination and Coatings Lead at Goddard.
"This ability also prevents dust from adhering to the leaves." This special quality is what the NASA team is attempting to replicate to prevent dirt from accumulating on the surfaces of spacesuits, scientific instruments, robotic rovers, solar array panels and other hardware used to gather scientific data or carry out exploratory activities on other objects in the solar system. The trick is developing a coating that can withstand the harsh space environment.
Interesting4: New species are not just discovered in exotic locales—even places as urban as California still yield discoveries of new plants and animals. Academy scientists recently named a new species of chimaera, an ancient and bizarre group of fishes distantly related to sharks, from the coast of Southern California and Baja California, Mexico.
The new species, the Eastern Pacific black ghostshark (Hydrolagus melanophasma), was described in the September issue of the international journal Zootaxa by a research team including Academy Research Associates David Ebert and Douglas J. Long.
Additional co-authors included Kelsey James, a graduate student at Moss Landing Marine Laboratories, and Dominique Didier from Millersville University in Pennsylvania. This is the first new species of cartilaginous fish to be described from California waters since 1947.
Chimaeras, also called ratfish, rabbitfish, and ghostsharks, are perhaps the oldest and most enigmatic groups of fishes alive today. Their closest living relatives are sharks, but their evolutionary lineage branched off from sharks nearly 400 million years ago, and they have remained an isolated group ever since.
Like sharks, chimaeras have skeletons composed of cartilage and the males have claspers for internal fertilization of females. Unlike sharks, male chimaeras also have retractable sexual appendages on the forehead and in front of the pelvic fins and a single pair of gills.
Most species also have a mildly venomous spine in front of the dorsal fin. Chimaeras were once a very diverse and abundant group, as illustrated by their global presence in the fossil record.
They survived through the age of dinosaurs mostly unchanged, but today these fishes are relatively scarce and are usually confined to deep ocean waters, where they have largely avoided the reach of explorers and remained poorly known to science.
This new species belongs to the genus Hydrolagus, Latin for ‘water rabbit’ because of its grinding tooth plates reminiscent of a rabbit’s incisor teeth. This new species was originally collected as early as the mid 1960s, but went unnamed until this year because its taxonomic relationships were unclear.
A large blackish-purple form, Hydrolagus melanophasma (melanophasma is Latin for ‘black ghost’), is found in deep water from the coast of Southern California, along the western coast of Baja California, and into the Sea of Cortez (Gulf of California).
This species is known from a total of nine preserved museum specimens, and from video footage taken of it alive by a deep-water submersible in the Sea of Cortez.
Interesting5: Vaccinations against flu for the 2010 influenza season in the southern hemisphere should also contain viruses against the current pandemic H1N1 virus, the World Health Organization said on Wednesday. The WHO is currently coordinating the production of vaccines against pandemic H1N1, known as swine flu, for this year’s influenza season in the northern hemisphere, which will start in November as the northern winter approaches.
But in early guidance to health authorities and vaccine makers, it said vaccines should contain the pandemic H1N1 virus plus two seasonal flu strains likely to circulate next year. The WHO declared that swine flu was a global pandemic in June after it was detected in April.
"Outbreaks subsequently occurred in all regions of the world and by July pandemic A (H1N1) was the predominant influenza virus circulating in many countries in the Americas, Asia, Europe and Oceania," it said in a note on its website.
It said it was too soon to say whether vaccines next year should comprise a single shot with all three viruses or whether there should be separate shots for pandemic and seasonal flu.
It said it would give guidance on this issue after its Strategic Advisory Group of Experts, which makes recommendations on immunization, considers the question in late October.
The pandemic H1N1 virus is becoming much more common than seasonal H1N1 strains that have also been circulating, it said. The WHO has said the swine flu pandemic could affect one third of the world’s nearly seven billion people.
It is so infectious that most countries have stopped gathering statistics on how many people have caught it, but in the vast majority of cases so far the symptoms have been mild.
Interesting6: In a new study, Clemson University researchers have concluded that the number of hurricanes and tropical storms in the Atlantic Basin is increasing, but there is no evidence that their individual strengths are any greater than storms of the past or that the chances of a U.S. strike are up. Robert Lund, professor of mathematical sciences at Clemson, along with colleagues Michael Robbins and Colin Gallagher of Clemson and QiQi Lu of Mississippi State University, studied changes in the tropical cycle record in the North Atlantic between 1851 and 2008.
“This is a hot button in the argument for global warming,” said Lund. “Climatologists reporting to the U.S. Senate as recently as this summer testified to the exact opposite of what we find. Many researchers have maintained that warming waters of the Atlantic are increasing the strengths of these storms.
We do not see evidence for this at all, however we do find that the number of storms has recently increased.” The study represents one of the first rigorous statistical assessments of the issue with uncertainty margins calculated in.
For example, Lund says “there is less than a one in 100,000 chance of seeing this many storms occur since 1965 if in truth changes are not taking place.” He adds, “Hopefully such a rigorous assessment will clear up the controversy and the misinformation about what is truly happening with these storms.”
The study, submitted to the Journal of the American Statistical Association, also found changes in storm pattern records starting around 1935. This was expected at the onset of aircraft reconnaissance, which allowed record-keepers to identify and document storms occurring in the open ocean.
While the study did conclude that more storms are being documented, researchers found no evidence of recent increases in U.S. landfall strike probability of the strongest of hurricanes. Lund notes that “because these types of storms are so uncommon, it will take many more years of data to reliably assess this issue."
Interesting7: Think of the biggest crowd you’ve ever been in – perhaps 50,000 in a sports stadium. Just 6 hours from now there will be that many more people in the world, and another 50,000 in the following 6 hours, and on and on… No wonder that the burgeoning human population is often seen as is the single biggest problem facing our world. There are nearly 7 billion humans alive today, twice as many as there were in 1965, with 75 million more being added each year.
UN predictions say there could be an extra 2 to 4 billion of us by 2050. The planet has never experienced anything like it. Can the world sustain this growing horde? It’s a contentious question. While it is clear that the population cannot go on increasing forever, history is littered with dire but failed predictions of famine and death resulting from over-population.
Most famously, Thomas Malthus warned more than two centuries ago that population would be held in check by rising mortality. What he failed to anticipate was the ability of newly industrialized societies to support large numbers of people. Today, the "population problem" is firmly back on the agenda.
Earlier this year the UK government’s chief scientific adviser John Beddington predicted a population-led global crisis by 2030, and a group of influential billionaires including Bill Gates and George Soros identified overpopulation as the greatest threat facing humanity.
Every time we publish an article in New Scientist detailing yet another of the planet’s environmental woes, readers respond by arguing that the real problem is overpopulation. The population statistics are indeed staggering. Yet the raw numbers hide a multitude of complexities.
Look closely, and it becomes clear that the common-sense assumption that population is the root of all evil is simplistic. For example, while the human population is growing in absolute terms, the rate of growth is slowing – from a peak of 2 per cent in the early 1960s to around 1 per cent today.
In Japan, Russia and many European countries, women are having so few children that populations are shrinking or will do so soon – an unprecedented state of affairs other than in times of war or plague. At the same time, the populations of many of the least developed nations are exploding, with women in some countries giving birth to more than five children on average.
"We are burdensome to the world, the resources are scarcely adequate for us… already nature does not sustain us." So wrote Tertullian, an early Christian, back in the 3rd century. At that time, the world population stood at some 200 million. Eighteen centuries on and with 34 times as many people on the planet, the debate continues.
Posted by Glenn
No Comments
September 22-23, 2009
Air Temperatures – The following maximum temperatures were recorded across the state of Hawaii Tuesday afternoon:
Lihue, Kauai – 84
Honolulu, Oahu 89
Kaneohe, Oahu – 85
Kahului, Maui – 86
Hilo, Hawaii – 84
Kailua-kona – 87
Air Temperatures ranged between these warmest and coolest spots near sea level around the state – and on the highest mountains…at 5 p.m. Tuesday evening:
Port Allen, Kauai – 86F
Hilo, Hawaii – 78
Haleakala Crater – 55 (near 10,000 feet on Maui)
Mauna Kea summit – 45 (near 14,000 feet on the Big Island)
Precipitation Totals – The following numbers represent the largest precipitation totals (inches) during the last 24 hours on each of the major islands, as of Tuesday afternoon:
0.02 Poipu, Kauai
0.03 Kahuku, Oahu
0.00 Molokai
0.00 Lanai
0.00 Kahoolawe
0.01 Puu Kukui, Maui
0.40 Waiakea Uka, Big Island
Marine Winds – Here’s the latest (automatically updated) weather map showing a weak 1019 millibar high pressure system to the northeast, with its ridge extending southwest to a point just north of the islands. This will keep our trade winds on the light side, increasing later Wednesday into Thursday.
Satellite and Radar Images: To view the cloud conditions we have here in Hawaii, please use the following satellite links, starting off with this Infrared Satellite Image of the islands to see all the clouds around the state during the day and night. This next image is one that gives close images of the islands only during the daytime hours, and is referred to as a Close-up visible image. This next image shows a larger view of the Pacific…giving perspective to the wider ranging cloud patterns in the Pacific Ocean. Finally, here’s a Looping IR satellite image, making viewable the clouds around the islands 24 hours a day. To help you keep track of where any showers may be around the islands, here’s the latest animated radar image.
Hawaii’s Mountains – Here’s a link to the live webcam on the summit of near 14,000 foot Mauna Kea on the Big Island of Hawaii. The tallest peak on the island of Maui is the Haleakala Crater, which is near 10,000 feet in elevation. These two webcams are available during the daylight hours here in the islands…and when there’s a big moon rising just after sunset for an hour or two! Plus, during the nights and early mornings you will be able to see stars, and the sunrise too…depending upon weather conditions.
Tropical Cyclone activity in the eastern and central Pacific – Here’s the latest weather information coming out of the National Hurricane Center, covering the eastern north Pacific. You can find the latest tropical cyclone information for the central north Pacific (where Hawaii is located) by clicking on this link to the Central Pacific Hurricane Center. Here’s a tracking map covering both the eastern and central Pacific Ocean. A satellite image, which shows the entire ocean area between Hawaii and the Mexican coast…can be found here.
Aloha Paragraphs

Today is the first day of Autumn 2009!
Light winds prevailed Tuesday, which will begin rebounding again later Wednesday into Thursday. As the trade winds pick up in strength later on Wednesday, we’ll continue the pleasant start to our autumn season. These trade winds will remain active through the rest of this week, right on into the first part of next week.
There will be a few showers around, falling along the windward sides generally. As we grade back into a typical trade wind weather pattern later on Wednesday going forward, most of the showers that fall, will end up along the windward sides. An upper level trough of low pressure may keep above average showers falling Friday into the upcoming weekend.
There’s an area of showery clouds just to the east of the state…as they have been the last 24+ hours. This area will bring an increase in showers to our windward sides later on Wednesday. Here’s a satellite image which shows these patches of clouds. As the trade winds kick up later Wednesday into Thursday…they will help to carry these showers to us. By the way, that same satellite picture shows lots of high cirrus clouds down to our south, which could easily shift northward over us with time.
The big news this week will be the arrival of an early season swell along our north and west facing beaches. The source of this swell was super-typhoon Chai-won, which whipped the north western Pacific into a fury last week. This tropical cyclone has moved out of the tropics, having gone through what we call an extratropical transition, into a storm low pressure system in the northern latitudes. All of this strong wind, blowing on the surface of the ocean up there, has generated a swell train of large waves…driving southeast in our direction.
This higher than normal, early autumn surf will begin arriving late Wednesday evening, into Thursday. This in turn will prompt NWS issued high surf advisories for our north and west facing beaches. It will take several days of pounding on our local beaches, before this surf’s influence will gradually weaken during the upcoming weekend. Our local surfing community will love to see this early season surf coming. All that would be needed to have this surf event qualify as classic…would be some light to moderately strong offshore winds. The trade winds will be blowing instead, adding chop to the wave faces.
It’s early Tuesday evening here in Kihei, Maui, as I begin writing this last paragraph of today’s narrative. Looking out the window here on the south coast, there’s just the usual partly cloudy conditions, although with lots of blue around too. The trade winds are beginning to blow already it looks like, but will gain a further toe hold in our Hawaiian Island weather picture tomorrow into Thursday. I’ll be back early Wednesday morning with your next new weather narrative, I hope you have a great Tuesday night until then! Aloha for now…Glenn.
Interesting: Public smoking bans appear to significantly reduce the risk of heart attacks, particularly among younger individuals and nonsmokers, according to a new study published in the September 29, 2009, issue of the Journal of the American College of Cardiology. Researchers find that smoking bans can reduce the number of heart attacks by as much as 26 percent per year.
"Even breathing in low doses of cigarette smoke can increase one’s risk of heart attack," said David Meyers, M.D., M.P.H., professor of Cardiology and Preventive Medicine, University of Kansas School of Medicine and lead investigator of the study, which is the most comprehensive analysis of related studies to date.
"Public smoking bans seem to be tremendously effective in reducing heart attack and, theoretically, might also help to prevent lung cancer and emphysema, diseases that develop much more slowly than heart attacks.
The cardiac benefits increased with longer ban duration." According to projections by the authors, a nationwide ban on public smoking could prevent as many as 154,000 heart attacks each year.
These findings are particularly important in light of mounting evidence that second-hand smoke exposure is nearly as harmful to the heart as chronic active smoking. Direct smoking doubles the risk of heart attack. Second hand smoke increases the risk by 30 percent.
"Interestingly, public smoking bans had a stronger effect in reducing heart attacks among women and younger individuals, which may be explained, in part, because younger people tend to frequent clubs, restaurants and bars where smoking is a likely part of the social scene," said Dr. Meyers.
"Heavily exposed people like those working in the entertainment or hospitality industries are likely to accrue the greatest benefit from smoking bans." Dr. Meyers adds that smoking remains the leading preventable risk factor for heart attack.
Secondhand smoke is thought to increase the likelihood of a heart attack by making the blood "sticky" and more prone to clotting, reducing the amount of "good" (HDL) cholesterol in the body, and putting individuals at greater risk for dangerous heart rhythms, among other factors.
Interesting2: Thin friends who eat a lot could put your waistline at risk, according to a new study in the Journal of Consumer Research, which examines how other peoples’ weight and food choices influence how much we eat. "Obesity is obviously a tremendous public health concern," write authors Brent McFerran, Darren W. Dahl (both University of British Columbia), Gavan J. Fitzsimons (Duke University), and Andrea C. Morales (Arizona State University).
"We decided to investigate how someone’s size and food choices could influence how much the people around them eat." The researchers recruited 210 college students to participate in a study that was ostensibly about movie watching.
The participants were told they would be paired with another student taking place in the study. The other student was actually a member of the research team whose natural build was thin (size 0, 105 pounds). But at times this same researcher donned an "obesity prosthesis," which made her appear to be a size 16 and 180 pounds.
All of the students were offered snacks while viewing film clips. The undercover researcher was served first, and helped herself to either a large or small serving before the student participant was offered the same bowl of food.
In all cases, the amount of food the students accepted was influenced by the portion size chosen by the undercover researcher, regardless of her size. "Most participants took a portion similar to what the researcher served herself," the authors explain.
"However, it is clear that how much food each person took, and how much they ate depended on whether their companion was thin or obese." Participants tended to mimic the thin companion’s portion sizes.
But when they presumed the researcher to be obese, the participants adjusted the amounts they ate. "This indicates that people are influenced, even without being aware of it, by other people’s portion choices," the authors write.
"Our findings indicate that the size of the person you dine with matters much less than the size of the meal they order," the authors write. "If a heavy-set colleague eats a lot, you are likely to adjust your behavior and eat less. But a thin friend who eats a lot may lead you to eat more than you normally would."
Interesting3: Scientists from six European countries have developed a new computer system, called DRIVSCO, that allows vehicles to learn from the behavior of their drivers at the wheel, in such a way that they can detect if a driver presents an “unusual behavior” in a curve or an obstacle on the road and generates signals of alarm which warn him in time to react. Unlike other similar projects, DRIVSCO goes far beyond a computer vision system for driving assistance.
The concept investigated was how to get that a car learns from the user’s driving facing a curve or an approaching intersection, a pedestrian or another vehicle. Regardless the type of driving of the driver, sporty or conservative (as it adapts to his driving), the system obtains a driving behavior pattern.
Thus, during night driving, if the vehicle detects a deviation in his way of driving in face of a curve, it interprets that it is due t the lack of visibility of the driver (as the driver has a limited visibility of the low beams field, whereas the car’s night vision system is much more powerful and has a longer range).
Therefore, it generates signals of alarm to warn the driver of his “unusual behavior when approaching a curve”, or the detection of a potentially dangerous object, for instance.
The persons in charge of this project state that 42 per cent of fatal traffic accidents happen at night, according to the data of the European Car Council, “an extremely worrying figure if we consider that traffic drops about a 60% during night hours”.
This is due, among other factors, to the reduced visibility during night driving. The Spanish representation in this project fell on a research group of the Department of Computer Architecture and Technology of the University of Granada (Spain) led by professor Eduardo Ros Vidal.
DRIVSCO also has the participation of scientists from Germany (University of Göttingen, University of Münster and the company Hella & Hueck), Denmark (University of Southern Denmark), Lithuania (University Vytautas Magnus), Belgium (Catholic University of Leuven) and Italy (University of Geneva).
The research group of the University of Granada has developed a system of artificial vision (analysis of the scenario) in an only chip. Such device receives input pictures and produces a first “interpretation of the scenario” in terms of depth (3D vision), local movement, image lines, etc, everything in an only electronic chip.
This system can be assembled in different types of vehicles in future. In addition, they have used a “reconfigurable hardware”, so that the system can adapt itself to new field of application.
Interesting4: This Saturday, Sept. 26, is the 16th annual National Public Lands Day, a day to celebrate our nation’s parks and join the effort to make them even better. To celebrate this historic day, entrance to all 391 national parks around the country is free for the day! National Public Lands Day is the nation’s largest hands-on volunteer effort to improve and enhance the public lands that we all enjoy (and so often take for granted.)
In 2008, about 120,000 volunteers built trails and bridges, removed trash and invasive plants, and planted over 1.6 million trees in parks around the country. More efforts are underway this year.
Check out the National Park Service listings to find out what programs will be going on at your local national park. Most are offering volunteer opportunities as well as a sneak peek of the new PBS film by Ken Burns, "The National Parks – America`s Best Idea" premiering Sunday on PBS.
You don’t have to volunteer to enjoy the free fees. So if volunteering is not an option, don’t worry, just grab the kids and head out to your favorite national park this weekend. It’s a free, fun and green activity you can all enjoy as a family.
But remember, volunteering is not just good for you and for the park, it’s good for your health, too. So there’s never been a better time to get out there!
Interesting5: A federal district court ruling in Montana today returned Endangered Species Act protections to the Yellowstone grizzly bear population. In the case, brought by the Greater Yellowstone Coalition, Judge Donald Molloy ruled that inadequate regulatory mechanisms were put in place to manage the bears after federal protections were dropped in early 2007, and that U.S. Fish and Wildlife Service (FWS) failed to address the loss of an essential food source for the bears, whitebark pine seeds.
The Natural Resources Defense Council (NRDC) and six other groups, represented by Earthjustice, have a similar case pending in Idaho. For years, NRDC has been vigorously engaged in efforts to protect Yellowstone’s grizzly bears and whitebark pine.
Whitebark pine forests are being decimated throughout their range by an array of threats that have emerged in high elevation environments as a result of climate change.
Researchers worry that the trees are being driven to functional extinction, radically altering some of the continent’s most iconic landscapes and eliminating a crucial food source for Yellowstone’s grizzly bears. NRDC petitioned to have the tree added to the federal Endangered Species List in December 2008.
Following is a statement from Louisa Willcox, senior wildlife advocate for NRDC: "This is a chance to hit the reset button and get the right policies in place before it’s too late. As we lose whitebark pine, we need to redouble efforts to anticipate and reduce conflicts with people: that means making sure people keep clean camps and yards, carry bear spray, and are prepared to stay safe in grizzly country."
Posted by Glenn
1 Comment
September 21-22, 2009
Air Temperatures – The following maximum temperatures were recorded across the state of Hawaii Monday afternoon:
Lihue, Kauai – 81
Honolulu, Oahu 89
Kaneohe, Oahu – 85
Kahului, Maui – 85
Hilo, Hawaii – 84
Kailua-kona – 87
Air Temperatures ranged between these warmest and coolest spots near sea level around the state – and on the highest mountains…at 5 p.m. Monday evening:
Honolulu, Oahu – 86F
Hilo, Hawaii – 78
Haleakala Crater – 52 (near 10,000 feet on Maui)
Mauna Kea summit – 48 (near 14,000 feet on the Big Island)
Precipitation Totals – The following numbers represent the largest precipitation totals (inches) during the last 24 hours on each of the major islands, as of Monday afternoon:
0.43 Mount Waialaele, Kauai
0.91 Oahu Forest NWR, Oahu
0.01 Molokai
0.04 Lanai
0.14 Kahoolawe
0.46 Ulupalakua, Maui
0.03 Glenwood, Big Island
Marine Winds – Here’s the latest (automatically updated) weather map showing high pressure systems far to the northwest and northeast, with a ridge still north of the state…which translates to light trade winds Monday into Tuesday.
Satellite and Radar Images: To view the cloud conditions we have here in Hawaii, please use the following satellite links, starting off with this Infrared Satellite Image of the islands to see all the clouds around the state during the day and night. This next image is one that gives close images of the islands only during the daytime hours, and is referred to as a Close-up visible image. This next image shows a larger view of the Pacific…giving perspective to the wider ranging cloud patterns in the Pacific Ocean. Finally, here’s a Looping IR satellite image, making viewable the clouds around the islands 24 hours a day. To help you keep track of where any showers may be around the islands, here’s the latest animated radar image.
Hawaii’s Mountains – Here’s a link to the live webcam on the summit of near 14,000 foot Mauna Kea on the Big Island of Hawaii. The tallest peak on the island of Maui is the Haleakala Crater, which is near 10,000 feet in elevation. These two webcams are available during the daylight hours here in the islands…and when there’s a big moon rising just after sunset for an hour or two! Plus, during the nights and early mornings you will be able to see stars, and the sunrise too…depending upon weather conditions.
Tropical Cyclone activity in the eastern and central Pacific – Here’s the latest weather information coming out of the National Hurricane Center, covering the eastern north Pacific. You can find the latest tropical cyclone information for the central north Pacific (where Hawaii is located) by clicking on this link to the Central Pacific Hurricane Center. Here’s a tracking map covering both the eastern and central Pacific Ocean. A satellite image, which shows the entire ocean area between Hawaii and the Mexican coast…can be found here.
Aloha Paragraphs

It won’t be long before the whales return
Once again, storminess in the middle latitudes of the north Pacific is having some bearing in our local weather picture here in Hawaii, as we launch off into this new work week. The first noticeable influence will be the somewhat lighter trade winds, which could slip into the light and variable realms, especially on Kauai and perhaps Oahu. Those storms, with their associated cold fronts, as shown on this weather map, are trying to puncture the trade wind producing ridge of high pressure to the north of the Aloha state.
The cold front best in line to take care of this, has actually split the ridge, and may push a bit further southward into the northern tropics. This in turn will weaken the ridge, and shove it down closer to the Kauai end of the state. This is the reason for the well advertised softening of the trade winds now. Depending upon just how much success this front has in its intrusion into the tropics, will help to determine how close the ridge gets to us…and just how much our local wind speeds falter.
Before we get to the larger surf that will arrive by Thursday, let’s explore what we might find in terms of precipitation this week. It goes without saying that while the trade winds are blowing, we’ll continue to see some passing shower activity along our windward coasts and slopes. This shouldn’t be particularly heavy, although we could use the water, as there aren’t any significant upper level troughs of low pressure…which would enhance these showers.
Meanwhile, with the lighter wind flow, we can expect the islands to heat up, along with those localized onshore flowing sea breezes. These will carry moisture up the leeward slopes, where that invisible moisture condenses out into afternoon convective cumulus clouds. These clouds too, will likely provide a few showers, as they began to do Sunday afternoon. Then, later in the week, as the ridge migrates northward, we’ll find strengthening trade winds returning to Hawaii…with the moisture being carried from off the ocean towards our windward sides…generally during the night and early morning hours.
Taking another look at that weather map above, we see a big ol’ storm spinning far to the northwest. This of course is what’s left of supertyphoon Chai-won, which whipped the north western Pacific into a fury last week. This tropical cyclone has moved out of the tropics, having gone through what we call an extratropical transition into a storm low pressure system in the northern latitudes…checking in at a very low 962 millibars early Monday afternoon. There have been hurricane force winds revolving around this storm during the last 24+ hours. All of this strong wind, blowing on the surface of the ocean up there…has generated a swell train of large waves driving southeast in our direction.
This higher than normal, early autumn surf will begin arriving late Wednesday evening, or Thursday. This in turn will definitely prompt NWS issued high surf advisories for our north and west facing beaches. It will take several days of pounding on our local beaches, before this surf’s influence will gradually weaken during the upcoming weekend. Our local surfing community will love to see this early season surf coming. All that would be needed to have this surf event qualify as classic…would be some light to moderately strong offshore winds. The trade winds will be blowing instead, adding some chop to the wave faces though.
It’s early Monday evening here in Kihei, Maui, as I begin writing this last paragraph of today’s narrative. Looking out the window here in Kihei, before I take the drive back upcountry to Kula, it’s almost totally clear…like in no clouds! It’s one of those unique days when clouds remain missing in action. The only clouds that I see at around 530pm are a few up on the slopes of the Haleakala Crater…and a couple of minor ones over the West Maui Mountains. ~~~ I’m pretty clear about everything in terms of the outlook above, except for this one cloud area, having to do with a weak trough of low pressure out to the east of Hawaii. This satellite image shows it well, and I’ll have more to say about it early Tuesday morning, when I return with your next new weather narrative then. I hope you have a great Monday night until then! Aloha for now…Glenn.
Monday is World Peace Day 2009…here’s a nice website acknowledging it.
Interesting: As world leaders gather for key climate talks here, small island nations Monday warned they were running out of time with rising seas threatening to wipe them off the map. Spread across the Earth’s oceans, the planet’s tiniest members grouped as part of the Alliance of Small Islands States (AOSIS) are hoping to make their voices heard 100 days before UN-hosted climate talks in Copenhagen.
Climate negotiators have spent the last two years working toward a make-or-break summit in Copenhagen this December, expected to ink new targets for global emissions beyond 2012, when the Kyoto Protocol expires.
AOSIS has dubbed itself the "moral voice of the negotiations" while the European Union prides itself on taking the lead, with member states agreeing to make 20 percent cuts in CO2 emissions by 2020 from 1990 levels.
EU leaders have said they are ready to commit to 30 percent cuts if the rest of the world does likewise to attain the overall goal of restricting global warming to two degrees Celsius. But such a cut in rising temperatures is still too warm for many low-lying and island nations.
"Small island countries need to say that it is tantamount to declaring their extinction, because the consequences of going to a two degree Celsius increase are such that whole nations are to disappear," UN climate negotiator Yvo de Boer told AFP.
Instead AOSIS is demanding that the new Copenhagen climate agreement limit temperature increases to as far below 1.5 degrees Celsius as possible, drumming home their mantra "1.5 to stay alive."
The group’s president, Dessima Williams, who is also the permanent representative for Grenada to the United Nations, said last week: "More recent science shows that we are on track for a sea level rise of at least one and maybe two meters by the end of the century.
"That would spell disaster, even disappearance, for some of our islands."She said even just a 0.8 rise on the world thermometer was having dire consequences for island nations already witnessing severe coastal erosion, floods, dying coral reefs and extreme weather.
The alliance is urging industrialized nations to cut gas emissions by 2020 by 45 percent compared with 1990 levels. "Sometimes in this debate like in many others you forget what is all about; people forget the main driver for ecosystem losses and for the disappearance of species is climate change," de Boer told AFP Monday in an interview.
UN chief Ban Ki-moon on Monday joined other politicians and celebrities to formally launch New York climate week, which will Tuesday host a major UN climate summit he has convened. Last week Ban pressed world leaders to publicly commit here on Tuesday to reaching a global climate change deal in Copenhagen.
"The current slow pace of the negotiations is a matter of deep concern," Ban said. "We want world leaders to show they understand the gravity of climate risks, as well as the benefits of acting now."De Boer said he was eagerly awaiting what Chinese President Hu Jintao would have to say about climate change on Tuesday.
"I have very high expectations on what President Hu will be announcing in the UN tomorrow; it’s going to be ambitious," he said. He predicted that China could unveil policy measures that would make Beijing a "world leader in addressing climate change."
The United States, which consumes 25 percent of the world’s energy and is the world’s biggest polluter, is also in the dock with many fearing Washington is too preoccupied with other problems to devote much time to battling global warming.
Climate negotiators from the world’s 17 largest developing and developed economies met in Washington on Thursday and Friday for talks described by the top US climate envoy as a "pretty full ventilation of views." "I think there was some narrowing of differences," said Todd Stern, the US special envoy for climate change. But he acknowledged "there are plenty of differences that remain."
Interesting2: A new study led by the University of Colorado at Boulder indicates most of the world’s low-lying river deltas are sinking from human activity, making them increasingly vulnerable to flooding from rivers and ocean storms and putting tens of millions of people at risk. While the 2007 Intergovernmental Panel on Climate Change report concluded many river deltas are at risk from sea level rise, the new study indicates other human factors are causing deltas to sink significantly.
The researchers concluded the sinking of deltas from Asia and India to the Americas is exacerbated by the upstream trapping of sediments by reservoirs and dams, man-made channels and levees that whisk sediment into the oceans beyond coastal floodplains, and the accelerated compacting of floodplain sediment caused by the extraction of groundwater and natural gas.
Scientists have found the "Rosetta Stone" of supervolcanoes, those giant pockmarks in the Earth’s surface produced by rare and massive explosive eruptions that rank among nature’s most violent events. The eruptions produce devastation on a regional scale — and possibly trigger climatic and environmental effects at a global scale.
Interesting3: A fossil supervolcano has been discovered in the Italian Alps’ Sesia Valley by a team led by James E. Quick, a geology professor at Southern Methodist University. The discovery will advance scientific understanding of active supervolcanoes, like Yellowstone, which is the second-largest supervolcano in the world and which last erupted 630,000 years ago.
A rare uplift of the Earth’s crust in the Sesia Valley reveals for the first time the actual "plumbing" of a supervolcano from the surface to the source of the magma deep within the Earth, according to a new research article reporting the discovery.
The uplift reveals to an unprecedented depth of 25 kilometers the tracks and trails of the magma as it moved through the Earth’s crust. Supervolcanoes, historically called calderas, are enormous craters tens of kilometers in diameter.
Their eruptions are sparked by the explosive release of gas from molten rock or "magma" as it pushes its way to the Earth’s surface. Calderas erupt hundreds to thousands of cubic kilometers of volcanic ash.
Explosive events occur every few hundred thousand years. Supervolcanoes have spread lava and ash vast distances and scientists believe they may have set off catastrophic global cooling events at different periods in the Earth’s past.
Sesia Valley’s caldera erupted during the "Permian" geologic time period, say the discovery scientists. It is more than 13 kilometers in diameter.
"What’s new is to see the magmatic plumbing system all the way through the Earth’s crust," says Quick, who previously served as program coordinator for the Volcano Hazards Program of the U.S. Geological Survey.
"Now we want to start to use this discovery. We want to understand the fundamental processes that influence eruptions: Where are magmas stored prior to these giant eruptions? From what depth do the eruptions emanate?"
Sesia Valley’s unprecedented exposure of magmatic plumbing provides a model for interpreting geophysical profiles and magmatic processes beneath active calderas. The exposure also serves as direct confirmation of the cause-and-effect link between molten rock moving through the Earth’s crust and explosive volcanism.
"It might lead to a better interpretation of monitoring data and improved prediction of eruptions," says Quick, lead author of the research article reporting the discovery. The article, "Magmatic plumbing of a large Permian caldera exposed to a depth of 25 km.," appears in the July issue of the peer-reviewed journal "Geology."
Calderas, which typically exhibit high levels of seismic and hydrothermal activity, often swell, suggesting movement of fluids beneath the surface. "We want to better understand the tell-tale signs that a caldera is advancing to eruption so that we can improve warnings and avoid false alerts," Quick says.
Interesting4: In the open ocean, species of large predatory fish will swim and hunt for food at various depths, which leads to unique diets in these fish. Oceanographers and geologists in the School of Ocean and Earth Science and Technology (SOEST) at the University of Hawaii at M?noa (UHM) and colleagues have found that those fish that hunt deeper in the open ocean have higher mercury concentrations than those that feed near the surface of the ocean because their deep water food has higher mercury.
This research was detailed in the August 18th early edition of the prestigous journal the Proceedings of the National Academy of Sciences. Mercury is a naturally-occurring trace element distributed throughout the Earth’s oceans, land and air.
The general public is interested in mercury levels in fish because the organic form, methylmercury, can be toxic at elevated levels if ingested by humans and animals. Mercury enters open ocean food webs, where it bio-accumulates, leading to higher levels in large predatory animals.
Researchers looking at mercury levels in the open ocean have indicated that deeper waters have elevated levels relative to the surface waters. "Building on this information, we thought that deeper-dwelling open ocean animals might have more mercury, as well as the predatory fishes that feed on them," says Anela Choy, a Department of Oceanography Graduate Student at UHM and lead author in this study.
This was indeed the case, and the results of their work show that large pelagic fish like bigeye tuna and swordfish that feed deeper in the ocean have elevated total mercury levels relative to their shallower-dwelling counterparts like yellowfin tuna and mahi-mahi.
"We show that this is because the food items that they eat also have varying levels of mercury", continues Choy. "Deeper-living micro-nekton prey (small fishes, squids, and crustaceans) have higher mercury levels relative to more surface-dwelling prey animals.
This is important knowledge for scientists studying animals in the open ocean because it helps them to understand how energy and matter cycle, as well as show who is eating who in the vast, blue water environment. Although not the focus of this study, the results may also help provide information to the fish-consuming public on mercury levels in popular commercial species."
Interesting5: The widespread idea that Mars is red due to rocks being rusted by the water that once flooded the red planet may not be correct. Recent laboratory studies show that red dust may be formed by ongoing grinding of surface rocks and liquid water need not have played any significant role in the formation process.
These findings, which open up the debate about the history of water on Mars and whether it has ever been habitable, have been presented at the European Planetary Science Congress by Dr Jonathan Merrison.
“Mars should really look blackish, between its white polar caps, because most of the rocks at mid-latitudes are basalt. For decades we assumed that the reddish regions on Mars are related to the water-rich early history of the planet and that, at least in some areas, water-bearing heavily oxidized iron minerals are present,” said Dr. Merrison, of the Aarhus Mars Simulation Laboratory, Denmark.
Accurate knowledge of the composition and mineralogy of the planet is vital in understanding the structure and evolution of the near-surface environment and its interaction with the atmosphere, as well as in searching for potential habitats on Mars.
Fine red dust covers Mars’s surface and is even present in Mars’s atmosphere, dominating the weather and sometimes becoming so thick that it plunges the planet into darkness. Even though dust is ubiquitous, we do not fully understand its physical, chemical and geological properties.
In their recent laboratory study, scientists at the Mars Simulation Laboratory have pioneered a novel technique to simulate the sand transport on Mars. They hermetically sealed sand (quartz) samples in glass flasks and mechanically “tumbled” them for several months, turning each flask ten million times.
After gently tumbling pure quartz sand for seven months, almost 10% of the sand had been reduced to dust. When scientists added powdered magnetite, an iron oxide present in Martian basalt, to the flasks they were surprised to see it getting redder as the flasks were tumbled.
“Reddish-orange material deposits, which resemble mineral mantles known as desert varnish, started appearing on the tumbled flasks. Subsequent analysis of the flask material and dust has shown that the magnetite was transformed into the red mineral hematite, through a completely mechanical process without the presence of water at any stage of this process,” said Dr Merrison.
The scientists suspect that, as the quartz sand grains are tumbled around, they get quickly eroded and an alteration of minerals through contact ensues. How exactly this happens needs to be further investigated through more experimental and analytical work.
However, the first experiments show that this process occurs not only in air but also in a dried carbon dioxide atmosphere, i.e. in conditions that perfectly resemble those occurring on Mars. It may also imply that the reddish Martian dust is geologically recent.
Scientists at a new interdisciplinary research institute in Austria are working to uncover how life might evolve with “exotic” biochemistry and solvents, such as sulphuric acid instead of water.
Next Page »


