


Air Temperatures – The following high temperatures (F) were recorded across the state of Hawaii Saturday…along with the low temperatures Saturday
82 – 74 Lihue, Kauai
86 – 74 Honolulu, Oahu
85 – 73 Molokai
mm – mm Kahului AP, Maui
84 – 73 Kona Int’l AP
82 – 68 Hilo AP, Hawaii
Here are the latest 24-hour precipitation totals (inches) for each of the islands as of Saturday evening:
0.92 Mount Waialeale, Kauai
0.63 Pupukea Road, Oahu
0.12 Molokai
0.00 Lanai
0.00 Kahoolawe
0.32 West Wailuaiki, Maui
3.69 Saddle Quarry, Big Island
The following numbers represent the strongest wind gusts (mph) as of Saturday evening:
24 Port Allen, Kauai
38 Kuaokala, Oahu
37 Molokai
33 Lanai
40 Kahoolawe
42 Kahului AP, Maui
31 South Point, Big Island
Hawaii’s Mountains – Here’s a link to the live webcam on the summit of our tallest mountain Mauna Kea (nearly 13,800 feet high) on the Big Island of Hawaii. This webcam is available during the daylight hours here in the islands, and at night whenever there’s a big moon shining down. Also, at night you will be able to see the stars — and the sunrise and sunset too — depending upon weather conditions.
Aloha Paragraphs

A low pressure system far north…with a large swath of high clouds far east

A cold front northwest…which is moving away to the north

Clear to partly cloudy…with cloudy areas here and there

Showers mostly offshore and windward sides
Looping radar image
High Surf Advisory…north and west shores of Kauai, Oahu, Molokai, north shore of Maui, and west shore of the Big Island
Small Craft Advisory…windiest coasts and channels
~~~ Hawaii Weather Narrative ~~~
Broad brush overview: High pressure systems will remain in place far northeast of the islands, providing locally strong and gusty trade winds to the islands. This area of high pressure will weaken Monday and Tuesday, as a cold front passes north of the islands…resulting in lighter trade winds for several days.
Details: The surface high pressure far northeast will strengthen slightly over the next couple of days. Therefore, locally breezy trade winds will prevail across the islands. The trade winds will continue through Sunday, with passing showers along the windward sides. Lee areas of the smaller islands will remain dry…although the Big Island will see afternoon and evening clouds and possible showers.
This surface high pressure area is expected to weaken Monday, as a low pressure system from the west advances east. At the same time, a weakening cold front, associated this low pressure system…will likely pass north of the islands Tuesday. Thus, trade winds will weaken a tad during the early part of the new week. As we move into the middle of the upcoming week…the trades will surge again
Looking ahead: The trailing end of another cold front may reach the islands by the next weekend, with a new strong high pressure system moving into the area far north of the state…behind the front. Thus, we may see the strong and gusty trades remain active right on through the end of the work week. A low aloft and an associated cold front will approach from the northwest next weekend. It’s uncertain whether the front will reach the islands, although it’s likely the trade winds will be disrupted, and the chance of rain will increase next weekend into early the following week.
Here’s a wind profile of the Pacific Ocean – Closer view of the islands / Here’s the vog forecast animation / Here’s the latest weather map
Marine environment details: A large west-northwest swell has begun affecting the islands, which will slowly lower this weekend. Warning and or advisory level surf for exposed north and west facing beaches is expected during this time. A High Surf Warning remains active for north and west shores of most of smaller islands, with the west shores of the Big Island included. A small craft advisory remains active for hazardous seas over Hawaiian waters today.
Surf along east facing shores will remain small and choppy due to the gusty onshore trade winds. Surf will begin to build this weekend, as these winds strengthen locally and upstream of the islands, and may near or reach advisory levels along east facing shores by later Sunday…into early in the new week ahead.
A slight increase in surf along south facing shores is possible today, due to a south-southwest swell from recent activity across the southern Pacific. In addition to this south swell, wrap from the large west-northwest swell will add some to the mix…at select spots along exposed south facing beaches.

Trade wind weather pattern this weekend
Southern California Weather Summary: High pressure and weak offshore flow will bring warmer weather this weekend. Cooler conditions are expected Monday, as a trough of low pressure passes nearby, bringing a slight chance of north slope rain showers…and gusty winds. High pressure will then bring another warming trend to the area through the middle of the new week. A weak cold front may bring a chance of rain and cooler temperatures to the region Friday and next Saturday.

Generally fair weather over Southern California

Mostly clear
World-wide tropical cyclone activity
![]()
>>> Atlantic Ocean: The 2017 hurricane season begins June 1st
Here’s a satellite image of the Atlantic Ocean
>>> Caribbean: The 2017 hurricane season begins June 1st
>>> Gulf of Mexico: The 2017 hurricane season begins June 1st
Here’s a satellite image of the Caribbean Sea…and the Gulf of Mexico
Here’s the link to the National Hurricane Center (NHC)
>>> Eastern Pacific: The 2017 hurricane season begins May 15th
Here’s the NOAA 2016 Hurricane Season Summary for the Eastern Pacific Basin
Here’s a wide satellite image that covers the entire area between Mexico, out through the central Pacific…to the International Dateline.
Here’s the link to the National Hurricane Center (NHC)
>>> Central Pacific: The 2017 hurricane season begins June 1st
Here’s the NOAA 2016 Hurricane Season Summary for the Central Pacific Basin
Here’s a link to the Central Pacific Hurricane Center (CPHC)
>>> Northwest Pacific Ocean: No active tropical cyclones
>>> North and South Indian Oceans / Arabian Sea: No active tropical cyclones
Here’s a link to the Joint Typhoon Warning Center (JTWC)
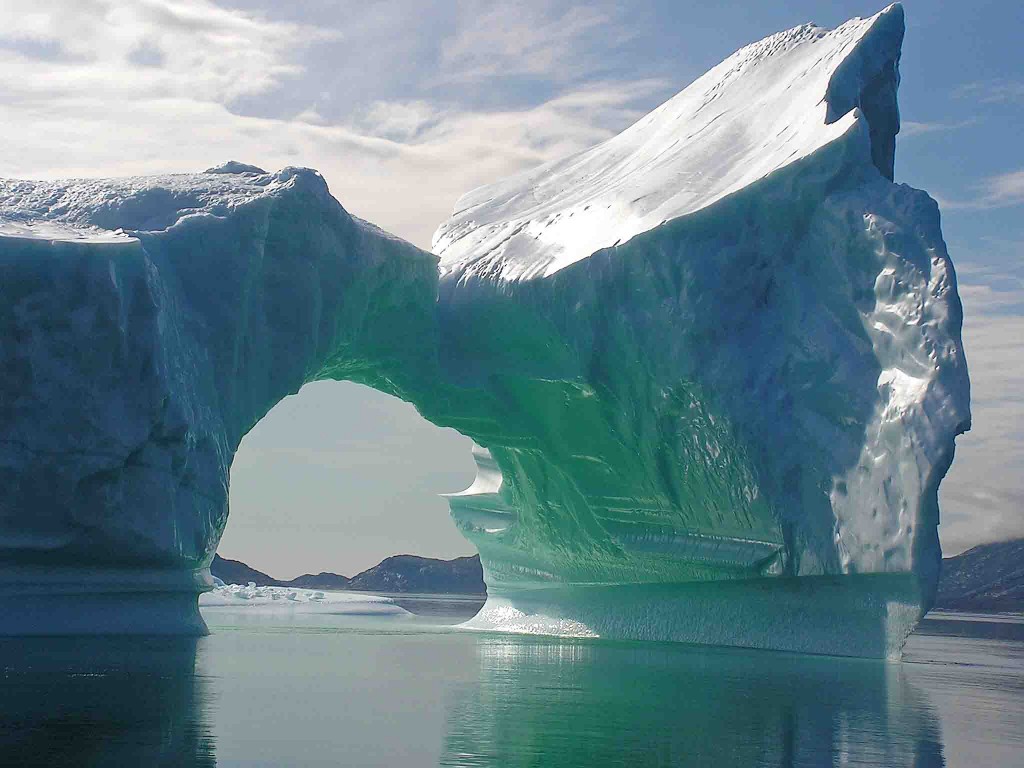
Interesting: Some of Greenland’s coastal ice will be permanently lost by 2100 – The glaciers and ice caps that dot the edges of the Greenland coast are not likely to recover from the melting they are experiencing now, a study has found.
Researchers report in the current issue of the journal Nature Communications that melting on the island passed a tipping point 20 years ago. The smallest glaciers and ice caps on the coast are no longer able to regrow lost ice.
The current study suggests that the melting of Greenland’s coastal ice will raise global sea level by about 1.5 inches by 2100.
The find is important because it reveals exactly why the most vulnerable parts of Greenland ice are melting so quickly: the deep snow layer that normally captures coastal melt water was filled to capacity in 1997. That layer of snow and melt water has since frozen solid, so that all new melt water flows over it and out to sea.
It’s bad news, but not immediate cause for panic, said Ohio State University glaciologist Ian Howat, part of the international research team that made the discovery.
The findings apply to the comparatively small amount of ice along the coast only, he explained—not the Greenland Ice Sheet, which is the second largest ice cache in the world.
“These peripheral glaciers and ice caps can be thought of as colonies of ice that are in rapid decline, many of which will likely disappear in the near future,” said Howat, associate professor of earth sciences at Ohio State. “In that sense, you could say that they’re ‘doomed.’ However, the ice sheet itself is still not ‘doomed’ in the same way. The vast interior ice sheet is more climatologically isolated than the surrounding glaciers and ice caps.
“Also, since this ‘tipping point’ was reached in the late 90’s before warming really took off, it indicates that these peripheral glaciers are very sensitive and, potentially, ephemeral relative to the timescales of response of the ice sheet.”
Were all of Greenland’s coastal ice to melt away at once, global sea level would rise a few inches. For comparison, were the whole Greenland Ice Sheet to melt away at once, global sea level would rise 24 feet.
The problem lies between fresh surface snow and the ice, in a layer of older snow called the firn. Normally, melt water drains through gaps in the firn down to the ice surface, where the bottom layer re-freezes. That’s how glaciers and ice caps grow.
When the firn around Greenland’s edges became fully saturated 20 years ago, it froze through from bottom to top. Since then, there haven’t been any gaps to capture melt water, and the ice hasn’t been able to grow.
At the time, researchers couldn’t have known, because they lacked three things: a high-resolution topographic model of the glaciers, a detailed map of glacier boundaries, and a high resolution numerical model of drainage processes.
Howat provided the first two with his Greenland Ice Mapping Project Digital Elevation Model, which offers 30-meter resolution over the entire Greenland surface. Then his colleagues were able to use that data to boost the resolution of their numerical model and get a better idea of where and how the ice caps and glaciers were losing mass.
They found that, for the last 20 years, mass loss has been exactly equal to the amount of melt water runoff lost to sea. Simulations showed that a frozen firn was the most likely cause.
The Greenland Ice Sheet is subject to the same danger, Howat said, but to a much lesser degree than the isolated bits of ice on its edges.
The real value of the study is that it provides “more evidence of rapid change and how it happens,” he added.
Eliza Says:
Aloha Glenn – A nice morning in upcountry Maui today. The Ag Fest is on over at the Tropical Plantation, and the Upcountry Farmers Market is going on in the parking lot near Longs Pukalani. ~
This good weather is too dry, it seems. There’s been an announcement yesterday for a Stage 1 water restriction. http://mauiwatch.com/2017/04/dws-declares-stage-1-water-shortage-upcountry/
~ Any significant moisture coming in to replenish the reservoirs and water the ground?
Many thanks for all you do – Malama pono – Eliza
~~~ Hi Eliza, good to hear from you there in Pukalani, Maui.
According to my calculations, I don’t see any significant moisture heading for the lower upcountry areas of east Maui through next Friday. There may be a possible chance for more showers next weekend…maybe.
Aloha, Glenn
p.s. thanks for the link!