


Air Temperatures – The following maximum temperatures (F) were recorded across the state of Hawaii Monday…and the low temperatures Monday:
80 – 69 Lihue, Kauai
83 – 73 Honolulu, Oahu
78 – 67 Molokai AP
76 – 69 Kahului AP, Maui
81 – 73 Kailua Kona
85 – 70 Hilo AP, Hawaii
Here are the latest 24-hour precipitation totals (inches) for each of the islands…as of Monday evening:
0.30 Kilohana, Kauai
0.84 Punaluu Stream, Oahu
1.53 Puu Alii, Molokai
0.00 Lanai
0.00 Kahoolawe
12.04 West Wailuaiki, Maui!
3.42 Honaunau, Big Island
The following numbers represent the strongest wind gusts (mph)…as of Monday evening:
32 Poipu, Kauai – NE
32 Kuaokala, Oahu – NE
25 Molokai – N
33 Lanai – NE
35 Kahoolawe – NNE
27 Maalaea Bay, Maui – NNE
25 Upolu AP, Big Island – NE
Hawaii’s Mountains – Here’s a link to the live web cam on the summit of near 13,800 foot Mauna Kea on the Big Island of Hawaii. This web cam is available during the daylight hours here in the islands…and when there’s a big moon shining down during the night at times. Plus, during the nights you will be able to see stars, and the sunrise and sunset too…depending upon weather conditions.
Aloha Paragraphs

A low pressure system over the ocean to the north-northeast…along
with its associated cold front draping southwest from its center

What’s left of a late season cold front remains over the
islands…with impressive thunderstorms far west

Partly cloudy to mostly cloudy, as a diffuse frontal cloud
band remains nearly stationary over the central islands

Showers falling locally…mostly over windward sides
Looping radar image
Small Craft Advisory…Kauai leeward waters, Kauai
Channel, Oahu leeward waters, Kaiwi Channel, Maui
County leeward waters, and Pailolo Channel
~~~ Hawaii Weather Narrative ~~~
Relatively cool northeasterly winds, moderately strong…although locally quite strong and gusty. Here’s the latest weather map, showing high pressure systems to the northwest and far northeast. At the same time, there’s a low pressure system to the north-northeast…with an associated cold front nearly stationary over the eastern islands. The air flow in the rear of the frontal passage is favoring a rather unusual north-northeasterly direction, at least considering the season, bringing a slightly cool air mass into the state. They should strengthen and become northeasterly trade winds over the next several days, before settling into the light to moderately strong realms by the middle of the week…into the upcoming weekend.
Here’s a wind profile…of the offshore waters around the islands – with a closer view
Here’s the Hawaiian Islands Sulfate Aerosol animated graphic – showing vog forecast
Moisture associated with a gradually dissipating front continues to linger over the islands, most of which is impacting windward slopes and coasts…especially those of Maui and the Big Island. As this front is hung up over the eastern part of the state, clouds and off and on showers will continue locally…with more favorable weather conditions occurring over Kauai and Oahu. As the north-northeasterly air flow continues in the rear of the weakening frontal cloud band, we’ll find shower activity continuing along the windward sides for several days. The bulk of this residual shower activity will be focused over the windward sides of Maui and the northern part of the Big Island in places too. The soils in east Maui remain saturated from the recent downpours…necessitating an ongoing flood watch over the entire island. Finally, the models depict yet another late season cold front approaching the state from the northwest by the upcoming weekend…stay tuned.
Marine environment details: Northeasterly trade winds will be strongest today along and north of the weakening frontal boundary across Maui. A small craft advisory /SCA/ remains in effect for the Pailolo and kaiwi channels through midnight, and border line SCA wind conditions are expected over portions of the coastal waters for the next couple of days…especially near the old frontal boundary. Trade winds are forecast to relax later in the week as high pressure weakens north of the state.
Surf along all shores will remain below advisory levels this week. Buoys show that the short period north swell peaked today. Larger seas around SCA levels are being detected at the Pauwela buoy off Maui, likely due to stronger winds and higher combined seas in that area. The north swell will gradually decline through Tuesday.
A small northwest swell will be possible Friday through the upcoming weekend. Buoy observations also show the south swell diminishing…and no other significant southerly swells are predicted this week.
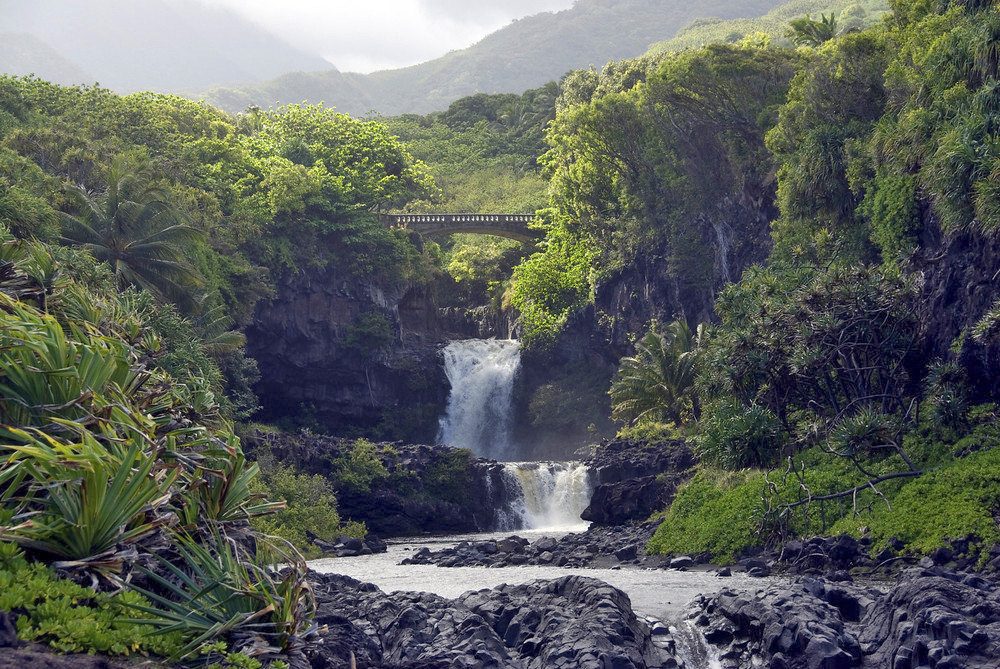
Oheo Gulch (7 pools)…east Maui
Here on Maui – Before sunrise on this Monday morning, we find partly to mostly cloudy skies…along with rain falling in some areas…especially the windward sides. I can see clear skies over towards the Kihei and Wailea areas. Here in upcountry Kula, it has been lightly raining for the last couple of hours, although it seems to have backed-off in the last half hour or so. The air temperature at my weather tower was 60.7F degrees at 530am. At about the same time, it was cloudy in Kahului at the airport, with light rain and an air temperature of 70 degrees, with a 72 degree reading out in Hana, and 41 degrees atop the Haleakala Crater.
– 2pm, under cloudy skies here in Kula, with light rain falling. / 245pm, light almost moderately heavy rain.
– 535pm, under partly to mostly cloudy skies island wide. The showers are still falling locally, although not as numerous or as heavy as last night into early this morning. Today had the look and feel of winter more than spring, at least up here in Kula.
World-wide tropical cyclone activity:
>>> Atlantic Ocean: The last regularly scheduled Tropical Weather Outlook of the 2015 Atlantic hurricane season…has occurred. Routine issuance of the Tropical Weather Outlook will resume on June 1, 2016. During the off-season, Special Tropical Weather Outlooks will be issued if conditions warrant. Here’s the 2015 hurricane season summary
Here’s a satellite image of the Atlantic Ocean
>>> Caribbean Sea: The last regularly scheduled Tropical Weather Outlook of the 2015 Atlantic hurricane season…has occurred. Routine issuance of the Tropical Weather Outlook will resume on June 1, 2016. During the off-season, Special Tropical Weather Outlooks will be issued if conditions warrant.
>>> Gulf of Mexico: The last regularly scheduled Tropical Weather Outlook of the 2015 Atlantic hurricane season…has occurred. Routine issuance of the Tropical Weather Outlook will resume on June 1, 2016. During the off-season, Special Tropical Weather Outlooks will be issued if conditions warrant.
Here’s a satellite image of the Caribbean Sea…and the Gulf of Mexico
Here’s the link to the National Hurricane Center (NHC)
>>> Eastern Pacific: The last regularly scheduled Tropical Weather Outlook of the 2015 North Pacific hurricane season…has occurred. Routine issuance of the Tropical Weather Outlook will resume on May 15, 2016. During the off-season, Special Tropical Weather Outlooks will be issued if conditions warrant. Here’s the 2015 hurricane season summary
Here’s a wide satellite image that covers the entire area between Mexico, out through the central Pacific…to the International Dateline.
Here’s the link to the National Hurricane Center (NHC)
>>> Central Pacific: The central north Pacific hurricane season has officially ended. Routine issuance of the tropical weather outlook will resume on June 1, 2016. During the off-season, special tropical weather outlooks will be issued if conditions warrant. Here’s the 2015 hurricane season summary
Here’s a link to the Central Pacific Hurricane Center (CPHC)
>>> South Pacific Ocean: No active tropical cyclones
>>> North and South Indian Oceans / Arabian Sea: No active tropical cyclones
Here’s a link to the Joint Typhoon Warning Center (JTWC)
Interesting: Middle East drought in historical perspective – A recent study released by the National Aeronautics and Space Administration (NASA) concludes that the current drought that began in 1998 in the eastern Mediterranean Levant – which includes Cyprus, Israel, Jordan, Lebanon, Palestine, Syria, and Turkey – is the region’s worst dry spell since 1100 C.E.
NASA scientists reconstructed our regional drought history by studying records of tree rings, from dead and live specimens, across several Mediterranean countries to determine patterns of dry and wet years over a 900-year time span. Tree rings are good indicators of precipitation since dry years cause thin rings while thick rings show when water was plentiful. They concluded that the years between 1998 and 2012 were drier than any other period, and that the drought was likely caused by humans.
Ben Cook, lead author and climate scientist at NASA’s Goddard Institute for Space Studies and the Lamont Doherty Earth Observatory at Columbia University in New York City, said the range of regional weather events has varied widely over the last millennium, but the past twenty years stand out as extreme, falling outside the range of natural variability.
They also discovered that drought isn’t localized, meaning that if one region is damaged by drought, those conditions are likely to exist throughout the Mediterranean basin. Kevin Anchukaitis, co-author and climate scientist at the University of Arizona in Tucson, said in a statement on the NASA climate change website, “It’s not necessarily possible to rely on finding better climate conditions in one region than another, so you have the potential for large-scale disruption of food systems as well as potential conflict over water resources.”
Large-scale disruption of food systems as well as potential conflict over water resources.
Is anyone listening? Cook stated that the Levant region drought lasting from 1998 to 2012 was about 50% drier than the driest period in the past 500 years, and 10 to 20% drier than the worst drought of the past 900 years.
Last year, as reported by CBC News, researchers at Columbia University and the University of California Santa Barbara found that drought triggered a collapse in agriculture in Syria and the migration of 1.5 million farmers to the cities, straining resources. The water shortage was one of several contributing factors that had worsened the situation in Syria in the lead-up to the outbreak of that country’s devastating civil war in 2011.
Researchers also discovered patterns that are helping to identify underlying causes for drought, which will allow scientists to differentiate droughts made worse by human-induced global warming. Cook said the research – which is part of NASA’s ongoing work to improve the computer models that simulate climate change – supported other studies indicating human causes of extreme climate events.
The North Atlantic Oscillation and the East Atlantic Pattern are two major airflow circulation patterns influence when droughts occur in the Mediterranean, patterns which describe how winds and weather tend to behave given certain ocean conditions. They have periodic phases that tend to steer rainstorms away from the Mediterranean and bring in dryer, warmer air. The resulting lack of rain and higher temperatures, which increase evaporation from soils, lead to droughts.
“The Mediterranean is one of the areas that is unanimously projected [in climate models] as going to dry in the future [due to man-made climate change],” said Yochanan Kushnir, a climate scientist at Lamont Doherty Earth Observatory, who was not involved in the research. “This paper shows that the behavior during this recent drought period is different than what we see in the rest of the record,” he said, which means that the Levant region may already be feeling the affects of human-induced warming of the planet.
Historical documents recording droughts that occurred between the years 1100 and 2012 corroborate the findings of the tree ring research. Michael Mann, director of the Earth System Science Center at Penn State University, said the NASA study is one of several worrying reports about unprecedented climate conditions.