


Air Temperatures – The following maximum temperatures (F) were recorded across the state of Hawaii Monday…along with the minimums Monday:
81 – 66 Lihue, Kauai
82 – 68 Honolulu, Oahu
79 – 64 Molokai AP
81 – 66 Kahului, Maui
83 – 71 Kailua Kona
78 – 68 Hilo, Hawaii
Here are the latest 24-hour precipitation totals (inches) for each of the islands, as of Monday evening:
0.40 Kilohana, Kauai
0.10 Poamoho RG 1, Oahu
0.17 Molokai
0.00 Lanai
0.00 Kahoolawe
0.09 Kaupo Gap, Maui
0.45 Saddle Quarry, Big Island
The following numbers represent the strongest wind gusts (mph)…as of Monday evening:
25 Mana, Kauai – NNW
23 Kuaokala, Oahu – NNE
20 Molokai – N
14 Lanai – NE
20 Kahoolawe – NW
12 Hana, Maui – NW
18 Puu Mali, Big Island – WNW
Hawaii’s Mountains – Here’s a link to the live web cam on the summit of near 13,800 foot Mauna Kea on the Big Island of Hawaii. This web cam is available during the daylight hours here in the islands…and when there’s a big moon shining down during the night at times. Plus, during the nights you will be able to see stars, and the sunrise and sunset too… depending upon weather conditions.
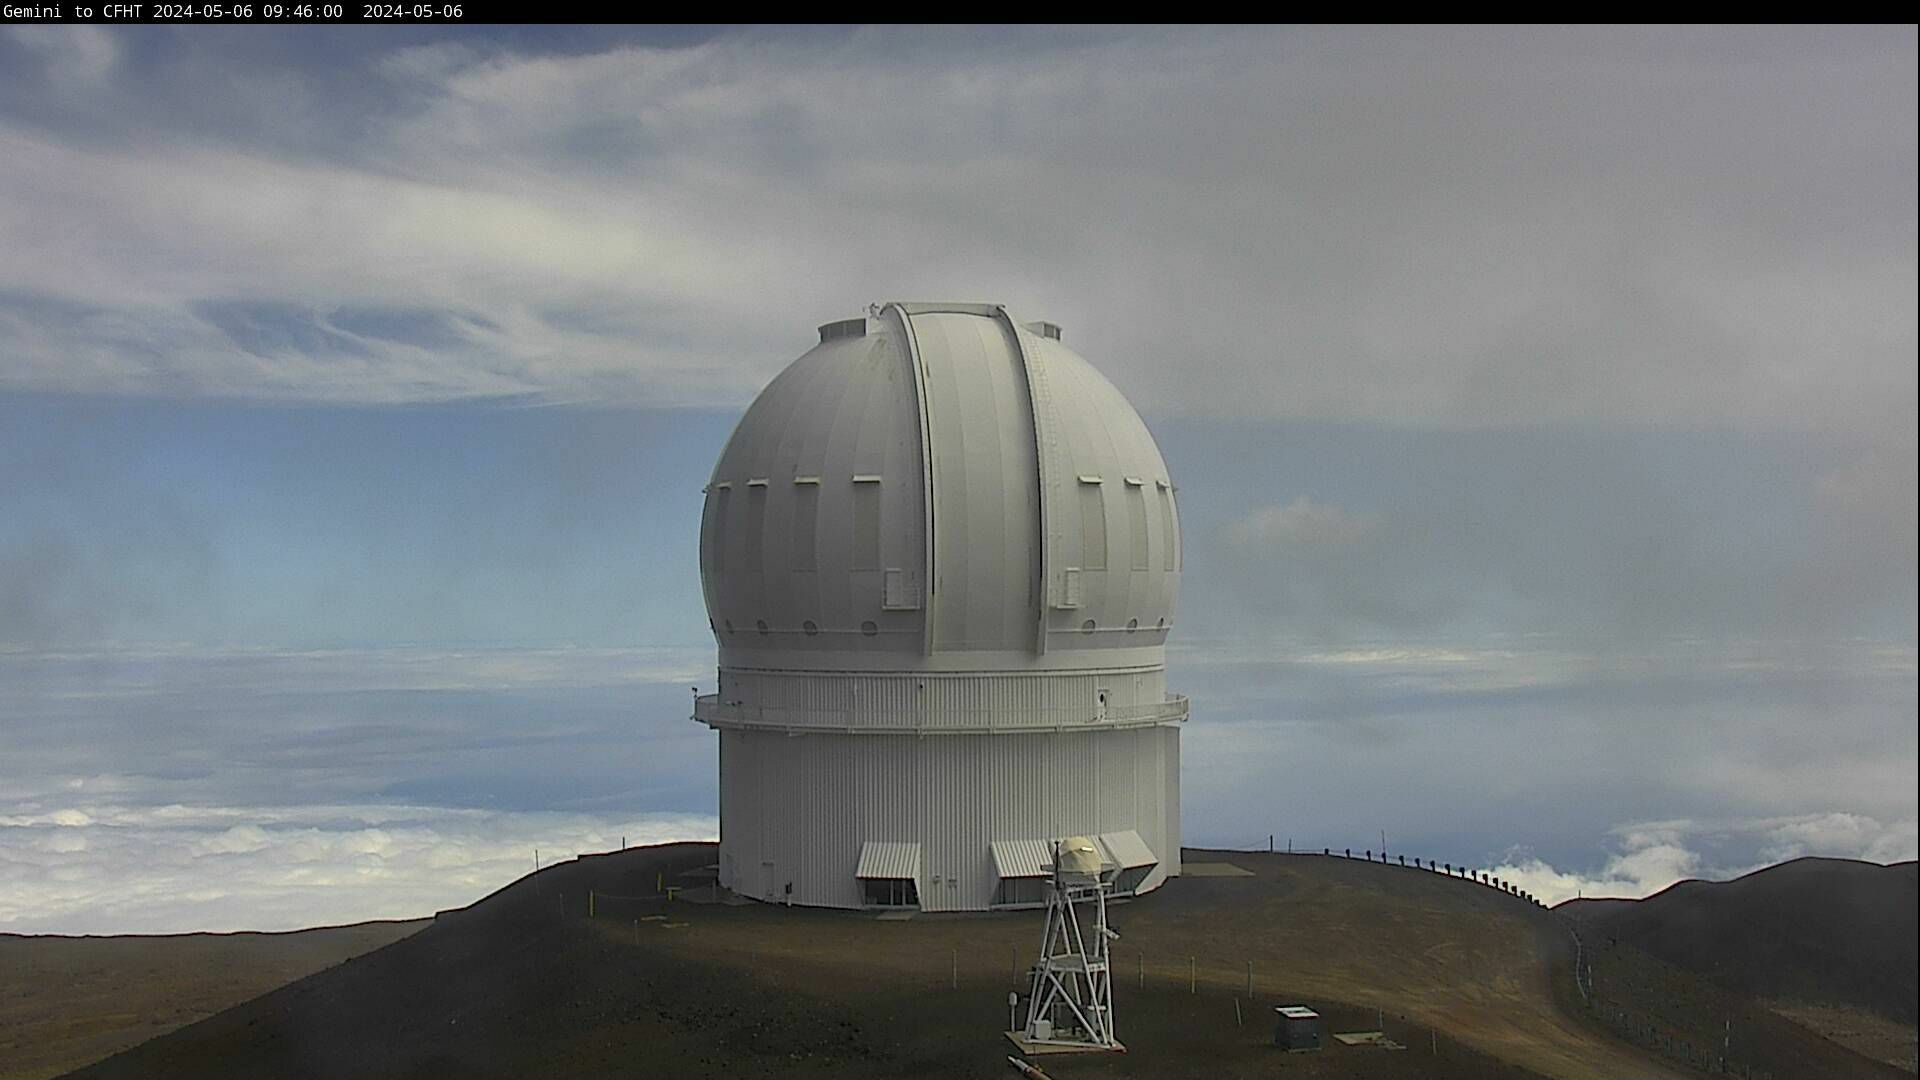
Aloha Paragraphs

We see low pressure systems well to the northeast…with a
fragmenting late season cold front dissipating far east
of the Big Island

Clouds still hung-up around the Big Island…with patchy
clouds elsewhere – looping version of this image

Showers are falling over the nearby ocean…with a few
spreading over the islands locally
Here’s the looping radar image for the Hawaiian Islands
Honoring those soldiers who lost their lives on this
Memorial Day Holiday
~~~ Hawaii Weather Narrative ~~~
Cool, generally north-northeast to northeasterly breezes…then lighter northeast to easterly breezes mid-week into the weekend. Here’s the latest weather map, showing the Hawaiian Islands, and the rest of the North Pacific Ocean, along with a real-time wind profiler of the central Pacific. We find high pressure systems located far to the northwest, north and northeast of the state, along with a cold front dissipating over the ocean well to the east of the Big Island. The forecast has our current slightly cool wind flow giving way to lighter breezes with localized daytime sea breezes…and overnight down slope land breezes starting in a couple of days.
We’ll see a few showers into mid-week…with generous afternoon showers over the mountains during second half of this week. Drier air is coming into Kauai, Oahu and Maui County, while some windward showers on the Big Island remain active for the time being…with a few elsewhere. As we move through this new week, with gradually lighter winds on tap, we’ll shift into a convective weather pattern. This will manifest as slightly cooler than normal clear mornings, with afternoon clouds and possible heavy showers over the interior upcountry areas. The beaches around the state should remain in good shape, with pleasant conditions. I’ll be back with more updates on all of the above, I hope you have a great Monday night wherever you’re spending it! Aloha for now…Glenn.
Here on Maui...early Monday morning before sunrise, skies are clear to partly cloudy, with just a few showers falling locally along the windward sides. The air temperature here in Kula at 615am was an unusually cool 49.8 degrees, 68 at the Kahului AP, 66 in Hana, 52 at Kaupo Gap. It’s another winter-like day here in late spring…almost June!
– Today was yet another day of chilly weather, experienced especially in those areas with elevation above sea level. The air temperatures stayed in the middle 60’s or even a bit lower than that here in Kula. There were a couple of times when a thick drizzle was blown over us by the gusty north-northeasterly breezes. Interestingly enough, now at 525pm, the clouds have broken, and mostly sunny weather is now embracing the island.
Friday Evening Film: There were several new films opening here in Maui, several of which looked like they would be fun to see. I went to see the one called Far From the Madding Crowd, starring Cary Mulligan, Tom Sturridge, Michael Sheen, Matthias Schoenaerts, Juno Temple, and Jessica Barden…among many others. The synopsis: based on the literary classic by Thomas Hardy, this is a story of independent, beautiful and headstrong Bathsheba Everdene (Carey Mulligan), who attracts three very different suitors: Gabriel Oak (Matthias Schoenaerts), a sheep farmer, captivated by her fetching willfulness; Frank Troy (Tom Sturridge), a handsome and reckless Sergeant; and William Boldwood (Michael Sheen), a prosperous and mature bachelor. This timeless story of Bathsheba’s choices and passions explores the nature of relationships and love – as well as the human ability to overcome hardships through resilience and perseverance.
The critics and viewers are both giving this film good ratings, and the trailer makes it look quite interesting. This turned out to be a special film, although filled with endless romantic entanglement…which lead to the maximum amount of melodrama. The characters were exceptional, and especially the part played by Cary Mulligan as the leading lady. I really enjoyed the sound track, and the English setting, which gave the film such a depth of feeling. The long and short of all this is, that Cary Mulligan was so attractive, that men were falling for her left and right, and she had to just deal with it…which is what this film is all about. I was with three others, and everyone thought quite highly of it. Personally, I gave it a strong B+ grade, perhaps just shy of the top spot. If you like love stories, along with all the drama that they provide, this may be one not to miss. I was touched by the film, and very glad I made the effort to see it. It was certainly a different type of film, than the numberless action movies that I end up seeing so often. It was a great change of pace, and I wish there were more like this one coming through Maui theaters.
World-wide tropical cyclone activity:
>>> Atlantic Ocean: The last regularly scheduled Tropical Weather Outlook of the 2014 Atlantic hurricane season…has occurred. Routine issuance of the Tropical Weather Outlook will resume on June 1, 2015. During the off-season, Special Tropical Weather Outlooks will be issued as conditions warrant.
Here’s a satellite image of the Atlantic Ocean
>>> Caribbean Sea: The last regularly scheduled Tropical Weather Outlook of the 2014 Atlantic hurricane season…has occurred. Routine issuance of the Tropical Weather Outlook will resume on June 1, 2015. During the off-season, Special Tropical Weather Outlooks will be issued as conditions warrant.
>>> Gulf of Mexico: The last regularly scheduled Tropical Weather Outlook of the 2014 Atlantic hurricane season…has occurred. Routine issuance of the Tropical Weather Outlook will resume on June 1, 2015. During the off-season, Special Tropical Weather Outlooks will be issued as conditions warrant.
Here’s a satellite image of the Caribbean Sea…and the Gulf of Mexico.
>>> Eastern Pacific: There are no active tropical cyclones
TROPICAL WEATHER OUTLOOK
NWS NATIONAL HURRICANE CENTER MIAMI FL
For the eastern North Pacific…east of 140 degrees west longitude:
1.) A nearly-stationary area of low pressure located about 1500 miles
west-southwest of the southern tip of Baja California is producing
disorganized showers and a few thunderstorms well east of the
circulation center.  Upper-level winds are expected to become less
favorable today and significant development of this system is not
expected.
(Invest 91E)
* Formation chance through 48 hours...low...10 percent * Formation chance through 5 days..low...10 percent
2.)  Disorganized showers and thunderstorms located several hundred miles
south of the coast of Mexico are associated with a trough of low
pressure.  Environmental conditions appear conducive for gradual
development of this system during the next several days, and a
tropical depression is likely to form late this week while
the system moves slowly west-northwestward to northwestward.
ile the system moves slowly west-northwestward to northwestward.
* Formation chance through 48 hours...low...20 percent
* Formation chance through 5 days...high...80 percent
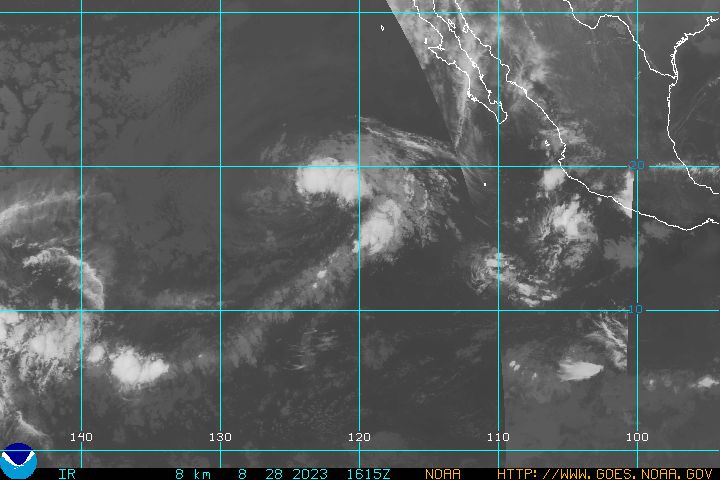
This NHC image shows these two disturbances described above – along with the 5-day outlook
Here’s a wide satellite image that covers the entire area between Mexico, out through the central Pacific…to the International Dateline.
Here’s the link to the National Hurricane Center (NHC)
>>> Central Pacific: The central north Pacific hurricane season has officially ended. Routine issuance of the tropical weather outlook will resume on June 1, 2015. During the off-season, special tropical weather outlooks will be issued as conditions warrant.
Here’s a link to the Central Pacific Hurricane Center (CPHC)
>>> Northwest Pacific Ocean:There are no active tropical cyclones
>>> South Pacific Ocean: There are no active tropical cyclones
>>> North and South Indian Oceans: There are no active tropical cyclones
Here’s a link to the Joint Typhoon Warning Center (JTWC)
Interesting: Stable Antarctic glaciers are now melting – A dramatic shift has taken place in the glaciers of the southern Antarctic peninsula, writes Bert Wouters. Six years ago these previously stable bodies suddenly stated shedding 60 cubic kilometres of ice per year into the ocean. A stark warning of further surprises to come?
The study, by researchers at the National Center for Atmospheric Research (NCAR) and the City University of New York (CUNY), highlights the importance of considering societal changes when trying to determine future climate impacts.
“Both population change and climate change matter,” said NCAR scientist Brian O’Neill, one of the study’s co-authors. “If you want to know how heat waves will affect health in the future, you have to consider both.”
Extreme heat kills more people in the United States than any other weather-related event, and scientists generally expect the number of deadly heat waves to increase as the climate warms. The new study, published May 18 in the journal Nature Climate Change, finds that the overall exposure of to these future heat waves would be vastly underestimated if the role of population changes were ignored.
The total number of people exposed to extreme heat is expected to increase the most in cities across the country’s southern reaches, including Atlanta, Charlotte, Dallas, Houston, Oklahoma City, Phoenix, Tampa, and San Antonio.
The research was funded by the National Science Foundation, which is NCAR’s sponsor, and the U.S. Department of Energy.
CLIMATE, POPULATION, AND HOW THEY INTERACT
The fact that so many glaciers in such a large region suddenly started to lose ice came as a surprise. It shows a very fast response of the ice sheet: in just a few years everything changed.
Antarctica’s glaciers have been making headlines during the past year, and not in a good way.
Whether it’s a massive ice shelf facing imminent risk of collapse, glaciers in the West Antarctic past the point of no return, or new threats to East Antarctic ice, it’s all been rather gloomy.
And now I’m afraid there’s more bad news: a new study published in the journal Science, led by a team of my colleagues and I from the University of Bristol, has observed a sudden increase of ice loss in a previously stable part of Antarctica.
The region in question is the southernmost half of the Antarctic Peninsula, a section of the mainland which extends 1,300km into the Southern Ocean.
Its northern half is the continent’s mildest region and the climate effects there are clear. We already knew for instance that the glaciers of the Northern Antarctic Peninsula were in trouble following the disintegration of some of its ice shelves, most famously Larsen A and B.
Further to the west, the massive glaciers feeding into the Amundsen Sea have been shedding ice into the ocean at an alarming rate for decades. Out of the blue, the Southern Peninsula filled up the gap between these two regions and became Antarctica’s second largest contributor to sea level rise.
Using satellite elevation measurements, we found the Southern Antarctic Peninsula showed no signs of change up to 2009. Around that year, multiple glaciers along a vast 750km coastline suddenly started to shed ice into the ocean at a nearly constant rate of 60 cubic km, or about 55 trillion liters of water, each year. That’s enough water to fill 350,000 Empire State Buildings over the past five years.
Some of the glaciers are currently thinning by as much as 4 meters each year. The ice loss in the region is so large that it causes small changes in the Earth’s gravity field, which can be detected by another satellite mission, the Gravity Recovery and Climate Experiment (GRACE).
Is this an effect of global warming?
The answer is both yes and no. Data from an Antarctic climate model shows that the sudden change cannot be explained by changes in snowfall or air temperature. Instead, we attribute the rapid ice loss to warming oceans.
Many of the glaciers in the region feed into ice shelves that float on the surface of the ocean. They act as a buttress to the ice resting on bedrock inland, slowing down the flow of the glaciers into the ocean.
The westerly winds that encircle Antarctica have become more vigorous in recent decades, in response to climate warming and ozone depletion. The stronger winds push warm waters from the Southern Ocean poleward, where they eat away at the glaciers and floating ice shelves from below.
Ice shelves in the region have lost almost one-fifth of their thickness in the last two decades, thereby reducing the resisting force on the glaciers.
A key concern is that much of the ice of the Southern Antarctic Peninsula is grounded on bedrock below sea level, which gets deeper inland. This means that even if the glaciers retreat, the warm water will chase them inland and melt them even more.
In just a few years, everything changed. What next?
The region’s melting glaciers are currently adding about 0.16 millimeters to global sea levels per year, which won’t immediately make you run for the hills. But it’s yet another source of sea level rise, about 5% of the global total increase.
What might be a bigger source of concern is that the changes occurred so suddenly and in an area that was behaving quietly until now. The fact that so many glaciers in such a large region suddenly started to lose ice came as a surprise. It shows a very fast response of the ice sheet: in just a few years everything changed.
The Southern Antarctic Peninsula contains enough ice to add 35 cm to sea level, but that won’t happen any time soon. It’s too early to tell how much longer the ice loss will continue and how much it will contribute to future sea level rise.
For this, a detailed knowledge of the geometry of the local ice shelves, the ocean floor topography, ice sheet thickness and glacier flow speeds are crucial.
But the ice on Antarctica is like a sleeping giant. Even if we would stop emitting greenhouse gases as of today, or the inflow of warm water would stop, this inert system would take a long time to find an equilibrium again.
peter mac Says:
I think I’m near your age Glenn.
I have an disabled ‘trigger’ finger which kept me
from being drafted.
But I lost too many friends in the
American War (in Vietnam).
My eldest son, an historian, lives in
Hanoi, so that war is never far away.
A friend of mine sent me this for memorial day.
Hope you appreciate this.
“Mourn all victims of war and all violence.
Reject war as a solution.
Defend civil liberties.
Oppose all discrimination, anti-Islamic, anti-Semitic, anti-Hawaiian, etc.
Seek peace through justice in Hawai`i and around the world.
If any one wants, contact:
Malu `Aina Center for Non-violent Education & Action
P.O. Box 489 Kurtistown, Hawai`i 96760.”
Aloha ~~~ Hi Peter, thanks for your comment, and I do appreciate what you have written…as usual! Aloha, Glenn