


Air Temperatures – The following maximum temperatures (F) were recorded across the state of Hawaii Thursday…along with the minimum temperatures Thursday:
80 – 63 Lihue, Kauai
75 – 66 Honolulu, Oahu
72 – 62 Molokai AP
75 – 64 Kahului, Maui
78 – 70 Kailua Kona
75 – 65 Hilo, Hawaii
Here are the latest 24-hour precipitation totals (inches) for each of the islands, as of Thursday evening:
1.80 Princeville AP, Kauai
1.07 Poamoho, Oahu
0.49 Molokai 1, Molokai
0.23 Lanai
0.24 Kahoolawe
0.97 Hana AP, Maui
0.59 Upolu AP, Big Island
The following numbers represent the strongest wind gusts (mph)…as of Thursday evening:
35 Port Allen, Kauai – NW
30 Kaneohe MCBH – NW
16 Molokai – N
23 Lanai – N
14 Kahoolawe – N
24 Kahului AP, Maui – NW
28 Nene Cabin, Big Island – NW
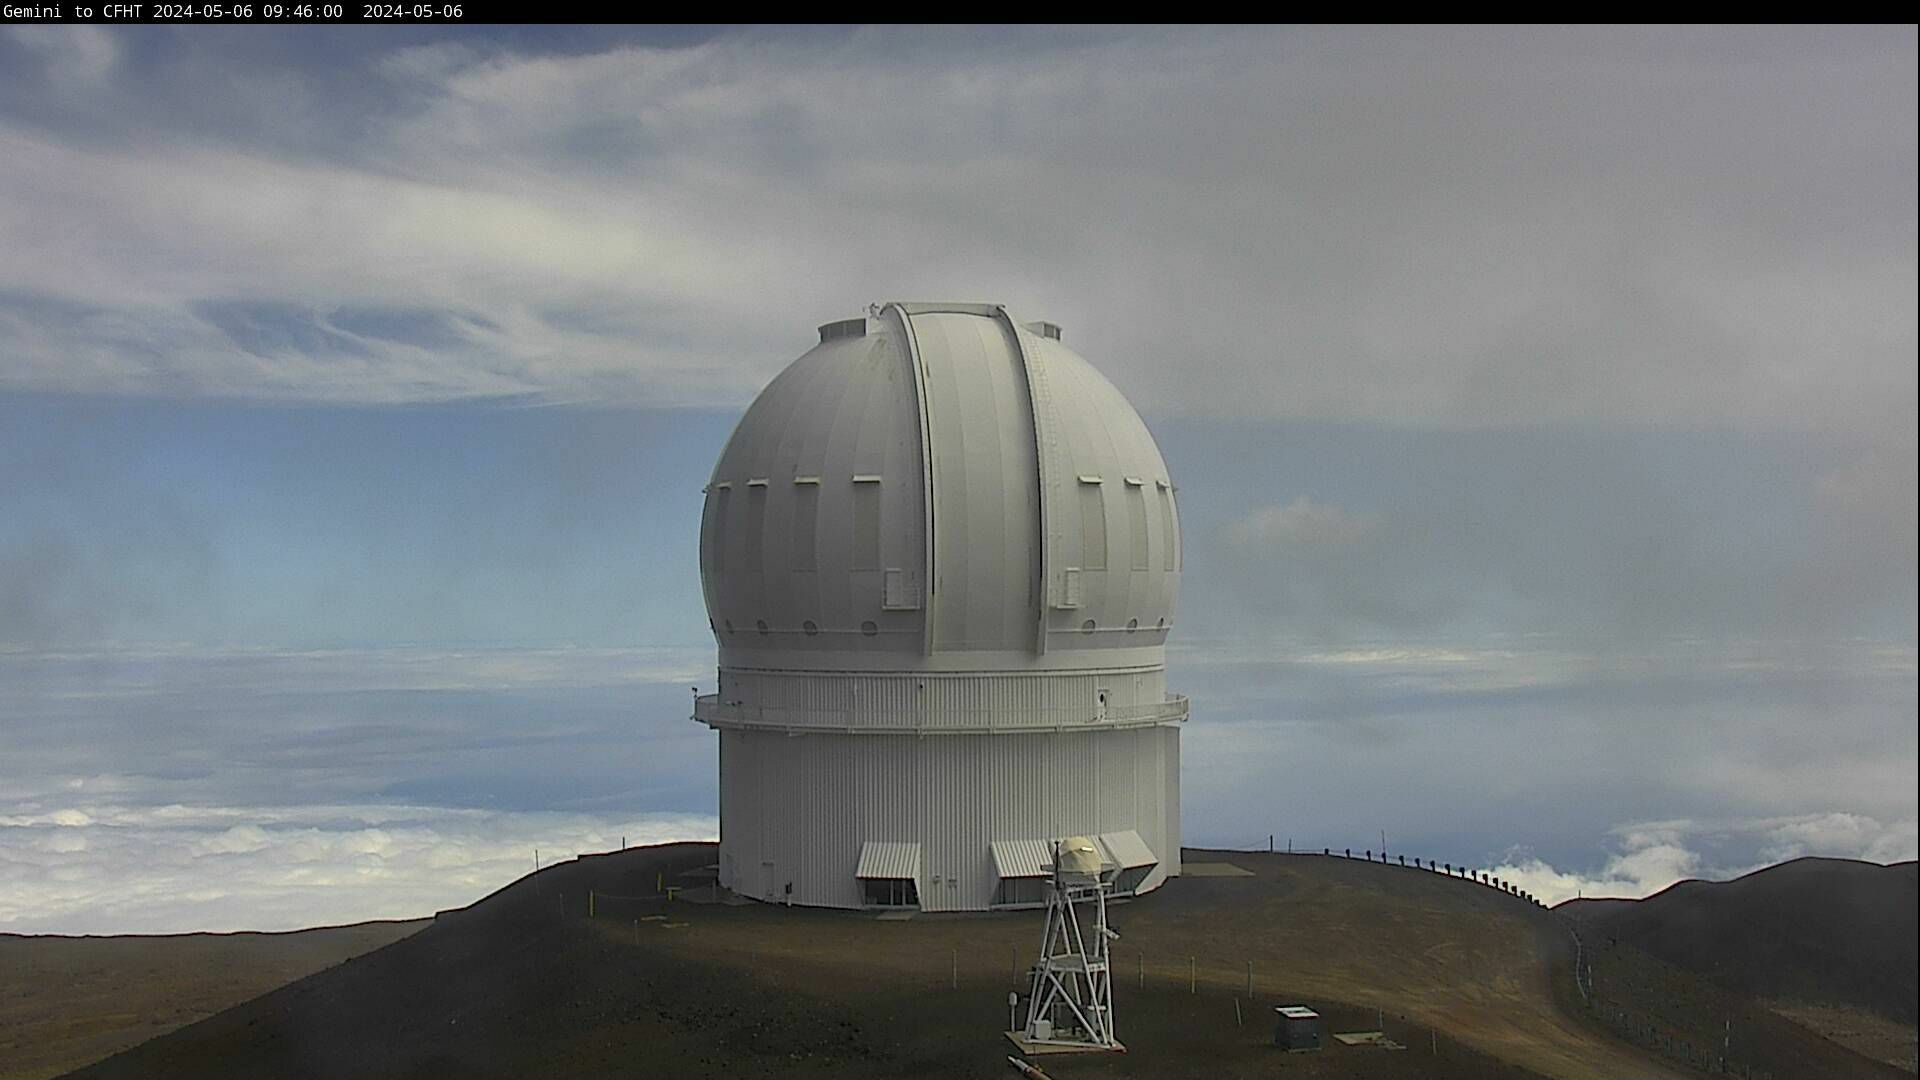
Hawaii’s Mountains – Here’s a link to the live web cam on the summit of near 13,800 foot Mauna Kea on the Big Island of Hawaii. This web cam is available during the daylight hours here in the islands…and when there’s a big moon shining down during the night at times. Plus, during the nights you will be able to see stars, and the sunrise and sunset too… depending upon weather conditions.
Aloha Paragraphs

The swath of thick clouds, oriented more or less northeast
to southwest…is gradually shifting east – the different
shades of blue are precipitation
There are less showery clouds stretching over the islands…
although they’re still locally active, mostly over the
eastern islands

Showers are diminishing, although still falling locally / blue is light
and green is heavier, with yellow the heaviest intensities
Here’s the looping radar image for the Hawaiian Islands
~~~ Hawaii Weather Narrative ~~~
The Mauna Kea Summit…on the Big Island of Hawaii
High Wind Warning – west winds 45-60 mph with gusts
to 70 mph
Small Craft Advisory…all coasts and channels statewide
High Surf Warning…north and west shores of the
smaller islands / High Surf Advisory…for
north shores of the Big Island
Cool winds will strengthen from the north, then become easterly trade winds later Friday into the weekend…briefly. Here’s the latest weather map, showing the Hawaiian Islands, and the rest of the North Pacific Ocean, along with a real-time wind profiler of the central Pacific. We find high pressure systems well to the northwest and northeast of the islands. At the same time, we have low pressure systems well to the north and northeast of the islands. The placement of these low and high pressure areas, along with a cold front over the Big Island, and a trough of low pressure offshore to the southeast, will prompt stronger northerly breezes to arrive. As we get into later Friday and the weekend…a more easterly trade wind air flow will finally move over the state. The longer range outlook suggests that those trades will be short-lived, as one or two late winter cold fronts approach the state next week. As for winds, we’ll likely find them turning lighter, and coming in from variable directions.
Partly to mostly cloudy skies will prevail statewide, with generally light showers…mostly over the eastern islands. The thick plume of multi-layered clouds remains over the state, although are shifting east. The bulk of the rainfall that falls will continue to focus over the Big Island and Maui County, with fewer showers elsewhere across the state. The models suggest the return of more classic trade wind conditions later Friday into the weekend, with drier conditions in general. As noted above, those trades will likely slip away early next week, as more late season storms pass by to the north of the state, perhaps dragging a cold front or two across our area later in the week. By the way, for you folks who will be going to our north or west facing beaches Friday into the weekend, be very careful of the extra large waves that will be breaking there! I’ll be back with more updates on all of the above, I hope you have a great Thursday night wherever you’re spending it! Aloha for now…Glenn.
Here on Maui: The skies are cloudy again over Maui early this morning, with a few showers falling here and there. My weather deck here in Kula this morning, well before sunrise, is still wet some light showers that fell overnight. The low temperature was 55 degrees here at my Kula weather tower, while it was 67 degrees down at the Kahului airport, 66 at the Hana airport, and 37 degrees atop the Haleakala Crater. The warmest low temperature around the state was 68 degrees in Kailua-Kona on the Big Island…while the coolest was 62 at the Molokai airport.
~~~ It’s late afternoon here in Kula, Maui, under foggy skies, with light showers falling…and a chilly northerly breeze.
~~~ We’re into the early evening hours now at 6pm, under still cloudy skies across Maui. Here at my weather tower in upcountry Kula, its foggy, with a light shower, near calm winds…and a chilly 55 degrees on my thermometer. I spent the day down in Kihei, having meetings at the Pacific Disaster Center, where it was very cloudy, although I didn’t see any showers the few times I was able to step outside. As I was driving back upcountry however, I ran into fog, and soon after getting home, light showers began falling…along with the temperature continuing to fall. This is primary due to the northerly direction of our winds now, which will keep a late winter chill into Friday. I’d suggest grabbing an extra blanket tonight…or maybe wear your socks to bed at least!
~~~ Here’s a weather product that I produced for the Pacific Disaster Center (PDC) this morning
World-wide tropical cyclone activity:
>>> Atlantic Ocean: The last regularly scheduled Tropical Weather Outlook of the 2014 Atlantic hurricane season…has occurred. Routine issuance of the Tropical Weather Outlook will resume on June 1, 2015. During the off-season, Special Tropical Weather Outlooks will be issued as conditions warrant.
Here’s a satellite image of the Atlantic Ocean
>>> Caribbean Sea: The last regularly scheduled Tropical Weather Outlook of the 2014 Atlantic hurricane season…has occurred. Routine issuance of the Tropical Weather Outlook will resume on June 1, 2015. During the off-season, Special Tropical Weather Outlooks will be issued as conditions warrant.
>>> Gulf of Mexico: The last regularly scheduled Tropical Weather Outlook of the 2014 Atlantic hurricane season…has occurred. Routine issuance of the Tropical Weather Outlook will resume on June 1, 2015. During the off-season, Special Tropical Weather Outlooks will be issued as conditions warrant.
Here’s a satellite image of the Caribbean Sea…and the Gulf of Mexico.
>>> Eastern Pacific: The last regularly scheduled Tropical Weather Outlook of the 2014 North Pacific hurricane season…has occurred. Routine issuance of the Tropical Weather Outlook will resume on May 15, 2015. During the off-season, Special Tropical Weather Outlooks will be issued as conditions warrant.
Here’s a wide satellite image that covers the entire area between Mexico, out through the central Pacific…to the International Dateline.
Here’s the link to the National Hurricane Center (NHC)
>>> Central Pacific: The central north Pacific hurricane season has officially ended. Routine issuance of the tropical weather outlook will resume on June 1, 2015. During the off-season, special tropical weather outlooks will be issued as conditions warrant.
Here’s a link to the Central Pacific Hurricane Center (CPHC)
>>> Northwest Pacific Ocean: Tropical Cyclone 03W (Bavi) remains active in the Northwest Indian Ocean, here’s the JTWC graphical track map…along with the NOAA satellite image
>>> South Pacific Ocean: Tropical Cyclone 17P (Pam) remains active in the Southwest Indian Ocean, here’s the JTWC graphical track map…along with the NOAA satellite image
Tropical Cyclone 18P (Nathan) remains active in the Coral Sea, near Australia, here’s the JTWC graphical track map…along with the NOAA satellite image
>>> North and South Indian Oceans: Tropical Cyclone 19S (Olwyn) remains active in the South Indian Ocean, here’s the JTWC graphical track map…along with the NOAA satellite image
Here’s a link to the Joint Typhoon Warning Center (JTWC)
Interesting: Princeton University geologists mapping the Earth’s mantle in 3D – When a 7.9-magnitude earthquake struck central China’s Sichuan province in 2008, seismic waves rippled through the region, toppling apartment houses in the city of Chengdu and swaying office buildings 1,000 miles away in Shanghai.
Though destructive, earthquakes provide benefit in one respect: they help researchers learn about the structure of the Earth, which in turn could lead to more accurate predictions of damage from future quakes and volcanic activity. By eavesdropping on the seismic vibrations of quakes as they rumble through the Earth, researchers can detect the existence of structures such as mineral deposits, subterranean lakes, and upwellings of magma. Thanks to a growing earthquake detection network and superfast computers, geoscientists are now able to explore the Earth’s interior, a region that has been more inaccessible than the deepest ocean or the farthest planet in our solar system.
Princeton geosciences professor Jeroen Tromp and his team have embarked on an ambitious project to use earthquakes to map the Earth’s entire mantle, the semisolid rock that stretches to a depth of 1,800 miles, about halfway down to the planet’s center and about 300 times deeper than humans have drilled. For the task, his team will use one of the world’s fastest supercomputers, Titan, which can perform more than 20 quadrillion calculations per second and is located at the Department of Energy’s Oak Ridge National Laboratory in Tennessee.
Computer simulations use the speed of seismic waves from earthquakes to reveal the existence of subterranean structures. In this view of the mantle below the Pacific Ocean, slower waves are shown in red and orange while faster waves are shown in green and blue. The faster waves are associated with subduction zones where one tectonic plate sinks underneath another plate. (Image courtesy of Ebru Bozda?, University of Nice Sophia Antipolis, and David Pugmire, Oak Ridge National Laboratory)
“Seismology is changing at a fundamental level due to advances in computing power,” said Tromp, who earned his Ph.D. in geology from Princeton and is Princeton’s Blair Professor of Geology, professor of applied and computational mathematics, and associate director of the Princeton Institute for Computational Science and Engineering. “If someone had told me what seismology would look like 20 years from when I graduated from Princeton in 1992, I would have never believed it.”
For the project, Tromp will use seismic waves from roughly 3,000 quakes of magnitude 5.5 and greater, recorded at thousands of seismographic stations worldwide and distributed via the National Science Foundation’s Incorporated Research Institutions for Seismology. These stations make recordings, or seismograms, that detail the movement produced by seismic waves, which typically travel at speeds of several miles per second and last several minutes.
“The ultimate goal is a 3-D map on a global scale,” said Tromp, who expects to have preliminary results at the end of this year. “We are specifically interested in the structure of mantle upwellings and plumes,” he said, “but much of it will be investigating the images for unusual features.”
Mervyn Says:
I cycled to the summit of Haleakala on March 12, 2015 when the weather was “nasty”.
Is there a location where I can get the hourly winds measured at the summit for this day?
Thanks. ~~~ Hi Mervyn, I remember that it was nasty up there a week ago. I don’t know of any sources of past wind conditions up on the Crater. However, you might try calling the telephone number up there: 808-572-4400 – I don’t know if you can get through to a real person, or if its a recording? Best of luck in tracking down the info you need. Referring to my own records, this is what I have: Wind Advisory…Haleakala Summit – west winds 30-50 mph
with gusts over 65 mph
Aloha, Glenn
Wayne Kuzek Says:
Hello Glen, just wanted to say thank you again for your detailed information on the weather in Hawaii. We are coming for our annual spring vacation this weekend spending 3 nights in Kauai then off to Waikiki for 8 nights. Our late winter here in Vancouver BC has been very mild with almost no precipitation. Not good for the local ski hills as there is no snow up there as it has been just to warm.
Looking forward to our trip and getting our weather updates from you every morning.
Wayne ~~~ Hi Wayne, good to hear from you up there in Vancouver, a place I’m always drawn to. I’m sure you’ll have a great vacation this year, and will return to BC with a warm tropical afterglow under your belt! Thanks for using my weather site too. Aloha, Glenn
Brent Says:
Check out the snow on the video
http://mauinow.com/2015/03/11/video-haleakala-snow-twice-in-a-week/ ~~~ Hi Brent, thanks for the link! Aloha, Glenn