


Air Temperatures – The following maximum temperatures (F) were recorded across the state of Hawaii Thursday…along with the minimum temperatures Thursday:
81 – 71 Lihue, Kauai
82 – 71 Honolulu, Oahu
82 – 67 Molokai AP
86 – 65 Kahului, Maui
84 – 71 Kailua Kona
84 – 63 Hilo, Hawaii
Here are the latest 24-hour precipitation totals (inches) for each of the islands, as of Thursday evening:
0.80 Hanalei, Kauai
0.54 Poamoho RG 1, Oahu
0.20 Molokai
0.27 Lanai
0.01 Kahoolawe
0.66 Kahakuloa, Maui
0.42 Kawainui Stream, Big Island
The following numbers represent the strongest wind gusts (mph)…as of Thursday evening:
21 Mana, Kauai – N
18 Kalaeloa, Oahu – WNW
09 Molokai – NNE
10 Lanai – SW
17 Kahoolawe – SE
15 Hana, Maui – SE
23 South Point, Big Island – NE
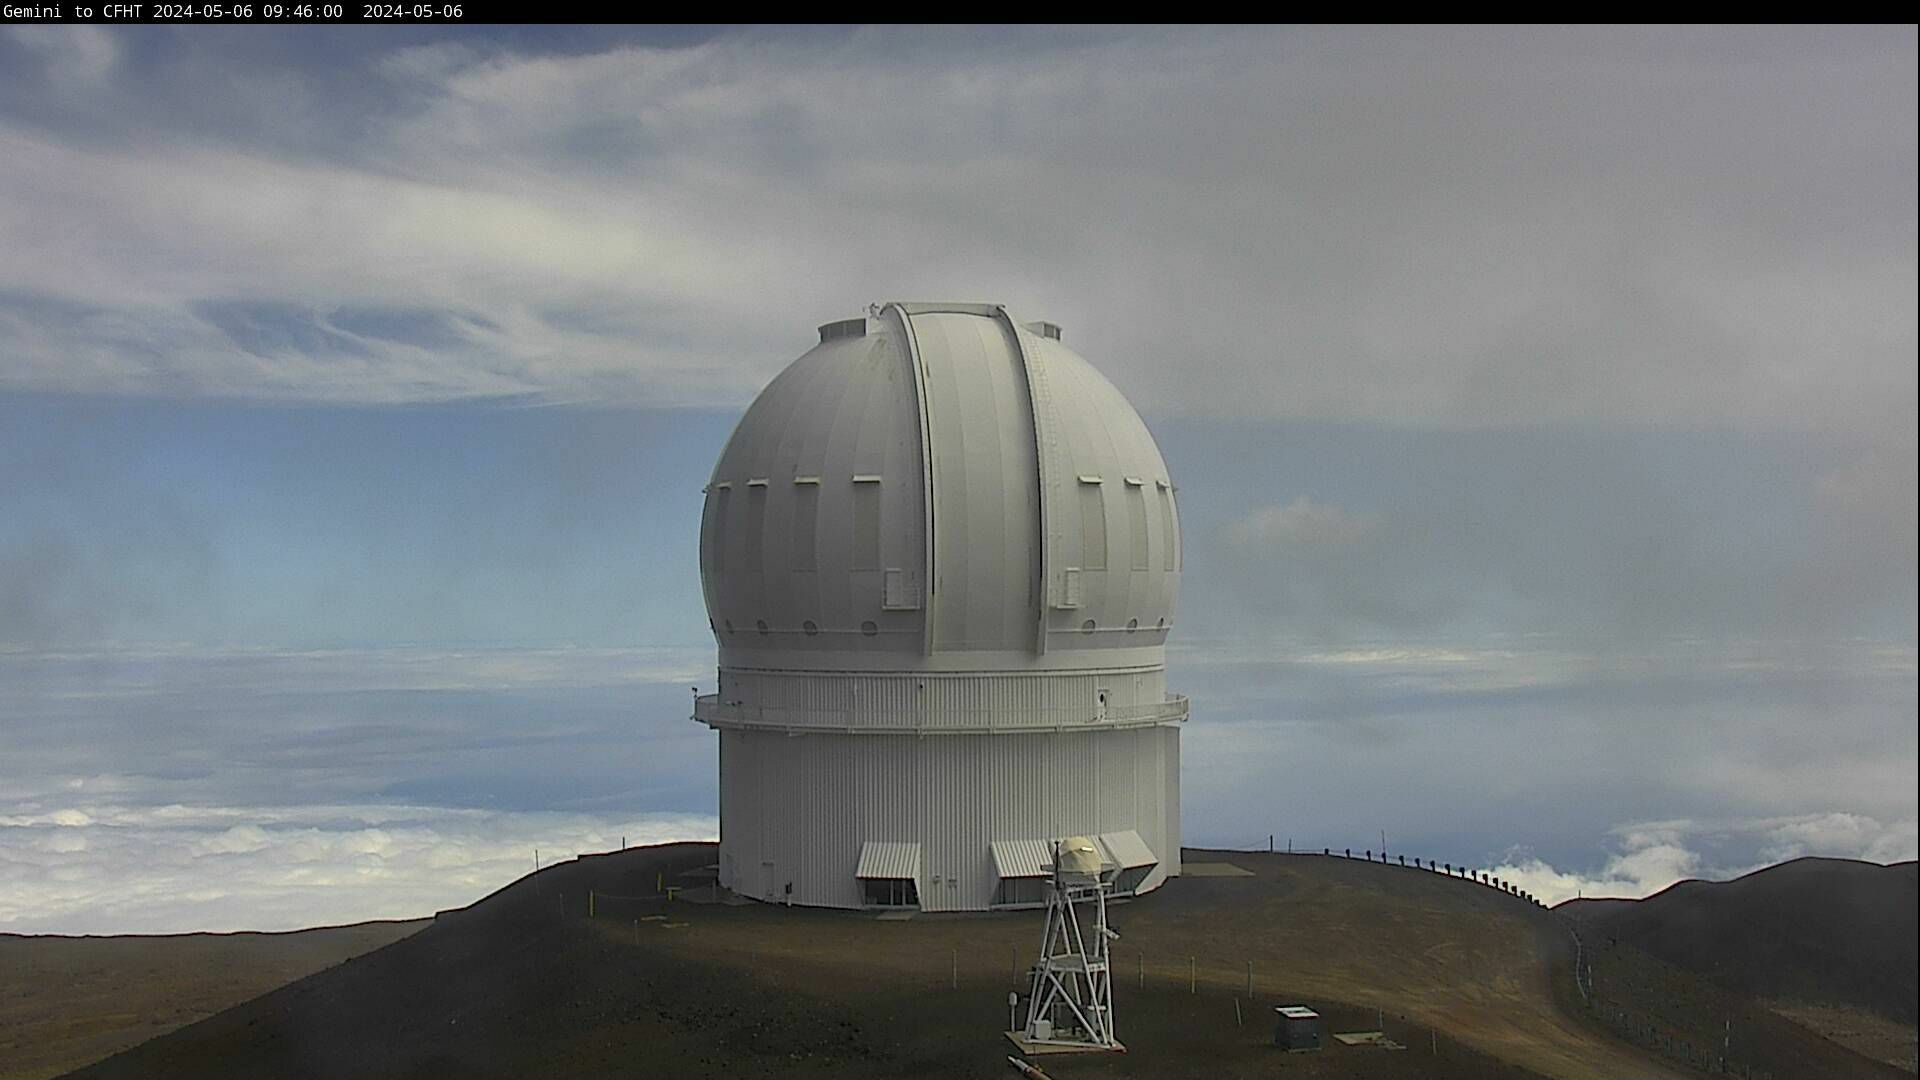
Hawaii’s Mountains – Here’s a link to the live web cam on the summit of near 13,800 foot Mauna Kea on the Big Island of Hawaii. This web cam is available during the daylight hours here in the islands…and when there’s a big moon shining down during the night at times. Plus, during the nights you will be able to see stars, and the sunrise and sunset too… depending upon weather conditions.
Aloha Paragraphs

Heavy clouds associated with a cold front/trough is creeping
towards Kauai and Oahu…with a large area of heavy clouds
to the|east-southeast – both of which may converge over the
state during the next few days…with unsettled weather
Those threatening clouds…continue to edge closer to Kauai

Showers generally over the ocean…a few coming ashore locally
~~~ Hawaii Weather Narrative ~~~
Lighter and variable winds into Saturday…with trades picking up later in the weekend into next week. Here’s the latest weather map, showing the Hawaiian Islands, and the rest of the North Pacific Ocean, along with a real-time wind profiler of the central Pacific. We find a high pressure system well to the northeast. At the same time, we have gale low pressure systems to the north…with an associated frontal boundary over the ocean just to the northwest of Kauai. Meanwhile, a trough of low pressure now over the islands, is disrupting the recent trade wind flow.
A trough of low pressure is over the island chain now, which will gradually prompt unsettled weather…with more general rainy conditions later Friday into Saturday. Here’s the looping radar image for the Hawaiian Islands. For the time being, it looks like we’ll find gradually wetter conditions, with a few scattered showers into Friday. We’ll eventually find locally heavier showers arriving, or even an isolated thunderstorm Friday evening into the weekend. As the trade winds return during the weekend, they will bring potentially lots of passing showers to our windward coasts and slopes. There’s the chance that some of these generous showers may get over into our leeward sections with time too. Looking way ahead, the models are suggesting breezy trade winds and drier weather during the second half of next week. I’ll be back with more updates on all of the above, I hope you have a great Thursday night wherever you’re spending it! Aloha for now…Glenn.
Here on Maui: There are clouds around Wailea and Kihei, and it looks like Lahaina too, although less clouds are over Kahului and the windward side of east Maui…along with clear conditions over Kula and the Haleakala Crater. The winds are generally quite light across Maui early this morning, with a low temperature of 54 degrees here at my weather tower in Kula. It was 68 degrees down at the Kahului airport near the ocean…with 41 degrees atop the Haleakala Crater at the same time. The warmest temperatures around the state were 73 degrees at the Lihue AP on Kauai, Honolulu AP, Oahu…and Kailua Kona on the Big Island. Meanwhile, the summit of the Big Island was a colder 30 degrees atop Mauna Kea. / Now at near 730am, clouds have increased across the island of Maui…with partly to mostly cloudy conditions developing. / Now at 815am, our skies are as quickly clearing up…as they become cloudy earlier – it’s a nice day here in paradise! / Back and forth, increasing and decreasing clouds…the north shore seems to remain the clearest.
~~~ It’s now 115pm Thursday afternoon, with Maui finding partly cloudy to cloudy conditions. Here in upcountry Kula, its mostly cloudy, with light breezes, and a warm 76.5 degrees. I just got back from a skateboarding excursion up the mountain from here, and found cloudy and foggy reality. Looking down into the central valley, I see some light haze, along with some developing cumulus clouds starting to form over the summits of the West Maui Mountains. This suggests the presence of a trough of low pressure in our area, with its associated cold air aloft. Warm air at the surface, and cold air above, are the makings of an unstable atmosphere…in other words more shower prone. Radar shows an area of light to moderately heavy, and even a few heavy showers, over the ocean to the north of Molokai, and east of Oahu at the time of this writing. / By the way, we have moderately thick volcanic haze (vog) back over Maui’s skies again.
~~~ We’re into the early evening hours now at 520pm, under a low hanging deck of clouds, although I can see blue skies further up the slopes of the Haleakala Crater…and sunshine down in the central valley. Before the clouds closed in over my area here in Kula, I could see lots of haze around here on Maui. I haven’t seen even a drop of rain here, although the cloud bases certainly do seem moisture laden. Oops, now at 525pm, big rain drops are finally falling, which has turned out to be a good shower! Despite all the clouds, its still rather warm at 68.5 degrees, with near calm winds.
World-wide tropical cyclone activity:
>>> Atlantic Ocean: The last regularly scheduled Tropical Weather Outlook of the 2014 Atlantic hurricane season…has occurred. Routine issuance of the Tropical Weather Outlook will resume on June 1, 2015. During the off-season, Special Tropical Weather Outlooks will be issued as conditions warrant.
Here’s a satellite image of the Atlantic Ocean
>>> Caribbean Sea: The last regularly scheduled Tropical Weather Outlook of the 2014 Atlantic hurricane season…has occurred. Routine issuance of the Tropical Weather Outlook will resume on June 1, 2015. During the off-season, Special Tropical Weather Outlooks will be issued as conditions warrant.
>>> Gulf of Mexico: The last regularly scheduled Tropical Weather Outlook of the 2014 Atlantic hurricane season…has occurred. Routine issuance of the Tropical Weather Outlook will resume on June 1, 2015. During the off-season, Special Tropical Weather Outlooks will be issued as conditions warrant.
Here’s a satellite image of the Caribbean Sea…and the Gulf of Mexico.
>>> Eastern Pacific: The last regularly scheduled Tropical Weather Outlook of the 2014 North Pacific hurricane season…has occurred. Routine issuance of the Tropical Weather Outlook will resume on May 15, 2015. During the off-season, Special Tropical Weather Outlooks will be issued as conditions warrant.
Here’s a wide satellite image that covers the entire area between Mexico, out through the central Pacific…to the International Dateline.
Here’s the link to the National Hurricane Center (NHC)
>>> Central Pacific: The central north Pacific hurricane season has officially ended. Routine issuance of the tropical weather outlook will resume on June 1, 2015. During the off-season, special tropical weather outlooks will be issued as conditions warrant.
Here’s a link to the Central Pacific Hurricane Center (CPHC)
>>> Northwest Pacific Ocean: There are no active tropical cyclones
>>> South Pacific Ocean: There are no active tropical cyclones
>>> North and South Indian Oceans: Tropical Cyclone 14S (Glenda) remains active in the South Indian Ocean, here’s the JTWC graphical track map…along with a Navy satellite image.
Here’s a link to the Joint Typhoon Warning Center (JTWC)
Interesting: Agricultural insecticides pose a global risk to surface water bodies – Streams within approximately 40% of the global land surface are at risk from the application of insecticides. These were the results from the first global map to be modeled on insecticide runoff to surface waters, which has just been published in the journal Environmental Pollution by researchers from the Helmholtz Center for Environmental Research (UFZ) and the University of Koblenz-Landau together with the University of Milan, Aarhus University and Aachen University. According to the publication, particularly streams in the Mediterranean, the USA, Central America and Southeast Asia are at risk.
Unlike other chemicals, agricultural pesticides are intentionally applied to the environment to help farmers control insects, weeds and other potentially harmful pests threatening agricultural production. They can therefore affect land ecosystems but also surface waters from runoff. According to estimates, ca. 4 million tons of agricultural pesticides are applied annually, equating to an average of 0.27 kilograms per hectare of the global land surface. “We know from earlier investigations for example that pesticides can reduce the biodiversity of invertebrates in freshwater ecosystems by up to 42 percent and that we can expect an increased application of pesticides as a result of climate change”, explains Prof. Dr. Matthias Liess from the UFZ, who was recently appointed to a term of five years on the scientific advisory board “National Action Plan on Sustainable Use of Plant Protection Products” where he advises the Federal Ministry of Food and Agriculture. Liess warns of an increase in the application of pesticides in many developing countries as farmers increasingly switch from traditionally extensive agricultural practices to more intensive ones. Until now the global extent of the potential water pollution from the application of insecticides has remained largely unknown.
The international team of scientists therefore came up with a global model with a raster of ca. ten kilometres, into which agricultural data from FAO and land use data from NASA among other data were entered. Annual average temperatures and monthly maximum precipitation measurements from around 77,000 weather stations were also taken into account. Following that, the researchers then estimated the so-called runoff potential (RP), in other words the amount of insecticides that enters streams and rivers through the rainwater from agricultural land. “In this respect, daily rainfall intensity, terrain slope, and insecticide application rate play an equally important role as well as the crops cultivated”, explains junior professor Dr. Ralf B. Schäfer from the University of Koblenz-Landau. “In order to test such complex models, we therefore carried out control measurements of insecticide contamination in freshwater ecosystems from four different regions”.
Several world maps were produced: the vulnerability map only takes into account the geographic and climatic background. The risk map on the other hand shows the risks from this natural vulnerability through anthropogenic land use. In Central Europe, scientists largely assessed the risk for water bodies as medium to high. In the northern hemisphere, insecticide runoff presented an overall more significant latitudinal gradient. „The risks of insecticide exposure to water bodies increased significantly the further South one travelled on a North-South gradient in Europe, North America and Asia, mainly driven by a higher insecticide application rate as a result of higher average temperatures“, Dr. Mira Kattwinkel reports, who is now conducting research at the Swiss Federal Institute of Aquatic Science and Technology (Eawag). Because the economy and the population are growing rapidly in many countries of the southern hemisphere, scientists expect a higher insecticide application rate in those countries in the future to cover an increase in agricultural production. The map could therefore still change colour considerably in other parts of the world. At the moment it is water bodies in the Mediterranean, the USA, Central America and Southeast Asia that are particularly vulnerable.
In Southeast Asia, countries such as the Philippines or Vietnam are greatly affected for example. UFZ researchers are looking into solutions for such regions within the framework of the LEGATO-project together with the International Rice Research Institute (IRRI), in an attempt to reduce pesticide application rates. One approach for example could be to revitalise the functioning of ecosystems so that the natural competitors of rice pests can help to avoid their mass reproduction and subsequent harvest yield losses.
“Our analysis provides a global map of hotspots for insecticide contamination that are a major risk for biodiversity in water bodies. To our knowledge this is the first study that assesses insecticide contamination of water bodies on a global scale“, Prof. Dr. Matthias Liess summarizes the significance of the new investigation. The researchers intend to use the global map to sensitize citizens and authorities about this issue in vulnerable regions and to incite local investigations. Buffer zones along the edge of water bodies can significantly reduce negative impacts for example. Efficient environmental management and conservation efforts in the future should focus on informing authorities and farmers about the costs, impacts and alternatives. Ultimately, mitigation and management takes place at the local level, determining the extent to which a water body will be affected under the application of such chemicals.
Wayne Says:
Just ran across this website – lots of good weather/climate information, thanks! ~~~ You’re welcome Wayne, Aloha…Glenn