


Air Temperatures – The following maximum temperatures (F) were recorded across the state of Hawaii Wednesday:
87 Lihue, Kauai
89 Honolulu, Oahu
86 Molokai
92 Kahului, Maui – record high temperature for Wednesday was 93 degrees…back in 1984
89 Kailua Kona
85 Hilo, Hawaii
Here are the latest 24-hour precipitation totals (inches) for each of the islands, as of Wednesday evening:
0.15 Wailua, Kauai
0.30 Poamoho RG 1, Oahu
0.11 Molokai
0.00 Lanai
0.00 Kahoolawe
0.09 Ulupalakua, Maui
0.43 Kahua Ranch, Big Island
The following numbers represent the strongest wind gusts (mph)…as of Wednesday evening:
22 Port Allen, Kauai
20 Oahu Forest NWR, Oahu
25 Molokai
28 Lanai
29 Kahoolawe
23 Kahului AP, Maui
22 Upolu AP, Big Island
Hawaii’s Mountains – Here’s a link to the live web cam on the summit of near 13,800 foot Mauna Kea on the Big Island of Hawaii. This web cam is available during the daylight hours here in the islands…and when there’s a big moon shining down during the night at times. Plus, during the nights you will be able to see stars, and the sunrise and sunset too… depending upon weather conditions.
Aloha Paragraphs


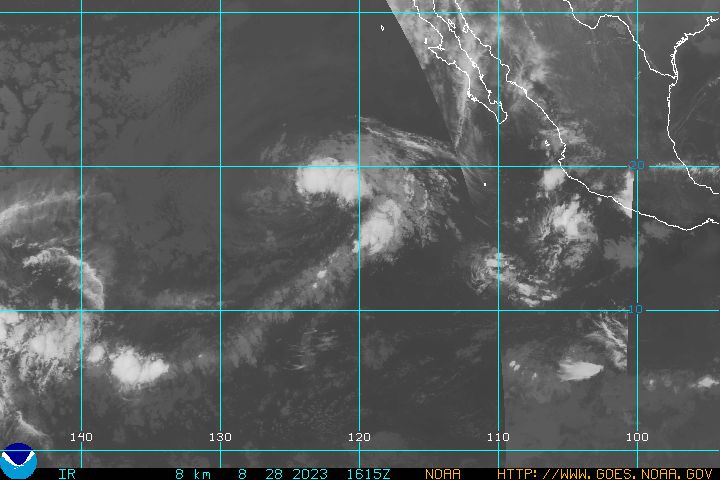
The satellite imagery above shows lots of thunderstorm
activity to the southwest of Hawaii
Light, locally stronger trade winds with afternoon
upcountry clouds and showers here and there,
along with some windward showers locally, mostly
during the night and early morning hours~~~our winds
will turn very light Sunday into early next week – sultry
~~~ Hawaii Weather Narrative ~~~
The generally light trade winds will remain active this week…although will fade away later this weekend into early next week. Here’s the latest weather map, showing the Hawaiian Islands, and the rest of the North Pacific Ocean, along with a real-time wind profiler of the central Pacific. We find high pressure systems to the northeast. Meanwhile, there’s many low pressure systems to the north and northwest of the islands. The light trade winds, locally a stronger in gusts at times, will remain in place through Saturday…then become lighter Sunday into early next week. This will bring muggy conditions to the state, until the trade winds return around next Wednesday or so.
Satellite imagery shows clear to partly cloudy skies over the islands…with high cirrus clouds not far to the southwest. Looking at this larger looping satellite image, it shows thunderstorms offshore to the southwest of Hawaii. The light winds over our region, in conjunction with the daytime heating of the islands, will prompt afternoon clouds and some showers locally over our leeward upcountry slopes. The trade winds, despite being on the lighter side of normal, will bring the windward sides a few incoming showers too. In general, rainfall will remain on the light side over the next several days. Here’s the looping radar, showing just a few showers moving across our island chain, which will continue in an off and on manner. I’ll be back with more updates on all of the above and below, I hope you have a great Wednesday night wherever you happen to be spending it! Aloha for now…Glenn.
World-wide tropical cyclone activity:
>>> Atlantic Ocean: Tropical Depression 06L is now active in the Atlantic, located about 870 miles west of the Cape Verde Islands…with sustained winds of near 35 mph. Here’s a graphical track map…along with a satellite image.
Here's what the computer models are showing for Tropical depression 06L.
1.) Shower activity associated with a weak low pressure area near the
northwestern Bahamas is currently poorly organized, and the Air
Force Reserve Hurricane Hunter mission scheduled for today has been
canceled.  Upper-level winds are forecast to become unfavorable for
significant development while the low moves slowly westward or
west-southwestward toward southern Florida.  Regardless of
development, this low will bring locally heavy rains to portions of
southern Florida and the Florida Keys during the next couple of
days.
Here's what the computer models are showing for this disturbance being referred to as Invest 92L.
* Formation chance through 48 hours...low...20 percent * Formation chance through 5 days...medium...30 percent
Here’s a satellite image of the Atlantic Ocean
>>> Caribbean Sea: There are no active tropical cyclones
>>> Gulf of Mexico: There are no active tropical cyclones
Here’s a satellite image of the Caribbean Sea…and the Gulf of Mexico.
Here’s the link to the National Hurricane Center (NHC)
>>> Eastern Pacific: Tropical Storm 15E (Odile) remain active in the northeast Pacific, located about 230 miles southwest of Lazaro Cardenas, Mexico…with sustained winds of near 50 mph. Here’s a graphical track map…along with a satellite image.
Here’s what the computer models are showing for this strengthening tropical storm Odile.
Tropical Depression 16E is now active in the northeast Pacific, located about 775 miles southwest of the southern tip of Baja California…with sustained winds of near 35 mph. Here’s a graphical track map…along with a satellite image.
Here’s what the computer models are showing for this strengthening tropical depression
1.) Showers and thunderstorms remain disorganized near a broad trough
of low pressure located about 1300 miles southwest of the southern
tip of the Baja California peninsula. Some development of this
system is possible during the next few days while it moves
northward and then northeastward at 5 to 10 mph

Here's what the computer models are showing for this disturbance being referred to as Invest 96S.
* Formation chance through 48 hours...low...20 percent
* Formation chance through 5 days...medium...30 percent
Here’s a wide satellite image that covers the entire area between Mexico, out through the central Pacific…to the International Dateline.
>>> Central Pacific: There are no active tropical cyclones
1.) An area of disorganized showers and thunderstorms are associated with a surface trough about 720 miles southwest of Honolulu Hawaii. There is a low potential for slow development of this system as it moves generally westward at around 5 mph. Here’s a satellite image showing this area.
* Formation chance through 48 hours, low…near…10 percent.
Here’s a link to the Central Pacific Hurricane Center (CPHC)
>>> Northwest Pacific Ocean: Tropical depression 15W remains active in the northwest Pacific, located about 267 miles north-northwest of Yap…with sustained winds of near 29 mph. Here’s a graphical track map…along with a satellite image.
>>> South Pacific Ocean: There are no active tropical cyclones
>>> North and South Indian Oceans: There are no active tropical cyclones
Here’s a link to the Joint Typhoon Warning Center (JTWC)
Interesting: Greenhouse gases hit new record– The World Meteorological Organization (WMO) has reported that the amounts of atmospheric greenhouse gases reached a new high in 2013, driven by rapidly rising levels of carbon dioxide.
The news is consistent with trends in fossil fuel consumption. But what comes as more of a surprise is the WMO’s revelation that the current rate of ocean acidification, which greenhouse gases (GHGs) help to cause, appears unprecedented in at least the last 300 million years.
“We know without any doubt that our climate is changing and our weather is becoming more extreme due to human activities such as the burning of fossil fuels”, said the WMO’s secretary-general, Michel Jarraud.
“The Greenhouse Gas Bulletin shows that, far from falling, the concentration of carbon dioxide in the atmosphere actually increased last year at the fastest rate for nearly 30 years. We are running out of time. The laws of physics are non-negotiable.”
A 34% increase in radiative forcing from 1990 – 2013
The details of growing GHG levels are in the annual Greenhouse Gas Bulletin, published by the WMO – the United Nations specialist agency that plays a leading role in international efforts to monitor and protect the environment.
The Bulletin reports on atmospheric concentrations – not emissions – of greenhouse gases. Emissions are what go into the atmosphere, while concentrations are what stay there after the complex system of interactions between the atmosphere, biosphere (the entire global ecological system) and the oceans.
The Bulletin shows that between 1990 and 2013 there was a 34% increase in radiative forcing – the warming effect on our climate – because of long-lived greenhouse gases such as carbon dioxide (CO2), methane and nitrous oxide.
About a quarter of total emissions are taken up by the oceans and another quarter by the biosphere, cutting levels of atmospheric CO2.
In 2013, the atmospheric concentration of CO2 was 142% higher than before the Industrial Revolution started, in about 1750. Concentrations of methane and nitrous oxide had risen by 253% and 121% respectively.