May 2009
Monthly Archive
Posted by Glenn
No Comments
May 31-June 1, 2009
Air Temperatures – The following maximum temperatures were recorded across the state of Hawaii Sunday afternoon:
Lihue, Kauai – 83
Honolulu, Oahu – 92
Kaneohe, Oahu – 83
Kahului, Maui – 90
Hilo, Hawaii – 86
Kailua-kona – 85
Air Temperatures ranged between these warmest and coolest spots near sea level – and on the highest mountains…at 4 p.m. Sunday afternoon:
Honolulu, Oahu – 88F
Lihue, Kauai – 81
Haleakala Crater – 59 (near 10,000 feet on Maui)
Mauna Kea summit – 43 (near 14,000 feet on the Big Island)
Precipitation Totals – The following numbers represent the largest precipitation totals (inches) during the last 24 hours on each of the major islands, as of Sunday afternoon:
0.03 Mount Waialaele, Kauai
0.18 Mililani, Oahu
0.00 Molokai
0.00 Lanai
0.00 Kahoolawe
0.00 Maui
0.01 Kamuela, Big Island
Marine Winds – Here’s the latest (automatically updated) weather map shows a 1022 millibar high pressure system to the northeast of Hawaii, with its associated ridge to our north and northwest of Kauai. This ridge is just far enough north of us now, that trade winds have returned to the Big Island, and Maui County. The rest of the state will have lighter winds, with returning trade winds gradually developing going forward.
Satellite and Radar Images: To view the cloud conditions we have here in Hawaii, please use the following satellite links, starting off with the Infrared Satellite Image of the islands to see all the clouds around the state during the day and night. This next image is one that gives close images of the islands only during the daytime hours, and is referred to as a Close-up visible image. This next image shows a larger view of the Pacific…giving perspective to the wider ranging cloud patterns in the Pacific Ocean. Finally, here’s a looping IR satellite image, making viewable the clouds around the islands 24 hours a day. To help you keep track of where any showers may be around the islands, here’s the latest animated radar image.
Hawaii’s Mountains – Here’s a link to the live webcam on the summit of near 14,000 foot Mauna Kea on the Big Island of Hawaii. The tallest peak on the island of Maui is the Haleakala Crater, which is near 10,000 feet in elevation. These two webcams are available during the daylight hours here in the islands…and when there’s a big moon rising just after sunset for an hour or two! Plus, during the nights and early mornings you will be able to see stars, and the sunrise too…depending upon weather conditions.
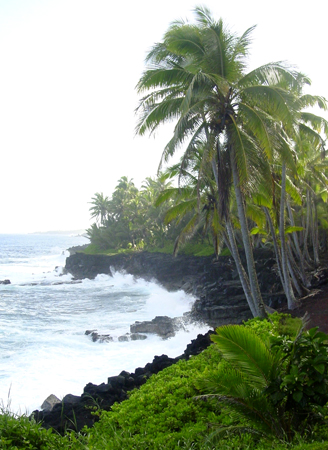
Aloha Paragraphs

Breaking island waves
Artist Credit: Pierre Bouret
The trade winds will blow over the Big Island, and parts of Maui County going into Monday…then return more fully into the rest of the state over the next day or two. Looking at this weather map Sunday evening, we see a high pressure system to our northeast, with its associated ridge far enough north of Kauai…that light trade winds have returned to the southern part of the island chain now. These trade winds will continue blowing through the rest of the new week ahead, lasting into the following week. This of course will ventilate our Aloha state of all the recent haze. The sultry conditions of late will end too, putting us back into a more normal…late spring trade wind weather pattern.
Less clouds, and more daytime sunshine will be the name of the game now, with just a few showers…gradually making their way back to the windward sides. The threat of showers has faded now, as low pressure is replaced with a more typical high pressure ridge to our north. In the upper atmosphere, the air will be dry and stable too, helping to limit showers as well. As the trade winds gradually fill back in, we’ll likely see the return of a few windward biased showers going forward. The overall weather pattern will be a dry one however, so that we’ll see lots more sunshine during the days.
It’s Sunday evening here in Kula, Maui, as I begin writing this last section of today’s narrative. Sunday was one of those gloriously sunny days just about everywhere here in the Hawaiian Islands. Rainfall was just about absent everywhere as well, leaving almost all rain gauges dry. High temperatures rocketed way up there today with the clear skies. The Honolulu airport saw the highest reading, with just short of an all time record maximum of 92F degrees. The airport at Kahului too was hot, reaching 90 degrees. I see little change coming up over the next few days, with more hot weather, along with the return of the trade winds statewide soon too. While I was down at Paia beach today, having a walk and swim, there were white caps chalking-up the surrounding ocean surface, with light trade winds finally making an appearance.
~~~ Here in Kula, the air temperature at near 5pm Sunday afternoon, according to my outside thermometer in the shade, was a warm 74.8F degrees. Here inside my weather tower, with all the windows open, it was an even warmer 81 degrees. My wind chimes are sounding off nicely, with that breeze taking the edge off the heat a little. Gosh, this weekend seemed so short, especially as I look forward to another busy week at work coming up. The islands have their annual Makani Pahili hurricane exercise over the next several days, and as Monday is June 1st…that marks the beginning of the central Pacific hurricane season, which ends on the last day of November. ~~~ I’m going to try and stay cool through the rest of the evening, and will meet you here again early Monday morning, I hope you have a great Sunday night until then! Aloha for now…Glenn.
This is a quote from NASA’s Director of the Goddard Institute for Space Studies, James Hansen…as a plea to Barack and Michelle Obama: There are long lists of things people can do to mitigate climate change. But the sine qua non for solving the problem is to stop burning coal. Coal is responsible for as much atmospheric carbon dioxide as all other fossil fuels combined, and is even more of a long-term threat given the earth’s enormous coal reserves. (Oil, the second-greatest contributor to atmospheric carbon dioxide, is already depleted.) The safer upper limit for atmospheric C02 is 350 parts per million. We are currently at 385 ppm. Continued reliance on coal-fired power plants will raise atmospheric carbon dioxide to near 500 ppm. At that level, a conservative estimate for the number of species that would be exterminated is one million. Coal plants are factories of death.
The world must end coal emissions rapidly, through a moratorium on new coal-fired power plants, and a phaseout of those that do not capture and store carbon dioxide (no commercial plants do at present). This is a great challenge but one with enormous side benefits, including reduced local pollution and a sharp decrease in the toxic mercury (a byproduct of coal-fired power plants) that is now accumulating in fish stocks through-out the oceans. If coal emissions are promptly phased out, other actions–for example, improved agricultural and forestry practices–could bring the level of atmospheric carbon dioxide out of the dangerous range and save the planet we know–the planet of stable climate in which civilization developed.
Posted by Glenn
No Comments
May 30-31, 2009
Air Temperatures – The following maximum temperatures were recorded across the state of Hawaii Saturday afternoon:
Lihue, Kauai – 82
Honolulu, Oahu – 88
Kaneohe, Oahu – 82
Kahului, Maui – 88
Hilo, Hawaii – 85
Kailua-kona – 86
Air Temperatures ranged between these warmest and coolest spots near sea level – and on the highest mountains…at 4 p.m. Saturday afternoon:
Kapalua, Maui – 88F
Lihue, Kauai – 80
Haleakala Crater – 59 (near 10,000 feet on Maui)
Mauna Kea summit – 45 (near 14,000 feet on the Big Island)
Precipitation Totals – The following numbers represent the largest precipitation totals (inches) during the last 24 hours on each of the major islands, as of Saturday afternoon:
0.27 Anahola, Kauai
0.20 Hakipuu Mauka, Oahu
0.00 Molokai
0.01 Lanai
0.02 Kahoolawe
0.16 Kahakuloa, Maui
0.03 Hakalau, Big Island
Marine Winds – Here’s the latest (automatically updated) weather map shows a 1006 millibar low pressure system to the northeast of Hawaii, with its associated front and trough to northeast and south of the Big Island. This pressure configuration will keep light breezes in place, gradually turning easterly into Monday.
Satellite and Radar Images: To view the cloud conditions we have here in Hawaii, please use the following satellite links, starting off with the Infrared Satellite Image of the islands to see all the clouds around the state during the day and night. This next image is one that gives close images of the islands only during the daytime hours, and is referred to as a Close-up visible image. This next image shows a larger view of the Pacific…giving perspective to the wider ranging cloud patterns in the Pacific Ocean. Finally, here’s a looping IR satellite image, making viewable the clouds around the islands 24 hours a day. To help you keep track of where any showers may be around the islands, here’s the latest animated radar image.
Hawaii’s Mountains – Here’s a link to the live webcam on the summit of near 14,000 foot Mauna Kea on the Big Island of Hawaii. The tallest peak on the island of Maui is the Haleakala Crater, which is near 10,000 feet in elevation. These two webcams are available during the daylight hours here in the islands…and when there’s a big moon rising just after sunset for an hour or two! Plus, during the nights and early mornings you will be able to see stars, and the sunrise too…depending upon weather conditions.
Aloha Paragraphs

Napali coast…Kauai
Artist Credit: Pierre Bouret
The long lost trade winds are right around the corner, and once they start…there will be no holding them back! The latest computer models are now suggesting that the trade winds are heading our way, which is such good news! Looking at this weather map Saturday evening, we still see a long lasting 1006 millibar low pressure system to the northeast, with its trailing front and trough, positioned to the northeast and south of the Big Island. The weather map continues to show the isobars widely spaced here in the tropical latitudes of the central Pacific Ocean. Thus, the overall air flow remains light, with onshore flowing sea breezes…but keep an eye out for those returning trade wind breezes!
There will be clouds around at times, and a few showers, but much less than during the last several days, as we move through this weekend…into the new week ahead. The area of low pressure, mentioned above, will keep us in what we call a convective weather pattern. Mornings will be quite clear, although clouds will congregate locally over and around the mountains during the afternoons. The threat of heavy showers has faded now however, although some of these clouds will drop showers in the upcountry areas. As the trade winds fill back in soon, we’ll likely see the return of a few windward biased showers going forward.
Friday evening I went to see a new film called Terminator Salvation (2009), starring Christian Bale and Sam Worthington…among others. I really needed to space out into a movie, after a long and somewhat difficult work week. It was a good escape, full of all the usual action that I often turn to after work on Friday. I can’t recommend this film to probably 90% of you readers, as it involves all those things that most folks would not be interested in, including: intense sequences of sci-fi violence, action and language. Interestingly enough, there was a row of young kids sitting right in front of me. At any rate, not that anyone would want to view it, but here’s a trailer nonetheless. What can I say, I would prefer to see great Indie films, but they just don’t make it to Maui all that often…at least at times that I can attend.
It’s Saturday evening here in Kula, Maui, as I begin writing this last section of today’s narrative. What a day! Saturday was a completely different day than we’ve seen anytime lately. The only thing missing was the trade winds, but as noted above, they’re now forecast to return soon. There was enough of a breeze today, generally from those onshore flowing sea breezes, that some of the haze of late was moved around some. The heavy duty afternoon clouds lately were gone, and here in Kula, there was lots of sunshine during the day…as there was just about everywhere else.
~~~ For some reason, just as I was sitting here writing these words, it occurred to me that I feel like doing a little putting, you know, like at the golf course. I’m also feeling a bit like playing ping pong, so I may get out there and hit that little white ball this evening, while enjoying the sunset.
~~~ I’ll be back Sunday morning, although maybe not at the crack of dawn, like I do on a Monday through Saturday basis. I hope you have a great Saturday night wherever you happen to be reading from! Aloha for now…Glenn.
Interesting: An explosion of knowledge has been made in the last few years about the basic biology of corals, researchers say in a new report, helping to explain why coral reefs around the world are collapsing and what it will take for them to survive a gauntlet of climate change and ocean acidification. Corals, it appears, have a genetic complexity that rivals that of humans, have sophisticated systems of biological communication that are being stressed by global change, and are only able to survive based on proper function of an intricate symbiotic relationship with algae that live within their bodies.
After being a highly successful life form for 250 million years, disruptions in these biological and communication systems are the underlying cause of the coral bleaching and collapse of coral reef ecosystems around the world, scientists report in the journal Science. The research was funded in part by the National Science Foundation. "We’ve known for some time the general functioning of corals and the problems they are facing from climate change," said Virginia Weis, a professor of zoology at Oregon State University.
"But until just recently, much less has been known about their fundamental biology, genome structure and internal communication. Only when we really understand how their physiology works will we know if they can adapt to climate changes, or ways that we might help." Corals are tiny animals, polyps that exist as genetically identical individuals, and can eat, defend themselves and kill plankton for food. In the process they also secrete calcium carbonate that becomes the basis for an external skeleton on which they sit.
These calcified deposits can grow to enormous sizes over long periods of time and form coral reefs – one of the world’s most productive ecosystems, which can harbor more than 4,000 species of fish and many other marine life forms. But corals are not really self sufficient. Within their bodies they harbor highly productive algae – a form of marine plant life – that can "fix" carbon, use the energy of the sun to conduct photosynthesis and produce sugars.
"Some of these algae that live within corals are amazingly productive, and in some cases give 95 percent of the sugars they produce to the coral to use for energy," Weis said. "In return the algae gain nitrogen, a limiting nutrient in the ocean, by feeding off the waste from the coral. It’s a finely developed symbiotic relationship."
What scientists are learning, however, is that this relationship is also based on a delicate communication process from the algae to the coral, telling it that the algae belong there, and that everything is fine. Otherwise the corals would treat the algae as a parasite or invader and attempt to kill it.
Interesting2: Honey bee colony losses nationwide were approximately 29 percent from all causes from September 2008 to April 2009, according to a survey conducted by the Apiary Inspectors of America (AIA) and the U.S. Department of Agriculture. This is less than the overall losses of about 36 percent from 2007 to 2008, and about 32 percent from 2006 to 2007, that have been reported in similar surveys.
"While the drop in losses is encouraging, losses of this magnitude are economically unsustainable for commercial beekeeping," said Jeff Pettis, research leader of the Agricultural Research Service (ARS) Bee Research Laboratory in Beltsville, Md. ARS is USDA’s principal intramural scientific research agency.
The survey was conducted by Pettis; Dennis vanEngelsdorp, president of AIA; and Jerry Hayes, AIA past president. About 26 percent of apiaries surveyed reported that some of their colonies died of colony collapse disorder (CCD), down from 36 percent of apiaries in 2007-2008. CCD is characterized by the sudden, complete absence of honey bees in a colony.
The cause of CCD is still unknown. As this was an interview-based survey, it is not possible to differentiate between verifiable cases of CCD and colonies lost as the result of other causes that share the "absence of dead bees" as a symptom.
However, among beekeepers that reported any colonies collapsing without the presence of dead bees, each lost an average of 32 percent of their colonies in 2008-2009, while apiaries that did not lose any bees with symptoms of CCD each lost an average of 26 percent of their colonies.
To strengthen the beekeeping industry, ARS recently began a five-year areawide research program to improve honey bee health, survivorship and pollination. Honey bee pollination is critical to agriculture, adding more than $15 billion to the value of American crops each year. The survey checked on about 20 percent of the country’s 2.3 million colonies.
Interesting3: The first-ever comprehensive assessment of Arctic oil and gas deposits reveals that 13% of the world’s undiscovered oil and 30% of its undiscovered natural gas could be trapped beneath the far north’s barren land and icy waters. The potential resources are unlikely to alter world trends in oil and gas trade, however, and will probably keep Russia the king of natural gas for years to come.
Because of the Arctic’s remote location and harsh environment, oil and gas exploration has been limited to just a few areas off the coasts of northern countries, such as the United States and Russia. But dwindling oil reserves (expected to peak in production by about 2020), waning opportunities for exploration elsewhere, and the melting of sea ice have recently made the Arctic a more attractive option. But just how much does the Arctic have to offer?
About 5 years ago, geologist Donald Gautier of the U.S. Geological Survey (USGS) in Menlo Park, California, and his colleagues decided to find out. First, they created a geological map of the Arctic to identify sedimentary rocks, which have the potential to carry oil and gas. Then they subdivided the rocks into specific groups based on their geologic properties and compared them with groups elsewhere in the world known to contain oil and gas.
The researchers report online today in Science magazine, that the Arctic likely contains about 83 billion barrels of undiscovered oil. That represents about 4% of the world’s remaining conventional oil and enough to sustain global demand for almost 3 years. At the same time, the Arctic probably contains about 1550 trillion cubic feet of natural gas–enough to meet world demand for about 14 years. Most of the resources lie offshore under less than 500 meters of water, which means they are accessible to drilling.
Posted by Glenn
No Comments
May 29-30, 2009
Air Temperatures – The following maximum temperatures were recorded across the state of Hawaii Friday afternoon:
Lihue, Kauai – 82
Honolulu, Oahu – 88
Kaneohe, Oahu – 80
Kahului, Maui – 84
Hilo, Hawaii – 83
Kailua-kona – 83
Air Temperatures ranged between these warmest and coolest spots near sea level – and on the highest mountains…at 5 p.m. Friday evening:
Honolulu, Oahu – 84F
Lihue, Kauai – 78
Haleakala Crater – 52 (near 10,000 feet on Maui)
Mauna Kea summit – 39 (near 14,000 feet on the Big Island)
Precipitation Totals – The following numbers represent the largest precipitation totals (inches) during the last 24 hours on each of the major islands, as of Friday evening:
0.66 Anahola, Kauai
0.59 Honolulu airport, Oahu
0.00 Molokai
0.00 Lanai
0.00 Kahoolawe
0.36 Kula, Maui
0.04 Honaunau, Big Island
Marine Winds – Here’s the latest (automatically updated) weather map shows a 998 millibar low pressure system to the northeast of Hawaii, with its associated front and trough extending southwest across the islands of Maui County. This pressure configuration will keep light breezes in place, gradually turning more southeast…with localized sea breezes through Sunday.
Satellite and Radar Images: To view the cloud conditions we have here in Hawaii, please use the following satellite links, starting off with the Infrared Satellite Image of the islands to see all the clouds around the state during the day and night. This next image is one that gives close images of the islands only during the daytime hours, and is referred to as a Close-up visible image. This next image shows a larger view of the Pacific…giving perspective to the wider ranging cloud patterns in the Pacific Ocean. Finally, here’s a looping IR satellite image, making viewable the clouds around the islands 24 hours a day. To help you keep track of where any showers may be around the islands, here’s the latest animated radar image.
Hawaii’s Mountains – Here’s a link to the live webcam on the summit of near 14,000 foot Mauna Kea on the Big Island of Hawaii. The tallest peak on the island of Maui is the Haleakala Crater, which is near 10,000 feet in elevation. These two webcams are available during the daylight hours here in the islands…and when there’s a big moon rising just after sunset for an hour or two! Plus, during the nights and early mornings you will be able to see stars, and the sunrise too…depending upon weather conditions.
Aloha Paragraphs
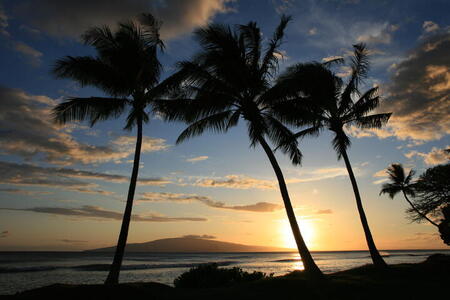
Tropical sunset in the islands
A light wind regime remains active over the Hawaiian Islands going into the weekend. This unusual pattern has held sway all week, and will remain in place through the upcoming weekend. Looking at this weather map Friday evening, we see a deepening 998 millibar low pressure system to the northeast, with its trailing front and trough, extending southwest over the islands of Maui County. The weather map continues to show the isobars widely spaced here in the tropical latitudes of the central Pacific Ocean. The onset of the trade winds will have to wait until we move into the new week ahead…perhaps well into the new week.
We continue to find our area influenced by low pressure, rather than high pressure…as is often the case during the late spring. These areas of low pressure will keep lots of clouds in the forecast, especially during the afternoon hours. There’s a pretty good chance that some of these clouds will drop showers in the upcountry areas…perhaps still on the heavy side. Meanwhile, at the higher realms of our atmosphere, we have a rather extensive area of high cirrus clouds moving overhead. This looping satellite image shows this high icy moisture riding in on the upper winds aloft, from the southwest. Saturday will continue to be partly to mostly cloudy…as has been the case much of this week.
More and more people are starting to look outside and wonder what in the heck is happening here! Day after day of light winds, muggy air, and too many clouds seem to have become the norm lately. This is all occurring at a time of the year, when we "should be" seeing at least moderately strong trade winds blowing, along with mostly sunny to partly cloudy skies, and just a few windward biased showers. Let’s see…what can we call these conditions? Unusual, uncommon, bordering on rare, among other things I’m sure. I agree, this is not normal, far from it actually. If it weren’t so sultry at our local beaches during the days, we could probably call it rather fascinating…although many folks aren’t probably thinking about it in such positive terms!
It’s Friday evening here in Kihei, Maui, as I begin writing this last section of today’s narrative. I’m pooped, it’s been a big week in terms of my work! I’ve been handling the work (at my day job at the Pacific Disaster Center) in regards to this big hurricane exercise in the state of Hawaii…called Makani Pahili. At the same time, I’ve been handling a big meeting with the National Weather Service, again at my day job, where we had a joint meeting revolving around the upcoming hurricane season here in the central Pacific. At any rate, It’s well after work hours now, and as I look out the window here in Kihei, it’s what else…cloudy and hazy out there. ~~~ I’ve decided to go see a new film called Terminator Salvation (2009), starring Christian Bale and Sam Worthington, among others. If I’m going to make the show though, I need to blast out of here, and take the drive over to Kahului, where it’s playing. I’ll be back Saturday morning with your next new weather narrative, and a report about what I thought of this new film. I hope you have a great Friday night until then! Aloha for now…Glenn.
Interesting: An explosion of knowledge has been made in the last few years about the basic biology of corals, researchers say in a new report, helping to explain why coral reefs around the world are collapsing and what it will take for them to survive a gauntlet of climate change and ocean acidification. Corals, it appears, have a genetic complexity that rivals that of humans, have sophisticated systems of biological communication that are being stressed by global change, and are only able to survive based on proper function of an intricate symbiotic relationship with algae that live within their bodies.
After being a highly successful life form for 250 million years, disruptions in these biological and communication systems are the underlying cause of the coral bleaching and collapse of coral reef ecosystems around the world, scientists report in the journal Science. The research was funded in part by the National Science Foundation. "We’ve known for some time the general functioning of corals and the problems they are facing from climate change," said Virginia Weis, a professor of zoology at Oregon State University.
"But until just recently, much less has been known about their fundamental biology, genome structure and internal communication. Only when we really understand how their physiology works will we know if they can adapt to climate changes, or ways that we might help." Corals are tiny animals, polyps that exist as genetically identical individuals, and can eat, defend themselves and kill plankton for food. In the process they also secrete calcium carbonate that becomes the basis for an external skeleton on which they sit.
These calcified deposits can grow to enormous sizes over long periods of time and form coral reefs – one of the world’s most productive ecosystems, which can harbor more than 4,000 species of fish and many other marine life forms. But corals are not really self sufficient. Within their bodies they harbor highly productive algae – a form of marine plant life – that can "fix" carbon, use the energy of the sun to conduct photosynthesis and produce sugars.
"Some of these algae that live within corals are amazingly productive, and in some cases give 95 percent of the sugars they produce to the coral to use for energy," Weis said. "In return the algae gain nitrogen, a limiting nutrient in the ocean, by feeding off the waste from the coral. It’s a finely developed symbiotic relationship."
What scientists are learning, however, is that this relationship is also based on a delicate communication process from the algae to the coral, telling it that the algae belong there, and that everything is fine. Otherwise the corals would treat the algae as a parasite or invader and attempt to kill it.
Interesting2: Honey bee colony losses nationwide were approximately 29 percent from all causes from September 2008 to April 2009, according to a survey conducted by the Apiary Inspectors of America (AIA) and the U.S. Department of Agriculture. This is less than the overall losses of about 36 percent from 2007 to 2008, and about 32 percent from 2006 to 2007, that have been reported in similar surveys.
"While the drop in losses is encouraging, losses of this magnitude are economically unsustainable for commercial beekeeping," said Jeff Pettis, research leader of the Agricultural Research Service (ARS) Bee Research Laboratory in Beltsville, Md. ARS is USDA’s principal intramural scientific research agency.
The survey was conducted by Pettis; Dennis vanEngelsdorp, president of AIA; and Jerry Hayes, AIA past president. About 26 percent of apiaries surveyed reported that some of their colonies died of colony collapse disorder (CCD), down from 36 percent of apiaries in 2007-2008. CCD is characterized by the sudden, complete absence of honey bees in a colony.
The cause of CCD is still unknown. As this was an interview-based survey, it is not possible to differentiate between verifiable cases of CCD and colonies lost as the result of other causes that share the "absence of dead bees" as a symptom.
However, among beekeepers that reported any colonies collapsing without the presence of dead bees, each lost an average of 32 percent of their colonies in 2008-2009, while apiaries that did not lose any bees with symptoms of CCD each lost an average of 26 percent of their colonies.
To strengthen the beekeeping industry, ARS recently began a five-year areawide research program to improve honey bee health, survivorship and pollination. Honey bee pollination is critical to agriculture, adding more than $15 billion to the value of American crops each year. The survey checked on about 20 percent of the country’s 2.3 million colonies.
Interesting3: The first-ever comprehensive assessment of Arctic oil and gas deposits reveals that 13% of the world’s undiscovered oil and 30% of its undiscovered natural gas could be trapped beneath the far north’s barren land and icy waters. The potential resources are unlikely to alter world trends in oil and gas trade, however, and will probably keep Russia the king of natural gas for years to come.
Because of the Arctic’s remote location and harsh environment, oil and gas exploration has been limited to just a few areas off the coasts of northern countries, such as the United States and Russia. But dwindling oil reserves (expected to peak in production by about 2020), waning opportunities for exploration elsewhere, and the melting of sea ice have recently made the Arctic a more attractive option. But just how much does the Arctic have to offer?
About 5 years ago, geologist Donald Gautier of the U.S. Geological Survey (USGS) in Menlo Park, California, and his colleagues decided to find out. First, they created a geological map of the Arctic to identify sedimentary rocks, which have the potential to carry oil and gas. Then they subdivided the rocks into specific groups based on their geologic properties and compared them with groups elsewhere in the world known to contain oil and gas.
The researchers report online today in Science magazine, that the Arctic likely contains about 83 billion barrels of undiscovered oil. That represents about 4% of the world’s remaining conventional oil and enough to sustain global demand for almost 3 years. At the same time, the Arctic probably contains about 1550 trillion cubic feet of natural gas–enough to meet world demand for about 14 years. Most of the resources lie offshore under less than 500 meters of water, which means they are accessible to drilling.
Posted by Glenn
No Comments
May 28-29, 2009
Air Temperatures – The following maximum temperatures were recorded across the state of Hawaii Thursday afternoon:
Lihue, Kauai – 82
Honolulu, Oahu – 87
Kaneohe, Oahu – 80
Kahului, Maui – 85
Hilo, Hawaii – 85
Kailua-kona – 84
Air Temperatures ranged between these warmest and coolest spots near sea level – and on the highest mountains…at 4 p.m. Thursday afternoon:
Barking Sands, Kauai – 84F
Kaneohe, Oahu – 74
Haleakala Crater – 55 (near 10,000 feet on Maui)
Mauna Kea summit – 43 (near 14,000 feet on the Big Island)
Precipitation Totals – The following numbers represent the largest precipitation totals (inches) during the last 24 hours on each of the major islands, as of Thursday afternoon:
1.16 Hanalei River, Kauai
1.73 Bellows AFS, Oahu
0.50 Molokai
1.42 Lanai
0.20 Kahoolawe
0.53 Kaupo Gap, Maui
0.02 South Point, Big Island
Marine Winds – Here’s the latest (automatically updated) weather map shows a 998 millibar low pressure system to the northeast of Hawaii, with its associated front and trough extending southwest across the central portion of the island chain. This pressure configuration will keep light breezes in place, generally from the southeast to southwest…with localized sea breezes through Saturday.
Satellite and Radar Images: To view the cloud conditions we have here in Hawaii, please use the following satellite links, starting off with the Infrared Satellite Image of the islands to see all the clouds around the state during the day and night. This next image is one that gives close images of the islands only during the daytime hours, and is referred to as a Close-up visible image. This next image shows a larger view of the Pacific…giving perspective to the wider ranging cloud patterns in the Pacific Ocean. Finally, here’s a looping IR satellite image, making viewable the clouds around the islands 24 hours a day. To help you keep track of where any showers may be around the islands, here’s the latest animated radar image.
Hawaii’s Mountains – Here’s a link to the live webcam on the summit of near 14,000 foot Mauna Kea on the Big Island of Hawaii. The tallest peak on the island of Maui is the Haleakala Crater, which is near 10,000 feet in elevation. These two webcams are available during the daylight hours here in the islands…and when there’s a big moon rising just after sunset for an hour or two! Plus, during the nights and early mornings you will be able to see stars, and the sunrise too…depending upon weather conditions.
Aloha Paragraphs

Lumahi Beach…Kauai
Our local winds will remain light and generally variable in direction, locking in the sultry conditions…along with the hazy atmosphere. Looking at this weather map Thursday evening, we see a weak low pressure system to the northeast, with its trailing front and trough, extending southwest into the Kauai Channel…between Kauai and Oahu. The weather map shows the isobars widely spaced around, and well offshore from our islands, ensuring continued light winds through the rest of this week, likely into next week. This leaves us in a stagnant air mass, with uncomfortably muggy conditions prevailing during the heat of the day...even into the nights.
The presence of a low to our northeast, and its associated front/trough extending southward into the Aloha state…will keep our atmosphere locally shower prone. The low pressure areas in the vicinity of the islands will keep the threat of showers in the forecast…some of which will be locally heavy. The greatest chance for the most generous showers will focus on the area around and to the east of the trough. This suggests that from Oahu to the islands of Maui County should have the greatest rainfall…perhaps stretching down over the Big Island during the afternoon hours Friday. Here’s a looping radar image, so we can keep track of where those showers are falling.
The lack of wind, coupled with the high humidity, will bear down on us, making for uncomfortable conditions into the weekend…and perhaps beyond. One of the reasons why it’s felt so humid, is that we’ve had very unusual Kona winds, for this time of year, coming up from the south…bringing deep tropical moisture into our area. As the winds have been so light, there’s been no relief from these moist conditions. This reality will continue until the trade winds return, which won’t likely happen until we move into next week.
We’re in for yet another day of near calm winds Friday, with lots of moisture laden air surrounding us. The presence of the trough of low pressure Oahu and eastward, will keep the threat of showers alive, some of which could be locally heavy at times. It’s difficult to put a positive spin on this reality, what with the muggy weather around now. Our hope for relief continues to be the return of the trade winds, which aren’t expected until next week. As a matter of fact, the computer forecast models are now suggesting that we might have to wait until the middle of next week before they arrive!
Friday afternoon between 3-5pm, the Pacific Disaster Center in Kihei, Maui, is hosting a NWS hurricane workshop…which will be free to the public. You would need to call the PDC at 891-0525 in order to reserve a seat, which are limited to around 87 people. This will be a golden opportunity to ask all the questions you have about hurricanes…directed to experts in the field. The meteorologist in charge of the National Weather Service office in Honolulu, along with one of his top guns, will be available to field your best inquires. I’ll be there too, and would enjoy meeting you during this workshop. The purpose of this meeting is to describe what’s expected in terms of hurricanes this season…which starts June 1st here in the central Pacific. I see that the first tropical cyclone of the season has formed just off the east coast of the United States!
It’s Thursday evening here in Kihei, Maui, as I begin writing this last section of today’s narrative. Cloudy, and then more cloudy skies are covering many areas of the state, as we head into Thursday night. Looking out the window here in Kihei, before I head upcountry to Kula, it’s majorly cloudy, which I’m quite sure, that some of those dark cumulus clouds are dropping showers here and there. Yesterday when I got home, I had to put my serious rain jacket on before taking my evening walk. I’m pretty sure that that will be the case this evening too, as I expect foggy and wet conditions to exist up there. ~~~ I’ve been super busy the last several days, as I’m in charge of running a hurricane exercise, called Makani Pahili (big storm in Hawaiian), for the Pacific Disaster Center…my day job. Meanwhile, I’m also in charge of a large gathering, where the National Weather Service is coming to our office, to have a joint hurricane awareness meeting. I speak of this meeting in one of the paragraphs above. Here’s a link to more information about that meeting Friday afternoon here in Kihei. ~~~ Ok, it’s been a long day, starting at 435am this morning, as I head home at around 530pm. If I see something unusual on the drive home, I’ll come back online and tell you about it. Otherwise, I’ll meet you here again early Friday morning, with your next new weather narrative. I hope you have a great Thursday night until then! Aloha for now…Glenn.
Interesting: Despite the well-known benefits of having a lifestyle that includes physical activity, eating a diet high in fruits and vegetables, maintaining a healthy weight, moderate alcohol use and not smoking, only a small proportion of adults follow this healthy lifestyle pattern, and in fact, the numbers are declining, according to an article published in the June 2009 issue of The American Journal of Medicine.
Lifestyle choices are associated with the risk of cardiovascular disease as well as diabetes. Investigators from the Department of Family Medicine, Medical University of South Carolina, Charleston compared the results of two large-scale studies of the US population in 1988-1994 and in 2001-2006.
In the intervening 18 years, the percentage of adults aged 40-74 years with a body mass index greater than 30 has increased from 28% to 36%; physical activity 12 times a month or more has decreased from 53% to 43%; smoking rates have not changed (26.9% to 26.1%); eating 5 or more fruits and vegetables a day has decreased from 42% to 26%; and moderate alcohol use has increased from 40% to 51%. The number of people adhering to all 5 healthy habits has decreased from 15% to 8%.
Interesting2: Conservationists fear that rapid climate change could see animals and plants "trapped" in homes that become too hot or dry for them, raising the possibility of extinction. But now for the first time experts have been evaluating ways to help species adapt to rapid climate change. They are considering a controversial strategy called "managed relocation"
The project, partly funded by the National Science Foundation (NSF), involves humans stepping in to move species into more accommodating habitats. Managed relocation has been rejected by some scientists who fear the relocated species could overpopulate a new area and cause local organisms to become extinct.
Interesting3: A recent study by Yale University’s School of Forestry and Environmental Studies reports that if humans commit to the restoration effort, most ecosystems can recover from very major disruption within decades to half-centuries. The study was written by Holly P. Jones and Oswald J. Schmitz and will appear in the June edition of the journal PLoS ONE.
According to the study, researchers compiled information from 240 independent studies conducted since 1910 that examined large, human-scale ecosystems recovery following the termination of both human and naturally imposed disruption.
Researchers grouped the data into seven broad aquatic and terrestrial types of ecosystems, and disruptions such as deforestation, hurricane, invasive species, oil spoils, power plant and sea trawling.
Most of the studies measured multiple response variables, which researched grouped into three categories: ecosystem function, animal community, and plant community.
The researchers evaluated the recovery of each of the variables in terms of the time it took for them to return to their original state as determined by each study’s author.
The study also assessed whether recovery times were related to the magnitude of the disturbance. Reportedly, 83 studies demonstrated recovery for all variables; 90 demonstrated a mixture of recovered and non-recovered variables; 67 demonstrated no recovery for any variable; and 15 percent of all the ecosystems in the analysis are beyond recovery.
The average recovery time was 20 years or less, and reportedly did not exceed more than 56 years. It was found that recovery from human disturbances was slower than natural disturbances, such as hurricanes. Recovery following agricultural, logging, and multiple stressors was significantly slower than all of other disturbance types.
The results of the study showed a positive relationship between the degree of disturbance and the recovery time. However, this was entirely determined by the type of ecosystem. For instance, the study states that aquatic system recovered much faster than terrestrial.
Researchers noted that aquatic systems may recover more quickly because species and organisms that inhabit them turn over more rapidly. For instance, forests took the longest to recover due to the fact that forest inhabitants take longer to regenerate after logging or clear-cutting.
One potential pitfall of the study is that the uncertainty of the systems original state. The study explains that major disturbances such mass extinction combined with lower level disturbances such as pollution or climate change could create a baseline far removed from the historical natural state.
Jones and Schmitz concluded that "recovery is possible and can be rapid for many ecosystems, giving much hope for humankind to transition to sustainable management of global ecosystems."
Interesting4: The first tropical depression of the 2009 Atlantic hurricane season formed off the coast of the eastern United States, forecasters said Thursday, but was not expected to threaten land. Tropical Depression One was about 310 miles south of Providence, Rhode Island, and about 635 miles southwest of Halifax, Nova Scotia, on Thursday morning, according to the National Hurricane Center.
The depression, with maximum sustained winds of 35 mph, was moving northeast at near 17 mph — away from the U.S. coastline, forecasters said. Officials believe it will become a tropical storm over the next day or so, but will weaken or dissipate over colder waters by Saturday. The Atlantic hurricane season officially begins Monday and runs through November.
Interesting5: Elephants are used to living in dry conditions in this part of western Africa, but the extreme drought is being blamed for the death of six young elephants. Four adult elephants also died after falling into a well on the intrepid search for water in the region. This is the worst drought the country has seen in 26 years, cattle are also dying this part of the world due to the lack of watering holes.
"Save the Elephants" distributed this photo on Monday to depict and educate on the devastating drought that is affecting Mali. The number of desert elephants is starting to dwindle, the animals now numbering between 300 and 450 are being hailed "The last elephants of Timbuktu."
Each year the elephants are being forced to trek farther to the fringes of the Sahara to find water. Their migration route is the longest of any continent they travel around 435 miles in search of water. The young children of Mali are also affected by the drought.
The World Food Program claims the majority die from malnutrition. The drought combined with soaring temperatures is leading to the death of other cattle in the region, as the locals say there is a stench of rotten cattle lingering in the air. The hope is that the rains will start soon and once again allow the elephants to find water with the cooler conditions. Crops will once again start to improve and the cruel cycle of season starts again for the people of Mali.
Interesting6: The Pacific Ocean, occupying a third of the planet’s area, faces threats that will render some coastal areas uninhabitable. Pollution such as sewage, runoff from land and toxic waste; habitat destruction; over-fishing; and climate change leading to sea level rise, ocean acidification and warming will all interact to damage the ocean’s ecology and coastal economies.
These are among the findings of ‘Pacific Ocean Synthesis’, a report by the US-based Center for Ocean Solutions (COS) that reviewed more than 3,400 scientific articles and reports from 50 countries in the Pacific basin. COS presented the report at the World Ocean Conference in Manado, Indonesia, this month (11—15 May).
The study divided the Pacific Ocean into seven regions, revealing threats and potential solutions for each.Widely applicable solutions include capacity building in ocean management, efforts to adapt to climate change and reduce overfishing, and using information technologies to monitor and share information, says Noah Idechong, a COS researcher from the Pacific Island of Palau. All should be high priority, he adds.
"Synthesizing information gives us a good idea of what is happening [in the Pacific Ocean]. I think one of the most important findings is that so much [research] has been done," he says. The report also summarizes various gaps in research, such as insufficient information about different pollution effects, the need for standardized biodiversity and water quality monitoring and poor information about the socioeconomic effects of sea surface temperature rises.
The capacity to analyze and communicate information, and to make use of monitoring systems to network and share solutions, is one of the gaps that nations should work on, says Idechong. Meg Caldwell, COS executive director, told SciDev.Net the report is an important tool for policymakers.
"This [report] represents a vast information resource about what is occurring in the individual countries," she says. Hundreds of scientists have already signed a consensus statement, ‘Ecosystems and people of the Pacific Ocean — Threats and opportunities for action’. It warns that, left unchecked, the threats could have "devastating consequences for coastal economies, food supplies, public health and political stability".
Posted by Glenn
No Comments
May 27-28, 2009
Air Temperatures – The following maximum temperatures were recorded across the state of Hawaii Wednesday afternoon:
Lihue, Kauai – 82
Honolulu, Oahu – 86
Kaneohe, Oahu – 84
Kahului, Maui – 85
Hilo, Hawaii – 84
Kailua-kona – 85
Air Temperatures ranged between these warmest and coolest spots near sea level – and on the highest mountains…at 4 p.m. Wednesday afternoon:
Honolulu, Oahu – 85F
Lihue, Kauai – 78
Haleakala Crater – 52 (near 10,000 feet on Maui)
Mauna Kea summit – 41 (near 14,000 feet on the Big Island)
Precipitation Totals – The following numbers represent the largest precipitation totals (inches) during the last 24 hours on each of the major islands, as of Wednesday afternoon:
3.56 Anahola, Kauai
0.76 Kalaeloa airport, Oahu
0.50 Molokai
0.02 Lanai
0.31 Kahoolawe
0.43 Waikapu Country Club, Maui
0.19 Keahole airport, Big Island
Marine Winds – Here’s the latest (automatically updated) weather map shows a weak 1006 millibar low pressure system to the north-northeast of Hawaii, with its associated front and trough extending southwest through the Kauai channel between Kauai and Oahu. This pressure configuration will keep light breezes in place, generally from the southeast to southwest…with localized sea breezes through Friday.
Satellite and Radar Images: To view the cloud conditions we have here in Hawaii, please use the following satellite links, starting off with the Infrared Satellite Image of the islands to see all the clouds around the state during the day and night. This next image is one that gives close images of the islands only during the daytime hours, and is referred to as a Close-up visible image. This next image shows a larger view of the Pacific…giving perspective to the wider ranging cloud patterns in the Pacific Ocean. Finally, here’s a looping IR satellite image, making viewable the clouds around the islands 24 hours a day. To help you keep track of where any showers may be around the islands, here’s the latest animated radar image.
Hawaii’s Mountains – Here’s a link to the live webcam on the summit of near 14,000 foot Mauna Kea on the Big Island of Hawaii. The tallest peak on the island of Maui is the Haleakala Crater, which is near 10,000 feet in elevation. These two webcams are available during the daylight hours here in the islands…and when there’s a big moon rising just after sunset for an hour or two! Plus, during the nights and early mornings you will be able to see stars, and the sunrise too…depending upon weather conditions.
Aloha Paragraphs
Palm lined lava coast…Big Island
A muggy and humid weather will remain in place over the islands through most of the rest of this week…if not all of the week. Looking at this weather map we see a weak low pressure system, with its trailing trough of low pressure, dangling down into our island chain Wednesday evening. This strongly suggests that our trade winds, which are often blowing this time of year, will hold off until late this weekend…or even wait to arrive until early next week. As noted above, this leaves us in a stagnant air mass, with uncomfortably sultry conditions prevailing during the heat of the day.
The presence of a low to our north-northeast, and its associated trough extending southward into the Aloha state…will keep our atmosphere locally shower prone. These low pressure areas in the vicinity of the islands will keep the threat of showers in the forecast…some of which will be locally heavy. Kauai received the largest precipitation total during the last 24 hours, which was 3.56" at the Anahola rain gauge. We saw another round of generous showers falling from Kauai to Maui County Wednesday afternoon. Here’s a looping radar image, so you can keep track of where those showers are falling. This long lasting convective pattern will persist, that is until the trade winds manage to work their way back into our island weather picture.
The weather here in the islands the last several days has been very warm and excessively humid…at least in many sea level locations. One of the reasons why, is that we’ve had very unusual Kona winds blowing up from the south, bringing tropical moisture into our area. As the winds have been so light, there’s been no relief from these ultra-tropical conditions. This reality will continue until the trade winds return, which won’t likely happen for another 4-5 days. The fact that the trade winds are on hold through then, which grades into the beginning of June…is uncommon to say the least!
This Friday afternoon between 3-5pm, the Pacific Disaster Center in Kihei, Maui, is hosting a NWS hurricane workshop. You would need to call the PDC at 891-0525 in order to reserve a seat, which are limited to around 87 people. There’s been many calls already, as this will be a golden opportunity to ask all the questions you have about hurricanes…directed to experts in the field. The meteorologist in charge of the National Weather Service office in Honolulu, along with one of his top guns, will be there to field your best inquires. I’ll be there too, and would enjoy meeting you during this workshop. The purpose of this meeting is to describe what’s expected in terms of hurricanes this season…which starts June 1st in the central Pacific.
It’s Wednesday evening here in Kihei, Maui, as I begin writing this last section of today’s narrative. Today was another one of those very muggy days, with our skies filled with not only lots of clouds, some of which were generously showery…but also localized rather thick volcanic haze. Looking out the window here before I leave for home in Kula, it’s very cloudy, and those cumulus clouds look rather wet, although it’s dry here on the south coast, at least in my view. I have a feeling that it will be foggy, and at least somewhat wet upcountry, which I’ll find out as I get out on the road, and have a better look around. Let’s take a look at this satellite image, so we can see where all these clouds are located as we head into Wednesday night. ~~~ I’ll be back again early Thursday morning with your next new weather narrative. I hope you have a great Wednesday night until then, either here in the islands, or somewhere else! Aloha for now…Glenn.
Interesting: A new map shows where desert tortoises could relocate, if displaced by climate change or human development. While the project didn’t turn up many surprises, it is the first real numbers-based tortoise map that is designed to adapt to changing environmental conditions. For now, the map mostly outlines where good tortoise habitats are today. Future modifications, researchers hope, will help them protect the threatened species.
"We can say, ‘OK, what do we think the 100-year climate prediction is going to look like?’" said Kenneth Nussear, a wildlife biologist with the United States Geological Service in Las Vegas. "We can make that change and redo the map and see what the future might look like for tortoises. This is the first step needed to get there. That’s where we want to go."
Interesting2: In the midst of a third consecutive dry year, California’s water supply continues to shrink as the state’s population grows, but according to a new report by the Natural Resources Defense Council, the state’s commercial, industrial and institutional (CII) sector has the tools to save more than enough water to meet the annual needs of Los Angeles, San Francisco and San Diego combined. Some leading California businesses and institutions are already catching on — saving water and money at the same time.
"After three consecutive dry years and global warming threatening to intensify California’s droughts, we need smart-water solutions that that will stop waste and help businesses use only what they need," said Ronnie Cohen, Director of Water Efficiency Policy for the Natural Resources Defense Council.
"Luckily, 21st-century technologies exist to stretch our water supply and save money. And some trailblazing California businesses and water agencies are already showing us how it’s done." In February of 2008, Governor Schwarzenegger called for a 20 percent reduction in per capita water use by 2020, and legislation to help reach that target is currently pending in the State Assembly (AB 49).
California’s CII sector — which includes office buildings, hotels, oil refineries, golf courses, schools and universities, restaurants and manufacturers — is responsible for one-third of urban water use, making progress in this sector essential to reaching this reduction goal.
The CII sector uses the equivalent of more than a million Olympic-sized swimming pools of water annually. NRDC estimates California businesses could save about 25-50 percent of that water with efficiency measures, or as much as 700,000 -1.3 million acre-feet — the equivalent to 350,000-650,000 Olympic-sized swimming pools.
Interesting3: Global scale oceanic circulation modeling has been moving to a new gridding method that projects the faces of a cube onto the surface of a sphere. They found that this method covers the sphere more uniformly than a latitude-longitude grid, and that it produces more accurate results near Earth’s poles.
This is helping refine modeling of ocean currents which are critical to global climate models, and has the potential to significantly improve the accuracy of climate change modeling. Researchers from NASA’s Jet Propulsion Laboratory (JPL), Pasadena, Calif. and Massachusetts Institute of Technology (MIT), Cambridge, Mass. are reaping huge benefits from research performed on NASA’s advanced supercomputers.
Scientists believe the ocean and its interactions with the atmosphere are key to studying climate change. To better understand these interactions, they identified three important areas in climate research. They look at the ‘states’ of the ocean and sea-ice, which includes their temperature, salinity, current speeds, and sea-surface elevation, and study their changes at and below the surface.
They also look at the ‘state’ of the atmosphere, which includes its temperature, humidity, and wind patterns, and study how it was affected by the changes in the ocean. These interactions between the atmosphere and ocean directly affect the weather. The scientists study the biological activity in the ocean and its responses to the changing ‘state’ of the ocean. These are important variables in the models, and require the most detailed treatment to be most accurately addressed.
Interesting4: Unlike trash disposal, carbon dioxide cannot be dumped in a landfill, shipped away or burned. But some Pennsylvania lawmakers hope to find another place for the greenhouse gas that scientists implicate as the main cause of global warming.
They’re looking to bury it. Carbon capture and sequestration would take a stream of compressed carbon dioxide directly from electric utilities and pump it underground into depleted oil fields, shale formations and aquifers thousands of feet below ground.
There, proponents hope, the gas will be permanently stored. Pennsylvania’s geology could store at least 100 years worth of the state’s annual carbon dioxide emissions, according to a report released earlier this month by the Department of Conservation and Natural Resources.
Such an amount would be significant: Pennsylvania emits 1 percent of the world’s annual carbon dioxide emissions. Pumping millions of pounds of pressurized gas more than 2,500 feet below ground is not easy.
Interesting5: It may seem like a stretch to call Jack Bernat, who spends his off-duty hours collecting and lovingly restoring muscle cars of the 1980s, an environmentalist. But then trace back a working life spent chasing after the vanishing jobs in Pennsylvania’s steel industry. In his 35 years in the workforce, Bernat endured lay-offs and shut-downs, scrambled for part-time and temporary work, and took jobs far from home.
Now the former steelworker is hoping he has at last found a job with a future, putting the finishing touches to the giant fiberglass blades for wind turbines produced by the Spanish firm, Gamesa.
"My biggest concern is not to have happening to this generation what happened to mine — where you end up 10 years here, 10 years there, and then you are like me 54 years old, and five different careers and no seniority anywhere," said Bernat, who heads the chapter of the United Steelworkers of America union at the wind turbine plant.
"I want to see the longevity of this thing." Those hopes provide a powerful impetus for an alliance between the environmental and labor movements that could prove critical to the course of Barack Obama’s hopes to transform America’s energy economy.
Interesting6: Geothermal energy has always been thought of as a clean, renewable form of power, but since the Hellisheidi geothermal power plant began operation about 30 km from central Reykjavik in 2006, various problems have come to light. Not long after the station started producing electricity, Reykjavik residents became aware that they had to clean silverware every three to four days instead of three to four months because it was always covered with black soot.
Truck drivers who drove daily to sand mines in the western part of Hellisheidi found that the rubber in the suspension and steering systems of their vehicles became hard and prone to breakage after only a year, whereas normally it would take three to five years for this to happen.
People suspected that the Hellisheidi plant was responsible for the damage, but at first this was never discussed openly. Then in September 2008, people saw that the moss vegetation adjacent to the Hellisheidi plant was severely damaged.
The company Reykjavik Energy immediately arranged for research to be carried out on the moss damage, together with research at two other geothermal plants, Nesjavellir and Svartsengi, and a control site.
Interesting7: Drip, drip, drip come the studies one after another, reinforcing the threat to the Northeast from rising sea levels along the U.S. and Canadian east coast. If Greenland’s ice melts at moderate to high rates, ocean circulation by 2100 could shift and cause sea levels off the Northeast coast of North America to rise by about 12 to 20 inches more than other coastal areas, researchers report Wednesday in Geophysical Research Letters. "Major northeastern cities are directly in the path of the greatest rise," researcher Aixue Hu of the National Center for Atmospheric Research said.
The report comes on the heels of two other studies with similar warnings.
• Just over a week ago scientists at Britain’s University of Bristol reported that while collapse of the West Antarctic Ice Sheet would not raise global sea levels as much as had previously been feared, the maximum increase is expected along the East and West Coasts of the USA.
• And in March, researchers at the University of Maryland warned that, however much the oceans rise by the end of the century, add an extra eight inches or so for New York, Boston and other spots along the coast from the mid-Atlantic to New England because of predicted changes in ocean currents.
The Intergovernmental Panel on Climate Change in 2007 projected that sea levels worldwide could rise by an average of seven to 23 inches this century. "The oceans will not rise uniformly as the world warms," NCAR scientist Gerald Meehl, a co-author of the new paper, said in a statement.
"Ocean dynamics will push water in certain directions, so some locations will experience sea level rise that is larger than the global average." In recent years, the melting of the Greenland ice cap has been increasing at a rate of about 7% per year.
The researchers calculated the sea level impact if that were to continue and also if the increase declined to 3% or 1% annually. At the middle or 3% rate, the Northeast would see an extra foot of sea level rise because of ocean circulation changes, in addition to the global sea level increase, they reported.
A drop to 1% would mean eight additional inches of water in the Northeast, and a continued 7% increase would result in an extra 20 inches, the new study said. The research was supported by the U.S. Department of Energy, National Science Foundation and NASA.
Posted by Glenn
[2] Comments
May 26-27, 2009
Air Temperatures – The following maximum temperatures were recorded across the state of Hawaii Tuesday afternoon:
Lihue, Kauai – 82
Honolulu, Oahu – 86
Kaneohe, Oahu – 83
Kahului, Maui – 89
Hilo, Hawaii – 81
Kailua-kona – 85
Air Temperatures ranged between these warmest and coolest spots near sea level – and on the highest mountains…at 4 p.m. Tuesday afternoon:
Kapalua, Maui – 86F
Kaneohe, Oahu – 77
Haleakala Crater – 50 (near 10,000 feet on Maui)
Mauna Kea summit – 41 (near 14,000 feet on the Big Island)
Precipitation Totals – The following numbers represent the largest precipitation totals (inches) during the last 24 hours on each of the major islands, as of Tuesday afternoon:
0.72 Anahola, Kauai
0.82 Punaluu Pump, Oahu
0.02 Molokai
0.00 Lanai
0.18 Kahoolawe
0.19 Ulupalakua, Maui
2.10 Pahoa, Big Island
Marine Environment – Here’s the latest (automatically updated) weather map shows a 1011 millibar low pressure system to the north of Hawaii, with its associated trough extending southward into the islands. This pressure configuration will keep light breezes in place, generally from the southeast to southwest…with localized sea breezes through Thursday.
Satellite and Radar Images: To view the cloud conditions we have here in Hawaii, please use the following satellite links, starting off with the Infrared Satellite Image of the islands to see all the clouds around the state during the day and night. This next image is one that gives close images of the islands only during the daytime hours, and is referred to as a Close-up visible image. This next image shows a larger view of the Pacific…giving perspective to the wider ranging cloud patterns in the Pacific Ocean. Finally, here’s a looping IR satellite image, making viewable the clouds around the islands 24 hours a day. To help you keep track of where any showers may be around the islands, here’s the latest animated radar image.
Hawaii’s Mountains – Here’s a link to the live webcam on the summit of near 14,000 foot Mauna Kea on the Big Island of Hawaii. The tallest peak on the island of Maui is the Haleakala Crater, which is near 10,000 feet in elevation. These two webcams are available during the daylight hours here in the islands…and when there’s a big moon rising just after sunset for an hour or two! Plus, during the nights and early mornings you will be able to see stars, and the sunrise too…depending upon weather conditions.
Aloha Paragraphs

La Perouse Bay…on Maui
The much lighter than normal breezes remain in place Tuesday evening, although there is hope that the missing trade winds will return by this weekend. Looking at this weather map we see a trough of low pressure just to the north of Kauai and Oahu. At the same time, we have a high pressure system far to the northeast, with its associated ridge just to the east of the Big Island. This is a good sign, although we may have to wait until the end of the week, before we see signs of the trade winds return. There remains quite a bit of haze across some parts of the Aloha state, which will stick around until the trade winds finally blow it all away.
The light wind conditions, associated with this convective weather pattern, will bring clear mornings and locally cloudy afternoons…with localized upcountry showers. The low pressure areas in the vicinity of the islands will keep the threat of random showers around into Thursday. This long lasting convective pattern will persist, that is until the trade winds manage to work their way back into our island weather picture. The latest outlook suggests that it will be another couple of days at least, that we have to endure this stagnant air mass over our islands. As the trade winds finally return, the emphasis for showers will shift back over to the north and east facing windward coasts and slopes.
The weather here in the islands the last several days has been very warm and excessively humid…at least in many sea level locations. One of the reasons why is that we’ve had very unusual south Kona winds blowing, bringing up tropical moisture into our area. As the winds have been so light, there’s been no relief from these ultra-tropical conditions. This reality will continue until the trade winds return, which may not happen until we reach the weekend. The fact that the trade winds are on hold through at least this weekend, which is at the very tail-end of the month of March…is uncommon. We’ve had more light wind days this spring than we’ve seen in many years. As has been mentioned here before, the trade winds typically blow about 86% of the time during the month of May, which certainly hasn’t been the case thus far. This late in the spring season, we’re bordering on this lack of trade wind days, almost qualifying as a true rarity. Certainly by the time we get into June, a month that usually has the trade winds blowing 91% of the days, it would be very rare not to see the trade winds taking over almost exclusively.
It’s Tuesday evening here in Kihei, Maui, as I begin writing this last section of today’s narrative. It was a very sultry day here in Kihei, as I know it was in many of the lowland areas around the state. Showers were most generous over the islands of Kauai and Oahu Tuesday, which became locally heavy at times. Using this looping radar image, we can see a few showers around the Big Island and Maui, but most were happening in the vicinity of Kauai and Oahu. One of the main things that we can see, checking out that radar image, is that our winds are still coming up from the south to southeast. These Kona winds are bringing uncomfortably hot and humid conditions to our islands! ~~~ I’m heading out to my car now, to take the drive back home to Kula. Looking out the window here in Kihei before leaving, I see hazy skies, and partly to mostly cloudy skies. If I run through any heavy showers between here and when I get into the upcountry area, I will come back online and let you know. Update: I ran though some light showers coming up through the pasture lands between Pukalani and Kula, but nothing heavy by any means. What I have found here in Kula however, is pea soup fog, perhaps e even double thick fog, along with unusually warm temperatures for this elevation. At 645pm, my outside thermometer is reading 70.7F degrees, which is very warm for this time of the evening. These very unusual Kona breezes are bringing really warm air into our state. The high temperature of 89F degrees today in Kahului, Maui must have felt almost unbearable! ~~~ I’ll be back again early Wednesday morning with your next new weather narrative. I hope you have a great Tuesday night until then! Aloha for now…Glenn.
Interesting: The death toll is rising in Bangladesh after Tropical Cyclone Aila hit the region on Monday. Reports out of the region suggest that at least 87 people have now been confirmed dead with more than 800 people injured. An estimated 110,000 people have been evacuated or displaced from their homes in the Indian state of West Bengal.
Flooding rain is causing chaos in the attempt to get people to safety, the Navy Coast Guard is struggling to get to may areas as they are still dealing with extremely rough seas, so the full extent of the death and destruction is yet unknown.
It is impossible to move form Chittagong to the offshore islands where many villagers remain stranded. The tidal surge battered river and flood control embankments and dykes and submerged many villages. Khulna, Satkhira, Patuakhali and Barisal were amongst the many that were badly affected by the storm.
River transport from Dhaka to all 39 routes into southern districts remain suspended. Many are taking shelter in schools and medical centres and colleges in the hope they are returning home soon. The Indian Army and police were rushed in to help the coastal North and South Parganas district which was thought to be worst hit by the cyclone.
This region is home to the world’s largest mangrove forests, which straddle West Bengal and Bangladesh. It’s largely inhabited by fishing communities and the endangered royal Bengal tiger.
Low-lying areas such as Cuttack were also hit hard as around 400 thatched huts were damaged and some completely destroyed. As of Tuesday, the former tropical cyclone broke up and dissipated well inland near the border of India and northern Bangladesh.
Its leftover moisture, however, was triggering heavy rain along the eastern Himalaya of Bhutan, India, easternmost Nepal and a few spots in southernmost Tibet. Highest rainfall of 8-12 inches swelled rivers flowing southward into lowlands of northeastern India.
Interesting2: While most of the planet has been warming for decades, part of Antartica, the East Antarctic Ice Sheet — has actually been getting colder. At least that was the general consensus. A major study by Pennsylvania State University; NASA’s Goddard Space Flight Center in Greenbelt, Md.; and NASA’s Goddard Institute for Space Studies in New York City shows this may not be the case at all.
The work was supported by grants from the National Science Foundation. The West Antarctic Ice Sheet, with an average elevation of about 6,000 feet above sea level, is substantially lower than East Antarctica, which has an average elevation of more than 10,000 feet.
While the entire continent is essentially a desert, West Antarctica is subject to relatively warm, moist storms and receives much greater snowfall than East Antarctica. The researchers devised a statistical technique that uses data from satellites and from Antarctic weather stations to make a new estimate of temperature trends.
"People were calculating with their heads instead of actually doing the math," Steig said. "What we did is interpolate carefully instead of just using the back of an envelope. While other interpolations had been done previously, no one had really taken advantage of the satellite data, which provide crucial information about spatial patterns of temperature change."
The study found that warming in West Antarctica exceeded one-tenth of a degree Celsius per decade for the last 50 years and more than offset the cooling in East Antarctica. The illustration depicts the warming that scientists have determined has occurred in West Antarctica during the last 50 years, with the dark red showing the area that has warmed the most.
Interesting3: With rising seas lapping at coastal cities and threatening to engulf entire islands in the not-too-distant future, it’s easy to assume our only option will be to abandon them and head for the hills. There may be another way, however. Archaeological sites in the Caribbean, dating back to 5000 BC, show that some ancient civilizations had it just as bad as anything we are expecting.
Yet not only did they survive a changing coastline and more storm surges and hurricanes: they stayed put and successfully adapted to the changing world. Now archaeologists are working out how they managed it and finding ways that we might learn from their example.
The sea-level rise that our ancestors dealt with had nothing to do with human-induced climate change, of course: it was a hangover from the last ice age. As the massive ice sheet that lay on North America melted, the continent was buoyed upwards.
As a result, the northern Caribbean, on the other end of the same tectonic plate, sank, making seas in the region rise up to 5 meters over 5000 years. Although the cause of this rise was very different to what we face today, the effects were probably the same.
Rising waters not only nibble away at coastlines, they also mean that hurricanes and storm surges reach further inland. Higher seas also mean that groundwater becomes contaminated with salt, and as the water table rises the waterlogged land becomes more likely to flood.
Posted by Glenn
[2] Comments
May 25-26, 2009
Air Temperatures – The following maximum temperatures were recorded across the state of Hawaii Monday afternoon:
Lihue, Kauai – 81
Honolulu, Oahu – 79
Kaneohe, Oahu – 81
Kahului, Maui – 85
Hilo, Hawaii – 85
Kailua-kona – 86
Air Temperatures ranged between these warmest and coolest spots near sea level – and on the highest mountains…at 4 p.m. Monday afternoon:
Barking Sands, Kauai– 84F
Princeville, Kauai – 77
Haleakala Crater – 50 (near 10,000 feet on Maui)
Mauna Kea summit – 39 (near 14,000 feet on the Big Island)
Precipitation Totals – The following numbers represent the largest precipitation totals (inches) during the last 24 hours on each of the major islands, as of Monday afternoon:
0.58 Kapahi, Kauai
1.05 South Fork Kaukonahua, Oahu
0.24 Molokai
0.01 Lanai
0.02 Kahoolawe
0.15 Oheo Gulch, Maui
0.15 Kapapala Ranch, Big Island
Marine Environment – Here’s the latest (automatically updated) weather map shows a low pressure trough located to the west of the island of Kauai, with a ridge of high pressure positioned to the east of the Big Island. This pressure configuration will keep light breezes in place, generally from the southeast to southwest…with localized sea breezes through Wednesday.
Satellite and Radar Images: To view the cloud conditions we have here in Hawaii, please use the following satellite links, starting off with the Infrared Satellite Image of the islands to see all the clouds around the state during the day and night. This next image is one that gives close images of the islands only during the daytime hours, and is referred to as a Close-up visible image. This next image shows a larger view of the Pacific…giving perspective to the wider ranging cloud patterns in the Pacific Ocean. Finally, here’s a looping IR satellite image, making viewable the clouds around the islands 24 hours a day. To help you keep track of where any showers may be around the islands, here’s the latest animated radar image.
Hawaii’s Mountains – Here’s a link to the live webcam on the summit of near 14,000 foot Mauna Kea on the Big Island of Hawaii. The tallest peak on the island of Maui is the Haleakala Crater, which is near 10,000 feet in elevation. These two webcams are available during the daylight hours here in the islands…and when there’s a big moon rising just after sunset for an hour or two! Plus, during the nights and early mornings you will be able to see stars, and the sunrise too…depending upon weather conditions.
Aloha Paragraphs

The steep sea cliffs…on Molokai
Light winds, generally from the southeast, are keeping our atmosphere muggy…with volcanic haze over many areas of the island chain Monday evening. Looking at this weather map we see a trough of low pressure drawn over the area just west of Kauai. This long lasting trough is keeping our normal trade winds to the south and east of our islands. It will take the departure of the trough, and the return of a ridge of high pressure to our north, to bring the atmospheric clearing trade winds back…during the second half of this week.
At the upper levels of the atmosphere to our northeast, we have a weakening, and departing upper level low pressure system. This low aloft, as it moves away, is losing some of its influence over us. The instability that we had over the last several days is moving away with the low. The most likely chance for showers, as a trough continues to block our trade wiinds, keeping us in a convective weather pattern…will be during the afternoon hours, in the upcountry areas.
It’s Monday evening here in Kula, Maui, as I begin writing this last section of today’s narrative. Looking out the window of my weather tower it’s partly cloudy, although the fairly thick volcanic haze is still evident. As expected, the clear skies of this morning, gave way to increased clouds during the afternoon locally. Here in Kula, there were a couple of minor light showers. Speaking of showers, we can check out this looping radar image, which is showing some minor precipitation over the ocean to the southeast of the Big Island, as well as a few in the Kauai Channel, at the time of this writing. ~~~ It’s the Memorial Day holiday today, a day to remember all of the fallen men and women, who lost their lives in the call of military duty. I was drafted into the army way back when for two years myself, so I can honestly say that I’m very lucky to still be writing these weather words today! My heart goes out to all those soldiers, and their families, who have experienced this loss. ~~~ I was fortunate enough to be able to stay home all day Monday, doing a mix of domestic duties, and lounging around reading. The haze is rather thick as we move towards sunset, as I mentioned above, but at least the clouds seem to be clearing a bit. Just a little while later, it started to rain quite heavily…at least briefly. I’m going to go down and make a pasta sauce now, and then bring a half glass of red wine back up on my deck, for the sunset viewing. I hope you have a great Monday night, and that you will have a chance to check back in on Tuesday, when I’ll have your next new weather narrative prepared for you early in the morning. Aloha for now…Glenn.
Posted by Glenn
No Comments
May 24-25, 2009
Air Temperatures – The following maximum temperatures were recorded across the state of Hawaii Sunday afternoon:
Lihue, Kauai – 82
Honolulu, Oahu – 81
Kaneohe, Oahu – 80
Kahului, Maui – 86
Hilo, Hawaii – 84
Kailua-kona – 86
Air Temperatures ranged between these warmest and coolest spots near sea level – and on the highest mountains…at 5 p.m. Sunday evening:
Port Allen, Kauai – 84F
Princeville, Kauai – 72
Haleakala Crater – missing (near 10,000 feet on Maui)
Mauna Kea summit -missing (near 14,000 feet on the Big Island)
Precipitation Totals – The following numbers represent the largest precipitation totals (inches) during the last 24 hours on each of the major islands, as of Sunday afternoon:
0.12 Princeville airport, Kauai
0.20 Schofield Barracks, Oahu
0.00 Molokai
0.32 Lanai
1.02 Kahoolawe
0.09 Puu Kukui, Maui
0.23 Kahuku Ranch, Big Island
Marine Environment – Here’s the latest (automatically updated) weather map shows a low pressure system to the north of Kauai. This low pressure cell has a trough extending south over the islands. This pressure configuration will keep light breezes in place, generally from the southwest to southeast…with localized sea breezes into Tuesday.
Satellite and Radar Images: To view the cloud conditions we have here in Hawaii, please use the following satellite links, starting off with the Infrared Satellite Image of the islands to see all the clouds around the state during the day and night. This next image is one that gives close images of the islands only during the daytime hours, and is referred to as a Close-up visible image. This next image shows a larger view of the Pacific…giving perspective to the wider ranging cloud patterns in the Pacific Ocean. Finally, here’s a looping IR satellite image, making viewable the clouds around the islands 24 hours a day. To help you keep track of where any showers may be around the islands, here’s the latest animated radar image.
Hawaii’s Mountains – Here’s a link to the live webcam on the summit of near 14,000 foot Mauna Kea on the Big Island of Hawaii. The tallest peak on the island of Maui is the Haleakala Crater, which is near 10,000 feet in elevation. These two webcams are available during the daylight hours here in the islands…and when there’s a big moon rising just after sunset for an hour or two! Plus, during the nights and early mornings you will be able to see stars, and the sunrise too…depending upon weather conditions.
Aloha Paragraphs

The gorgeous Hawaiian Islands
Light winds varying between southwest and southeast, are keeping our atmosphere muggy…and have brought volcanic haze to some parts of the island chain Sunday evening. Looking at the weather map in the next sentence, we see the same low pressure system to the north of Kauai. Here’s that weather map to view this low, which is keeping our normal trade winds well to the south and east. Those areas that have south and southeast breezes blowing, have thick volcanic haze now, which will stick around for at least another couple of days. It will take the departure of the long lasting low to our north…to bring the atmospheric clearing trade winds back during the second half of the new week.
At the upper levels of the atmosphere Sunday evening, we have a low pressure system, with a surface low pressure system below it. These low pressure systems are adding some instability to our air mass. This means that whatever clouds that around, will be more than normally shower prone. The most likely chance for showers, will be during the afternoon hours, in the upcountry areas on each of the islands. These showers aren’t expected to be widespread, although a few will be rather generous…especially during the afternoons through Monday.
This upper level low is spinning in a counterclockwise fashion to the north of the western islands of Kauai and Oahu. If you look into the area north of Hawaii, using this link…you’ll be able to spot this low pressure cell. You can look for those bright white clouds, which include some thunderstorms to the north and northeast of the islands. Besides its ability to trigger more showers over the next couple of days, this late season low continues to help block our trade winds.
It’s Sunday evening here in Kula, Maui, as I begin writing this last section of today’s narrative. Looking out the window of my weather tower, it’s getting darker and darker again just before sunset…which could easily bring our next round of showers. Besides all the dark clouds, there’s a thick volcanic haze out there too. We’ve seen generally light off and on showers during the afternoon, but not as much precipitation as we saw on Saturday. It appears that Oahu got the lion’s share of the afternoon showers Sunday. Speaking of showers, we can check out this looping radar image, which is showing rain falling generally over the ocean to the northeast of Oahu, as well as in the Kauai Channel, at the time of this writing. ~~~ I’ll be back again Monday morning, which is of course a holiday, meaning that I have the day off from work in Kihei. I hope you have a great Sunday night until then! Aloha for now…Glenn.
Interesting: Wings which redirect air to waggle sideways could cut airline fuel bills by 20% according to research funded by the Engineering and Physical Sciences Research Council (EPSRC) and Airbus. The new approach, which promises to dramatically reduce mid-flight drag, uses tiny air powered jets which redirect the air, making it flow sideways back and forth over the wing.
The jets work by the Helmholtz resonance principle – when air is forced into a cavity the pressure increases, which forces air out and sucks it back in again, causing an oscillation – the same phenomenon that happen when blowing over a bottle. Dr Duncan Lockerby, from the University of Warwick, who is leading the project, said: “This has come as a bit of a surprise to all of us in the aerodynamics community.
It was discovered, essentially, by waggling a piece of wing from side to side in a wind tunnel.” “The truth is we’re not exactly sure why this technology reduces drag but with the pressure of climate change we can’t afford to wait around to find out. So we are pushing ahead with prototypes and have a separate three year project to look more carefully at the physics behind it.”
Interesting2: After thoroughly investigating Victoria Crater on Mars for two years, the instruments aboard the Rover Opportunity reveal more evidence of our neighboring red planet’s windy, wet and wild past. Opportunity’s two-year exploration of Victoria Crater – a half-mile wide and 250 feet deep – yielded a treasury of information about the planet’s geologic history and supported previous findings indicating that water once flowed on the planet’s surface, according to Steve Squyres, Cornell professor of astronomy and the principal investigator for NASA’s Mars Exploration Rover mission.
The rover is now heading south toward Endeavor crater, 8.5 miles away. Many of those observations – of hematite spheres ("blueberries"), sulfate-rich sandstone and small chunks of rock containing kamacite, troilite and other minerals commonly found in meteorites – are consistent with Opportunity’s findings across Meridiani Planum.
"It shows that the processes that we investigated in detail for the first time at Endurance crater [where Opportunity spent six months in 2004] are regional in scale, [indicating that] the kinds of conclusions that we first reached at Endurance apply perhaps across Meridiani," said Squyres. Still, there are a few key differences.
The rim of Victoria Crater is about 30m higher than the rim of Endurance, said Squyres; and as the rover drove south toward Victoria the hematite blueberries in the soil became ever fewer and smaller. Rocks deep inside the crater, however, contained big blueberries – indicating that the rocks higher up had less interaction with water – and thus the water’s source was likely underground.
The overview of the findings is published in the latest issue of the journal Science (May 22, 2009). Detailed analysis of the Victoria data will occupy researchers for years to come, said Jim Bell, professor of astronomy and leader of the mission’s Pancam color camera team.
Interesting3: Eating fish – long considered ‘brain food’ – may really be good for the old grey matter, as is a healthy dose of sunshine, new research suggests. University of Manchester scientists in collaboration with colleagues from other European centers have shown that higher levels of vitamin D – primarily synthesized in the skin following sun exposure but also found in certain foods such as oily fish – are associated with improved cognitive function in middle-aged and older men.
The study, published in the Journal of Neurology, Neurosurgery and Psychiatry, compared the cognitive performance of more than 3,000 men aged 40 to 79 years at eight test centers across Europe. The researchers found that men with higher levels of vitamin D performed consistently better in a simple and sensitive neuropsychological test that assesses an individual’s attention and speed of information processing.
“Previous studies exploring the relationship between vitamin D and cognitive performance in adults have produced inconsistent findings but we observed a significant, independent association between a slower information processing speed and lower levels of vitamin D,” said lead author Dr David Lee, in Manchester’s School of Translational Medicine.
“The main strengths of our study are that it is based on a large population sample and took into account potential interfering factors, such as depression, season and levels of physical activity.
“Interestingly, the association between increased vitamin D and faster information processing was more significant in men aged over 60 years, although the biological reasons for this remain unclear.”
“The positive effects vitamin D appears to have on the brain need to be explored further but certainly raise questions about its potential benefit for minimizing ageing-related declines in cognitive performance.”
Interesting4: A new study from Harvard School of Public Health (HSPH) researchers found that participants who drank for a week from polycarbonate bottles — the popular, hard-plastic drinking bottles and baby bottles — showed a two-thirds increase in their urine of the chemical bisphenol A (BPA). Exposure to BPA, used in the manufacture of polycarbonate and other plastics, has been shown to interfere with reproductive development in animals and has been linked with cardiovascular disease and diabetes in humans.
The study is the first to show that drinking from polycarbonate bottles increased the level of urinary BPA, and thus suggests that drinking containers made with BPA release the chemical into the liquid that people drink in sufficient amounts to increase the level of BPA excreted in human urine.
In addition to polycarbonate bottles, which are refillable and a popular container among students, campers and others and are also used as baby bottles, BPA is also found in dentistry composites and sealants and in the lining of aluminum food and beverage cans. (In bottles, polycarbonate can be identified by the recycling number 7.)
Numerous studies have shown that it acts as an endocrine-disruptor in animals, including early onset of sexual maturation, altered development and tissue organization of the mammary gland and decreased sperm production in offspring. It may be most harmful in the stages of early development. "We found that drinking cold liquids from polycarbonate bottles for just one week increased urinary BPA levels by more than two-thirds.
If you heat those bottles, as is the case with baby bottles, we would expect the levels to be considerably higher. This would be of concern since infants may be particularly susceptible to BPA’s endocrine-disrupting potential," said Karin B. Michels, associate professor of epidemiology at HSPH and Harvard Medical School and senior author of the study.
Interesting5: A new article in the journal Risk Analysis assessed various ways in which aerosol transmission of the flu, a central mode of diffusion which involves breathing droplets in the air, can be reduced. Results show that face protection is a key infection control measure for influenza and can thus affect how people should try to protect themselves from the swine flu.
Lawrence M. Wein, Ph.D., and Michael P. Atkinson of Stanford University constructed a mathematical model of aerosol transmission of the flu to explore infection control measures in the home.
Their model predicted that the use of face protection including N95 respirators (these fit tight around the face and are often worn by construction workers) and surgical masks (these fit looser around the face and are often worn by dental hygienists) are effective in preventing the flu. The filters in surgical masks keep out 98 percent of the virus.
Also, only 30 percent of the benefits of the respirators and masks are achieved if they are used only after an infected person develops symptoms. "Our research aids in the understanding of the efficacy of infection control measures for influenza, and provides a framework about the routes of transmission," the authors conclude. This timely article has the potential to impact current efforts and recommendations to control the so-called swine flu by international, national and local governments in perspective.
Interesting6: It’s been popular in New York and other places where open space is at a premium, so San Francisco figured, "eh, why not?" The first reclamation of street space to create a pedestrian plaza opened last week on San Francisco’s famous Castro Street at the intersection with 17th St. It’s a small space, maybe 1000 square feet in sum, but it’s symbolic, and perhaps a hopeful sign for pavement reclamation enthusiasts everywhere.
The idea is to close a section of street to vehicular traffic, so that citizens can have a place to eat, drink coffee, read the paper, and generally hang out outside. As part of San Francisco’s Pavement to Parks Program, it is the first of what some hope will be many pieces of paved street that are repositioned as business centers. If successful, the 17th and Castro plaza will be made permanent, and likely many others will follow in the city and perhaps in other cities.
It makes the city more walkable and pedestrian friendly, and marks a stark contrast to the never-ending paving of America that began in earnest in the 1950’s and continues to do this day in most parts of the country. And it’s one of the big reasons why people love cities like San Francisco and New York and are increasingly returning to them as the illusions of suburbia burst like gnats on a windshield.
Interesting7: With all the potential good wind power could do for the carbon economy, one of the objections hindering its implementation is aesthetic; people simply don’t want massive turbines dotting the landscape and marring their views. The Dutch founder of London’s Solar Botanic Ltd. was wrestling with that very issue in 2002 when the idea began to blossom: why not redesign the technology to blend into the natural world?
Founded last year, Solar Botanic’s ambitious goal involves layering existing technologies three-fold into the natural form of a leaf and producing fake power-producing trees that individually could power an entire home.
Each "nanoleaf" would incorporate photovoltaics for collecting solar power, thermoelectrics for converting the sun’s heat to electricity, and piezoelectric nanogenerators in the leaves’ petioles (the stalk connecting the leaf to the branch) that capture the kinetic energy from the wind rustling the leaves.
Solar Botanic estimates that a single tree with a canopy 20 feet in diameter could power an average home, producing about 120,000 kilowatt-hours over two decades. Forests, on the other hand, could power entire population centers.
But a more reasonable deployment scenario involves greening up parking lots while providing power to charge electric vehicles or planting the "trees" along highways to capture the turbulence of passing traffic.
Interesting8: After tickling the tongue, artificial sweeteners pass through our bodies and end up in wastewater virtually unchanged. Some sweeteners are particularly widespread in the environment, according to a new study, making them ideal markers for following pollution from treatment plants and other sources into the environment.
"Groundwater can be polluted by several sources, and it’s sometimes not clear where that pollution comes from," said Ignaz Buerge, an environmental chemist at the Swiss Federal Research Station in Schloss. "We now have a marker of domestic wastewater which can be used in tracing pollution." Contaminated groundwater is both an environmental and public health issue.
Once run-off gets into the environment, though, it can be hard to know whether it came from industry, agricultural fields, traffic, homes or other sources. Scientists have been looking for marker molecules that might help them track down and possibly reduce some of these inputs.
Interesting9: Globally, 85 per cent of reefs have been lost. Destructive fishing practices, disease and coastal development threaten many of the survivors. What sounds like an apocalyptic vision of the future for the world’s tropical corals is in fact a chilling assessment of the current state of reefs built in cooler waters by oysters and other bivalve shellfish. According to a report from
The Nature Conservancy (TNC), released this week at the International Marine Conservation Congress in Washington DC, shellfish reefs are the world’s most imperiled marine habitats – faring worse than coral reefs and mangrove forests.
TNC’s team scoured the literature, surveyed scientists and analyzed fisheries statistics to assess the health of reefs in 144 bays and estuaries in 44 "eco-regions" across the globe.
In most bays, shellfish reefs are down to around 10 per cent of their historical abundance. In many former strongholds – such as in North America, Europe and Australia – they are all but extinct.
Reasons for the decline vary, but include overfishing, introduction of exotic species, and disturbance from human activities. In Europe, Pacific oysters introduced for aquaculture are now moving from southern latitudes into the North Sea, where they are outcompeting native mussels – with knock-on effects for other wildlife.
In the Gulf of Mexico off the south-eastern US, meanwhile, the water demands of Atlanta and other cities mean river flows are down, making estuaries more salty and allowing invading marine predators to feast on native oysters. The good news is that oyster reefs can bounce back, if managed with care.
Posted by Glenn
No Comments
May 23-24, 2009
Air Temperatures – The following maximum temperatures were recorded across the state of Hawaii Saturday afternoon:
Lihue, Kauai – 80
Honolulu, Oahu – 83
Kaneohe, Oahu – 81
Kahului, Maui – 84
Hilo, Hawaii – 77
Kailua-kona – 85
Air Temperatures ranged between these warmest and coolest spots near sea level – and on the highest mountains…at 5 p.m. Saturday evening:
Kapalua, Maui – 82F
Princeville, Kauai – 77
Haleakala Crater – missing (near 10,000 feet on Maui)
Mauna Kea summit -missing (near 14,000 feet on the Big Island)
Precipitation Totals – The following numbers represent the largest precipitation totals (inches) during the last 24 hours on each of the major islands, as of Saturday afternoon:
0.29 Moloaa Dairy, Kauai
0.02 Waimanalo, Oahu
0.00 Molokai
0.00 Lanai
0.00 Kahoolawe
0.02 Kaupo Gap, Maui
0.37 Pahoa, Big Island
Marine Environment – Here’s the latest (automatically updated) weather map shows a low pressure system to the north of the state. This map also shows a high pressure system far to the northwest, with another cell far to the northeast. The low is located in an area, which is acting like a blocking force…not allowing the normal trade winds to blow across our tropical latitudes. Winds will be light generally southwest to southeast Saturday and Sunday.
Satellite and Radar Images: To view the cloud conditions we have here in Hawaii, please use the following satellite links, starting off with the Infrared Satellite Image of the islands to see all the clouds around the state during the day and night. This next image is one that gives close images of the islands only during the daytime hours, and is referred to as a Close-up visible image. This next image shows a larger view of the Pacific…giving perspective to the wider ranging cloud patterns in the Pacific Ocean. Finally, here’s a looping IR satellite image, making viewable the clouds around the islands 24 hours a day. To help you keep track of where any showers may be around the islands, here’s the latest animated radar image.
Hawaii’s Mountains – Here’s a link to the live webcam on the summit of near 14,000 foot Mauna Kea on the Big Island of Hawaii. The tallest peak on the island of Maui is the Haleakala Crater, which is near 10,000 feet in elevation. These two webcams are available during the daylight hours here in the islands…and when there’s a big moon rising just after sunset for an hour or two! Plus, during the nights and early mornings you will be able to see stars, and the sunrise too…depending upon weather conditions.
Aloha Paragraphs
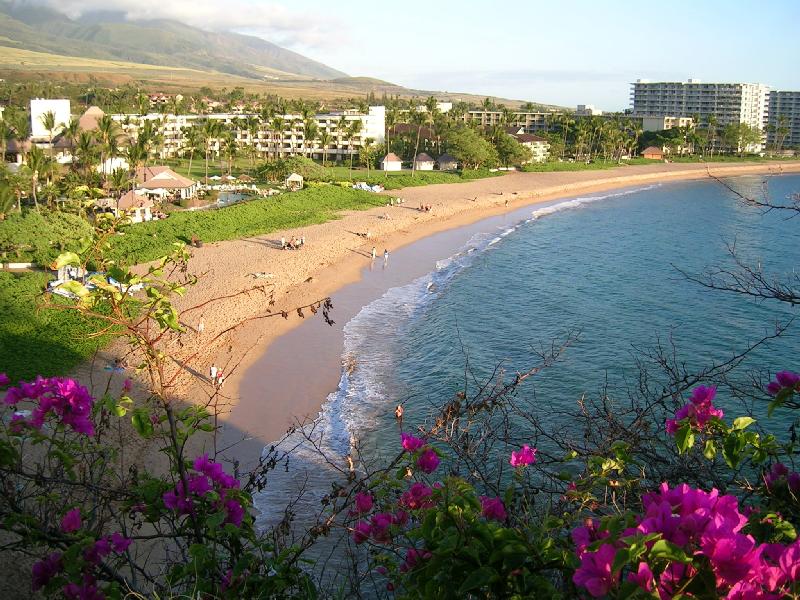
Kaanapali beach…west Maui
Light winds varying between south and southeast, are keeping our atmosphere a bit muggy…and will bring haze over some parts of the state into Sunday. Looking at the weather map just ahead, we spot the same low pressure system to the north of the islands Saturday evening. Here’s that weather map to view this low, which is keeping our normal trade winds away. Those areas that have southeast breezes this weekend, will find an area of volcanic haze approaching, which will stick around for a couple of days. There is still no clear idea about exactly when the trade winds will begin blowing again.
At the upper levels of the atmosphere, we will have a low pressure system moving by to the north of Hawaii…with its associated pool of cold air. This cold air is making our local atmosphere more unstable than it has been during this past work week. This means that whatever clouds that around, will become more shower prone. There will be a couple of source areas for these showers, which are expected to converge on our islands over the next several days. The most likely chance for showers, will be during the afternoon hours, in the upcountry areas on each of the islands. These showers aren’t expected to be widespread, although a few could be rather generous…especially by Sunday afternoon.
This upper level low is spinning in a counterclockwise fashion to the north of the islands. If you look into the area north of Hawaii, using this link…you’ll be able to spot this low pressure cell. Besides its ability to trigger more showers over the next couple of days, this late season low continues to help block our trade winds. Referring back to the satellite picture, we can see that this low is pulling moisture up from the deeper tropics to our south. At the same time, the high cirrus clouds are shifting further away to the southeast and east of the Big Island.
During this holiday weekend, we’ll find light winds, generally clear to partly cloudy mornings, cloudy afternoons, localized showers, along with some increase in haze. Often under these circumstances, the beaches can remain dry, although afternoon clouds can easily slide down the mountains towards the coasts in places. Many areas will remain petty nice under these conditions…so as we move through this holiday weekend, many locations will be just fine. Speaking of the holiday on Monday, Memorial Day, things may improve some, at least in terms of the precipitation, although the light winds will remain in place.
It’s early Saturday evening here in Kula, Maui, as I begin writing this last section of today’s narrative. Looking out the window of my weather tower this evening, I see lots of clouds cloaking the mountains, with showers falling locally…like here in Kula. There isn’t much haze around, at least that I can see yet. We can check out this looping radar image, which is showing some showers moving in towards the leeward sides of the central islands, on southerly Kona breezes. ~~~ I went down to sunny Baldwin Beach today, took a long walk on that great sandy beach, and jumped in the warm ocean afterwards. I went shopping then in Paia, and finally made my way home to Kula. I got out on my weather deck, with a pressure washer, and took off all the mold that had grabbed hold during the winter months. It was raining while I was doing that, but I didn’t let that stop me. It’s just before sunset now, and the clouds are still hugging pretty tightly to the slopes of the Haleakala Crater. ~~~ I’m going to go down and have a bite to eat now, but will be back Sunday morning with your next new weather narrative then. I hope you have a great Saturday night until then. I expect very similar conditions on Sunday that we saw happening on Saturday, in terms of weather. I’m going to sign off now, as the next wave of pretty heavy showers moves over this upcountry location. Aloha for now…Glenn.
Interesting: Wings which redirect air to waggle sideways could cut airline fuel bills by 20% according to research funded by the Engineering and Physical Sciences Research Council (EPSRC) and Airbus. The new approach, which promises to dramatically reduce mid-flight drag, uses tiny air powered jets which redirect the air, making it flow sideways back and forth over the wing.
The jets work by the Helmholtz resonance principle – when air is forced into a cavity the pressure increases, which forces air out and sucks it back in again, causing an oscillation – the same phenomenon that happen when blowing over a bottle. Dr Duncan Lockerby, from the University of Warwick, who is leading the project, said: “This has come as a bit of a surprise to all of us in the aerodynamics community.
It was discovered, essentially, by waggling a piece of wing from side to side in a wind tunnel.” “The truth is we’re not exactly sure why this technology reduces drag but with the pressure of climate change we can’t afford to wait around to find out. So we are pushing ahead with prototypes and have a separate three year project to look more carefully at the physics behind it.”
Interesting2: After thoroughly investigating Victoria Crater on Mars for two years, the instruments aboard the Rover Opportunity reveal more evidence of our neighboring red planet’s windy, wet and wild past. Opportunity’s two-year exploration of Victoria Crater – a half-mile wide and 250 feet deep – yielded a treasury of information about the planet’s geologic history and supported previous findings indicating that water once flowed on the planet’s surface, according to Steve Squyres, Cornell professor of astronomy and the principal investigator for NASA’s Mars Exploration Rover mission.
The rover is now heading south toward Endeavor crater, 8.5 miles away. Many of those observations – of hematite spheres ("blueberries"), sulfate-rich sandstone and small chunks of rock containing kamacite, troilite and other minerals commonly found in meteorites – are consistent with Opportunity’s findings across Meridiani Planum.
"It shows that the processes that we investigated in detail for the first time at Endurance crater [where Opportunity spent six months in 2004] are regional in scale, [indicating that] the kinds of conclusions that we first reached at Endurance apply perhaps across Meridiani," said Squyres. Still, there are a few key differences.
The rim of Victoria Crater is about 30m higher than the rim of Endurance, said Squyres; and as the rover drove south toward Victoria the hematite blueberries in the soil became ever fewer and smaller. Rocks deep inside the crater, however, contained big blueberries – indicating that the rocks higher up had less interaction with water – and thus the water’s source was likely underground.
The overview of the findings is published in the latest issue of the journal Science (May 22, 2009). Detailed analysis of the Victoria data will occupy researchers for years to come, said Jim Bell, professor of astronomy and leader of the mission’s Pancam color camera team.
Interesting3: Eating fish – long considered ‘brain food’ – may really be good for the old grey matter, as is a healthy dose of sunshine, new research suggests. University of Manchester scientists in collaboration with colleagues from other European centers have shown that higher levels of vitamin D – primarily synthesized in the skin following sun exposure but also found in certain foods such as oily fish – are associated with improved cognitive function in middle-aged and older men.
The study, published in the Journal of Neurology, Neurosurgery and Psychiatry, compared the cognitive performance of more than 3,000 men aged 40 to 79 years at eight test centers across Europe. The researchers found that men with higher levels of vitamin D performed consistently better in a simple and sensitive neuropsychological test that assesses an individual’s attention and speed of information processing.
“Previous studies exploring the relationship between vitamin D and cognitive performance in adults have produced inconsistent findings but we observed a significant, independent association between a slower information processing speed and lower levels of vitamin D,” said lead author Dr David Lee, in Manchester’s School of Translational Medicine.
“The main strengths of our study are that it is based on a large population sample and took into account potential interfering factors, such as depression, season and levels of physical activity.
“Interestingly, the association between increased vitamin D and faster information processing was more significant in men aged over 60 years, although the biological reasons for this remain unclear.”
“The positive effects vitamin D appears to have on the brain need to be explored further but certainly raise questions about its potential benefit for minimizing ageing-related declines in cognitive performance.”
Interesting4: A new study from Harvard School of Public Health (HSPH) researchers found that participants who drank for a week from polycarbonate bottles — the popular, hard-plastic drinking bottles and baby bottles — showed a two-thirds increase in their urine of the chemical bisphenol A (BPA). Exposure to BPA, used in the manufacture of polycarbonate and other plastics, has been shown to interfere with reproductive development in animals and has been linked with cardiovascular disease and diabetes in humans.
The study is the first to show that drinking from polycarbonate bottles increased the level of urinary BPA, and thus suggests that drinking containers made with BPA release the chemical into the liquid that people drink in sufficient amounts to increase the level of BPA excreted in human urine.
In addition to polycarbonate bottles, which are refillable and a popular container among students, campers and others and are also used as baby bottles, BPA is also found in dentistry composites and sealants and in the lining of aluminum food and beverage cans. (In bottles, polycarbonate can be identified by the recycling number 7.)
Numerous studies have shown that it acts as an endocrine-disruptor in animals, including early onset of sexual maturation, altered development and tissue organization of the mammary gland and decreased sperm production in offspring. It may be most harmful in the stages of early development. "We found that drinking cold liquids from polycarbonate bottles for just one week increased urinary BPA levels by more than two-thirds.
If you heat those bottles, as is the case with baby bottles, we would expect the levels to be considerably higher. This would be of concern since infants may be particularly susceptible to BPA’s endocrine-disrupting potential," said Karin B. Michels, associate professor of epidemiology at HSPH and Harvard Medical School and senior author of the study.
Interesting5: A new article in the journal Risk Analysis assessed various ways in which aerosol transmission of the flu, a central mode of diffusion which involves breathing droplets in the air, can be reduced. Results show that face protection is a key infection control measure for influenza and can thus affect how people should try to protect themselves from the swine flu.
Lawrence M. Wein, Ph.D., and Michael P. Atkinson of Stanford University constructed a mathematical model of aerosol transmission of the flu to explore infection control measures in the home.
Their model predicted that the use of face protection including N95 respirators (these fit tight around the face and are often worn by construction workers) and surgical masks (these fit looser around the face and are often worn by dental hygienists) are effective in preventing the flu. The filters in surgical masks keep out 98 percent of the virus.
Also, only 30 percent of the benefits of the respirators and masks are achieved if they are used only after an infected person develops symptoms. "Our research aids in the understanding of the efficacy of infection control measures for influenza, and provides a framework about the routes of transmission," the authors conclude. This timely article has the potential to impact current efforts and recommendations to control the so-called swine flu by international, national and local governments in perspective.
Interesting6: It’s been popular in New York and other places where open space is at a premium, so San Francisco figured, "eh, why not?" The first reclamation of street space to create a pedestrian plaza opened last week on San Francisco’s famous Castro Street at the intersection with 17th St. It’s a small space, maybe 1000 square feet in sum, but it’s symbolic, and perhaps a hopeful sign for pavement reclamation enthusiasts everywhere.
The idea is to close a section of street to vehicular traffic, so that citizens can have a place to eat, drink coffee, read the paper, and generally hang out outside. As part of San Francisco’s Pavement to Parks Program, it is the first of what some hope will be many pieces of paved street that are repositioned as business centers. If successful, the 17th and Castro plaza will be made permanent, and likely many others will follow in the city and perhaps in other cities.
It makes the city more walkable and pedestrian friendly, and marks a stark contrast to the never-ending paving of America that began in earnest in the 1950’s and continues to do this day in most parts of the country. And it’s one of the big reasons why people love cities like San Francisco and New York and are increasingly returning to them as the illusions of suburbia burst like gnats on a windshield.
Interesting7: With all the potential good wind power could do for the carbon economy, one of the objections hindering its implementation is aesthetic; people simply don’t want massive turbines dotting the landscape and marring their views. The Dutch founder of London’s Solar Botanic Ltd. was wrestling with that very issue in 2002 when the idea began to blossom: why not redesign the technology to blend into the natural world?
Founded last year, Solar Botanic’s ambitious goal involves layering existing technologies three-fold into the natural form of a leaf and producing fake power-producing trees that individually could power an entire home.
Each "nanoleaf" would incorporate photovoltaics for collecting solar power, thermoelectrics for converting the sun’s heat to electricity, and piezoelectric nanogenerators in the leaves’ petioles (the stalk connecting the leaf to the branch) that capture the kinetic energy from the wind rustling the leaves.
Solar Botanic estimates that a single tree with a canopy 20 feet in diameter could power an average home, producing about 120,000 kilowatt-hours over two decades. Forests, on the other hand, could power entire population centers.
But a more reasonable deployment scenario involves greening up parking lots while providing power to charge electric vehicles or planting the "trees" along highways to capture the turbulence of passing traffic.
Interesting8: After tickling the tongue, artificial sweeteners pass through our bodies and end up in wastewater virtually unchanged. Some sweeteners are particularly widespread in the environment, according to a new study, making them ideal markers for following pollution from treatment plants and other sources into the environment.
"Groundwater can be polluted by several sources, and it’s sometimes not clear where that pollution comes from," said Ignaz Buerge, an environmental chemist at the Swiss Federal Research Station in Schloss. "We now have a marker of domestic wastewater which can be used in tracing pollution." Contaminated groundwater is both an environmental and public health issue.
Once run-off gets into the environment, though, it can be hard to know whether it came from industry, agricultural fields, traffic, homes or other sources. Scientists have been looking for marker molecules that might help them track down and possibly reduce some of these inputs.
Interesting9: Globally, 85 per cent of reefs have been lost. Destructive fishing practices, disease and coastal development threaten many of the survivors. What sounds like an apocalyptic vision of the future for the world’s tropical corals is in fact a chilling assessment of the current state of reefs built in cooler waters by oysters and other bivalve shellfish. According to a report from
The Nature Conservancy (TNC), released this week at the International Marine Conservation Congress in Washington DC, shellfish reefs are the world’s most imperiled marine habitats – faring worse than coral reefs and mangrove forests.
TNC’s team scoured the literature, surveyed scientists and analyzed fisheries statistics to assess the health of reefs in 144 bays and estuaries in 44 "eco-regions" across the globe.
In most bays, shellfish reefs are down to around 10 per cent of their historical abundance. In many former strongholds – such as in North America, Europe and Australia – they are all but extinct.
Reasons for the decline vary, but include overfishing, introduction of exotic species, and disturbance from human activities. In Europe, Pacific oysters introduced for aquaculture are now moving from southern latitudes into the North Sea, where they are outcompeting native mussels – with knock-on effects for other wildlife.
In the Gulf of Mexico off the south-eastern US, meanwhile, the water demands of Atlanta and other cities mean river flows are down, making estuaries more salty and allowing invading marine predators to feast on native oysters. The good news is that oyster reefs can bounce back, if managed with care.
Posted by Glenn
1 Comment
May 22-23, 2009
Air Temperatures – The following maximum temperatures were recorded across the state of Hawaii Friday afternoon:
Lihue, Kauai – 81
Honolulu, Oahu – 82
Kaneohe, Oahu – 81
Kahului, Maui – 83
Hilo, Hawaii – 82
Kailua-kona – 83
Air Temperatures ranged between these warmest and coolest spots near sea level – and on the highest mountains…at 5 p.m. Friday evening:
Kailua-kona – 80F
Lihue, Kauai – 74
Haleakala Crater – 41 (near 10,000 feet on Maui)
Mauna Kea summit – 37 (near 14,000 feet on the Big Island)
Precipitation Totals – The following numbers represent the largest precipitation totals (inches) during the last 24 hours on each of the major islands, as of Friday evening:
0.26 Lihue, Kauai
0.03 Kahuku Training Area, Oahu
0.00 Molokai
0.00 Lanai
0.00 Kahoolawe
0.01 West Wailuaiki, Maui
0.06 Piihonua, Big Island
Marine Environment – Here’s the latest (automatically updated) weather map shows a low pressure system to the north of the state, with an associated trough near Kauai. This map also shows a high pressure system far to the northwest, with another cell far to the northeast. The low is located in an area, which is acting like a blocking force…not allowing the normal trade winds to blow across our tropical latitudes. Winds will be light generally south to southeast Saturday and Sunday.
Satellite and Radar Images: To view the cloud conditions we have here in Hawaii, please use the following satellite links, starting off with the Infrared Satellite Image of the islands to see all the clouds around the state during the day and night. This next image is one that gives close images of the islands only during the daytime hours, and is referred to as a Close-up visible image. This next image shows a larger view of the Pacific…giving perspective to the wider ranging cloud patterns in the Pacific Ocean. Finally, here’s a looping IR satellite image, making viewable the clouds around the islands 24 hours a day. To help you keep track of where any showers may be around the islands, here’s the latest animated radar image.
Hawaii’s Mountains – Here’s a link to the live webcam on the summit of near 14,000 foot Mauna Kea on the Big Island of Hawaii. The tallest peak on the island of Maui is the Haleakala Crater, which is near 10,000 feet in elevation. These two webcams are available during the daylight hours here in the islands…and when there’s a big moon rising just after sunset for an hour or two! Plus, during the nights and early mornings you will be able to see stars, and the sunrise too…depending upon weather conditions.
Aloha Paragraphs

Lush windward east Maui
Weak to non-existent winds continue over the islands Friday night, with sea breezes moving inland during the days. The same low pressure system to the north of the islands remains in place now. We can use this weather map to see this low, which overlaps our islands to the south. Winds will be light and variable in direction going into the weekend. As a general light flow of air, at least over the ocean, will be from the southeast this weekend, it should bring an area of volcanic haze to some parts of the islands…coming up from the vents on the Big Island.
At the upper levels of the atmosphere, we will have a low pressure system moving by to the north of Hawaii…with its associated pool of cold air. This cold air will make our local atmosphere some what more unstable than it has been. This means that whatever clouds that around, will become more shower prone. There will be a couple of source areas for these showers, which may converge on our islands over the next several days. The most likely chance for shower outbreaks, will be during the afternoon hours, in the upcountry areas on each of the islands. These showers aren’t expected to be widespread or particularly heavy.
This new upper level low is spinning in a counterclockwise fashion to the north of the islands…as noted in the paragraph above. If you look into the area north of Hawaii, using this link…you’ll be able to spot this counterclockwise rotating low pressure cell. Besides its ability to trigger a few more showers over the next couple of days, this late season low continues to effectively block our trade winds. This time of year, with light winds and a sun that is nearly directly overhead during the days, we will find sultry conditions. Referring back to the satellite picture, you will find that there are more high cirrus clouds coming in our direction from west and southwest…which will filter and dim our sunshine at times.
In summary: light winds, generally clear to partly cloudy mornings, localized afternoon upcountry showers, along with some increase in haze. These words all have all the earmarks of a convective weather pattern. Often under these circumstances, the beaches can remain dry, although afternoon clouds typically slide down the mountains towards the coasts in places. Many areas will remain dry under these conditions…so going into this holiday weekend shouldn’t be too much of a problem for most areas. Speaking of the holiday on Monday, Memorial Day, things will improve generally, at least in terms of the precipitation, although the light winds will remain in place.
Looking out the window here in Kihei, at around 630pm, it’s generally quite cloudy out there. I can see from those satellite images above, that cirrus are streaming overhead in some parts of the state, Looking at this looping radar image, we can see, at least at the time of this writing, that there aren’t all that many showers falling. The majority of them are raining down over the salty ocean offshore from most of the islands. Besides the high clouds, I suspect that skies will clear overnight, with generally clear skies greeting us on Saturday.
It’s early Friday evening as I begin writing this last section of today’s weather narrative. I had to work late this evening, so I missed being able to go to the film I had wanted to
see. I’m excited about the new feature called Terminator Salvation (2009), starring Christian Bale and Sam Worthington, among others. It looks like, from viewing the trailer, like the ultimate thrill ride! This simply means that there are intense sequences of sci-fi, loaded with violence, action, and of course the bad language. As it turns out, I’ll be having to wait until next weekend to see this film, oh well. ~~~ I had thought that perhaps I’d go dancing after seeing this film, but now I’m not sure what I’ll end up doing, perhaps even just going home. At any rate, I’ll be back Saturday morning with your next new weather narrative from paradise, I hope that you have a great Friday night from wherever you happen to be reading from! Aloha for now…Glenn.
Interesting: Wings which redirect air to waggle sideways could cut airline fuel bills by 20% according to research funded by the Engineering and Physical Sciences Research Council (EPSRC) and Airbus. The new approach, which promises to dramatically reduce mid-flight drag, uses tiny air powered jets which redirect the air, making it flow sideways back and forth over the wing.
The jets work by the Helmholtz resonance principle – when air is forced into a cavity the pressure increases, which forces air out and sucks it back in again, causing an oscillation – the same phenomenon that happen when blowing over a bottle. Dr Duncan Lockerby, from the University of Warwick, who is leading the project, said: “This has come as a bit of a surprise to all of us in the aerodynamics community.
It was discovered, essentially, by waggling a piece of wing from side to side in a wind tunnel.” “The truth is we’re not exactly sure why this technology reduces drag but with the pressure of climate change we can’t afford to wait around to find out. So we are pushing ahead with prototypes and have a separate three year project to look more carefully at the physics behind it.”
Interesting2: After thoroughly investigating Victoria Crater on Mars for two years, the instruments aboard the Rover Opportunity reveal more evidence of our neighboring red planet’s windy, wet and wild past. Opportunity’s two-year exploration of Victoria Crater – a half-mile wide and 250 feet deep – yielded a treasury of information about the planet’s geologic history and supported previous findings indicating that water once flowed on the planet’s surface, according to Steve Squyres, Cornell professor of astronomy and the principal investigator for NASA’s Mars Exploration Rover mission.
The rover is now heading south toward Endeavor crater, 8.5 miles away. Many of those observations – of hematite spheres ("blueberries"), sulfate-rich sandstone and small chunks of rock containing kamacite, troilite and other minerals commonly found in meteorites – are consistent with Opportunity’s findings across Meridiani Planum.
"It shows that the processes that we investigated in detail for the first time at Endurance crater [where Opportunity spent six months in 2004] are regional in scale, [indicating that] the kinds of conclusions that we first reached at Endurance apply perhaps across Meridiani," said Squyres. Still, there are a few key differences.
The rim of Victoria Crater is about 30m higher than the rim of Endurance, said Squyres; and as the rover drove south toward Victoria the hematite blueberries in the soil became ever fewer and smaller. Rocks deep inside the crater, however, contained big blueberries – indicating that the rocks higher up had less interaction with water – and thus the water’s source was likely underground.
The overview of the findings is published in the latest issue of the journal Science (May 22, 2009). Detailed analysis of the Victoria data will occupy researchers for years to come, said Jim Bell, professor of astronomy and leader of the mission’s Pancam color camera team.
Interesting3: Eating fish – long considered ‘brain food’ – may really be good for the old grey matter, as is a healthy dose of sunshine, new research suggests. University of Manchester scientists in collaboration with colleagues from other European centers have shown that higher levels of vitamin D – primarily synthesized in the skin following sun exposure but also found in certain foods such as oily fish – are associated with improved cognitive function in middle-aged and older men.
The study, published in the Journal of Neurology, Neurosurgery and Psychiatry, compared the cognitive performance of more than 3,000 men aged 40 to 79 years at eight test centers across Europe. The researchers found that men with higher levels of vitamin D performed consistently better in a simple and sensitive neuropsychological test that assesses an individual’s attention and speed of information processing.
“Previous studies exploring the relationship between vitamin D and cognitive performance in adults have produced inconsistent findings but we observed a significant, independent association between a slower information processing speed and lower levels of vitamin D,” said lead author Dr David Lee, in Manchester’s School of Translational Medicine.
“The main strengths of our study are that it is based on a large population sample and took into account potential interfering factors, such as depression, season and levels of physical activity.
“Interestingly, the association between increased vitamin D and faster information processing was more significant in men aged over 60 years, although the biological reasons for this remain unclear.”
“The positive effects vitamin D appears to have on the brain need to be explored further but certainly raise questions about its potential benefit for minimizing ageing-related declines in cognitive performance.”
Interesting4: A new study from Harvard School of Public Health (HSPH) researchers found that participants who drank for a week from polycarbonate bottles — the popular, hard-plastic drinking bottles and baby bottles — showed a two-thirds increase in their urine of the chemical bisphenol A (BPA). Exposure to BPA, used in the manufacture of polycarbonate and other plastics, has been shown to interfere with reproductive development in animals and has been linked with cardiovascular disease and diabetes in humans.
The study is the first to show that drinking from polycarbonate bottles increased the level of urinary BPA, and thus suggests that drinking containers made with BPA release the chemical into the liquid that people drink in sufficient amounts to increase the level of BPA excreted in human urine.
In addition to polycarbonate bottles, which are refillable and a popular container among students, campers and others and are also used as baby bottles, BPA is also found in dentistry composites and sealants and in the lining of aluminum food and beverage cans. (In bottles, polycarbonate can be identified by the recycling number 7.)
Numerous studies have shown that it acts as an endocrine-disruptor in animals, including early onset of sexual maturation, altered development and tissue organization of the mammary gland and decreased sperm production in offspring. It may be most harmful in the stages of early development. "We found that drinking cold liquids from polycarbonate bottles for just one week increased urinary BPA levels by more than two-thirds.
If you heat those bottles, as is the case with baby bottles, we would expect the levels to be considerably higher. This would be of concern since infants may be particularly susceptible to BPA’s endocrine-disrupting potential," said Karin B. Michels, associate professor of epidemiology at HSPH and Harvard Medical School and senior author of the study.
Interesting5: A new article in the journal Risk Analysis assessed various ways in which aerosol transmission of the flu, a central mode of diffusion which involves breathing droplets in the air, can be reduced. Results show that face protection is a key infection control measure for influenza and can thus affect how people should try to protect themselves from the swine flu.
Lawrence M. Wein, Ph.D., and Michael P. Atkinson of Stanford University constructed a mathematical model of aerosol transmission of the flu to explore infection control measures in the home.
Their model predicted that the use of face protection including N95 respirators (these fit tight around the face and are often worn by construction workers) and surgical masks (these fit looser around the face and are often worn by dental hygienists) are effective in preventing the flu. The filters in surgical masks keep out 98 percent of the virus.
Also, only 30 percent of the benefits of the respirators and masks are achieved if they are used only after an infected person develops symptoms. "Our research aids in the understanding of the efficacy of infection control measures for influenza, and provides a framework about the routes of transmission," the authors conclude. This timely article has the potential to impact current efforts and recommendations to control the so-called swine flu by international, national and local governments in perspective.
Interesting6: It’s been popular in New York and other places where open space is at a premium, so San Francisco figured, "eh, why not?" The first reclamation of street space to create a pedestrian plaza opened last week on San Francisco’s famous Castro Street at the intersection with 17th St. It’s a small space, maybe 1000 square feet in sum, but it’s symbolic, and perhaps a hopeful sign for pavement reclamation enthusiasts everywhere.
The idea is to close a section of street to vehicular traffic, so that citizens can have a place to eat, drink coffee, read the paper, and generally hang out outside. As part of San Francisco’s Pavement to Parks Program, it is the first of what some hope will be many pieces of paved street that are repositioned as business centers. If successful, the 17th and Castro plaza will be made permanent, and likely many others will follow in the city and perhaps in other cities.
It makes the city more walkable and pedestrian friendly, and marks a stark contrast to the never-ending paving of America that began in earnest in the 1950’s and continues to do this day in most parts of the country. And it’s one of the big reasons why people love cities like San Francisco and New York and are increasingly returning to them as the illusions of suburbia burst like gnats on a windshield.
Interesting7: With all the potential good wind power could do for the carbon economy, one of the objections hindering its implementation is aesthetic; people simply don’t want massive turbines dotting the landscape and marring their views. The Dutch founder of London’s Solar Botanic Ltd. was wrestling with that very issue in 2002 when the idea began to blossom: why not redesign the technology to blend into the natural world?
Founded last year, Solar Botanic’s ambitious goal involves layering existing technologies three-fold into the natural form of a leaf and producing fake power-producing trees that individually could power an entire home.
Each "nanoleaf" would incorporate photovoltaics for collecting solar power, thermoelectrics for converting the sun’s heat to electricity, and piezoelectric nanogenerators in the leaves’ petioles (the stalk connecting the leaf to the branch) that capture the kinetic energy from the wind rustling the leaves.
Solar Botanic estimates that a single tree with a canopy 20 feet in diameter could power an average home, producing about 120,000 kilowatt-hours over two decades. Forests, on the other hand, could power entire population centers.
But a more reasonable deployment scenario involves greening up parking lots while providing power to charge electric vehicles or planting the "trees" along highways to capture the turbulence of passing traffic.
Interesting8: After tickling the tongue, artificial sweeteners pass through our bodies and end up in wastewater virtually unchanged. Some sweeteners are particularly widespread in the environment, according to a new study, making them ideal markers for following pollution from treatment plants and other sources into the environment.
"Groundwater can be polluted by several sources, and it’s sometimes not clear where that pollution comes from," said Ignaz Buerge, an environmental chemist at the Swiss Federal Research Station in Schloss. "We now have a marker of domestic wastewater which can be used in tracing pollution." Contaminated groundwater is both an environmental and public health issue.
Once run-off gets into the environment, though, it can be hard to know whether it came from industry, agricultural fields, traffic, homes or other sources. Scientists have been looking for marker molecules that might help them track down and possibly reduce some of these inputs.
Interesting9: Globally, 85 per cent of reefs have been lost. Destructive fishing practices, disease and coastal development threaten many of the survivors. What sounds like an apocalyptic vision of the future for the world’s tropical corals is in fact a chilling assessment of the current state of reefs built in cooler waters by oysters and other bivalve shellfish. According to a report from
The Nature Conservancy (TNC), released this week at the International Marine Conservation Congress in Washington DC, shellfish reefs are the world’s most imperiled marine habitats – faring worse than coral reefs and mangrove forests.
TNC’s team scoured the literature, surveyed scientists and analyzed fisheries statistics to assess the health of reefs in 144 bays and estuaries in 44 "eco-regions" across the globe.
In most bays, shellfish reefs are down to around 10 per cent of their historical abundance. In many former strongholds – such as in North America, Europe and Australia – they are all but extinct.
Reasons for the decline vary, but include overfishing, introduction of exotic species, and disturbance from human activities. In Europe, Pacific oysters introduced for aquaculture are now moving from southern latitudes into the North Sea, where they are outcompeting native mussels – with knock-on effects for other wildlife.
In the Gulf of Mexico off the south-eastern US, meanwhile, the water demands of Atlanta and other cities mean river flows are down, making estuaries more salty and allowing invading marine predators to feast on native oysters. The good news is that oyster reefs can bounce back, if managed with care.
Next Page »


